0009
Deuterium Metabolic Imaging (DMI) for 3D Mapping of Glucose Metabolism in Humans with Central Nervous System Lesions at 3T1Department of Electrical Engineering, Stanford University, Palo Alto, CA, United States, 2Department of Radiology, Stanford University, Palo Alto, CA, United States, 3Department of Neurology, Stanford University, Palo Alto, CA, United States
Synopsis
Keywords: Deuterium, Deuterium
DMI is an emerging modality for investigating glucose metabolism in vivo with application for assessing the Warburg effect in tumors. Although high-field systems, e.g. 7T, provide maximal signal-to-noise ratio (SNR), implementation on widely available 3T scanners could have immediate clinical impact. Here we explore the potential of 3T DMI using a birdcage 2H RF coil in two healthy volunteers and three patients with CNS lesions of varying pathology. Results from these experiments demonstrate the potential to examine the Warburg effect in CNS lesions with DMI at 3T and provide critical data needed to explore DMI SNR and spatial resolution limits.
Introduction
Metabolic reprogramming, also known as the Warburg Effect in which lactate production via glycolysis (GLY) is favored over oxidative phosphorylation (OXPHOS), is a hallmark of cancer1. This effect is particularly pronounced in glioma and other brain tumors and is the target of multiple oncologic therapies2. However, limitations on measuring this abnormal tumor metabolism remain a crucial obstacle to clinical translation.The recent introduction of deuterium metabolic imaging (DMI) offers a promising approach for in vivo imaging of the Warburg effect. de Feyter et al. showed DMI can map the balance of GLY and mitochondrial metabolism in patients with glioma at 4T 60-75 min following oral consumption of [6,6’-2H2]Glc 3. The ratio of 2H-Lac/Glx (glutamate+glutamine) provides a direct measure of the Warburg effect. In a preclinical animal model study, Kreis, et al. further showed that dynamic DMI acquisitions could also be used to acquire quantitative and spatially resolved measurements of glycolytic flux in tumors, which can be used to assess treatment response4. In this preliminary study, we demonstrate high-quality whole-brain metabolic maps of deuterated glucose metabolic products in both healthy adults and patients with Central Nervous System (CNS) lesions, and explore the extent to which DMI can quantify the metabolic heterogeneity across these patients.
Methods
Two normal control volunteers and three patients with varying CNS lesions were scanned. Two of these patients had diseases which were considered well-managed at the time of imaging – one with an anaplastic oligodendroglioma, Grade III but without evidence of active disease (Patient A), and the second with a glioblastoma stable on an anti-VEGF drug for several months (Patient B). The third patient had a cerebellar pilocytic astrocytoma considered to be anaplastic and behaving relatively aggressively (Patient C).All DMI scans were acquired on a GE 3T PET/MR scanner using a modified gradient filter and 2H volume RF coil approximately 45 minutes following the oral ingestion of 60g of deuterated glucose ([6,6’-2H2]Glc) as in [5]. We used spherical k-space encoded chemical shift imaging (CSI) and a 90° non-selective RF excitation pulse, a 10x10x10 cm spatial array, 2.4 cm isotropic resolution, a repetition time (TR) of 350 ms, and 13 averages yielding a total scan time of 39 minutes. Additional proton scans (T1, T2 FLAIR, and ASL) were acquired using a multi-channel proton coil to better visualize anatomy and pathology. A lower-quality reference proton scan was also taken with the same reference position to the DMI scan with the scanner’s built-in body coil to co-register the anatomical proton scans to the DMI dataset.
DMI datasets were processed using DMIWizard, an open-source Matlab-based toolbox [6]. Raw k-space data were zero-padded, phase-corrected, Fourier Transformed and spectrally apodised by 5 Hz. The subsequent spectra were quantified through least-squares fitting to generate metabolic maps of deuterated water (HDO), glucose (2H-Glc), glutamine/glutamate (2H-Glx) and lactate (2H-Lac). The ratio of Lac/(Glx+Lac) was used to quantify the fraction of glucose metabolism that undergoes GLY (as opposed to OXPHOS), a possible measure of the Warburg effect. The additional proton scans acquired with a conventional multi-channel head coil were aligned to the body-coil proton scan (and therefore the DMI dataset) acquired with the 2H coil in place via rigid registration using the SimpleITK toolkit [7].
Results
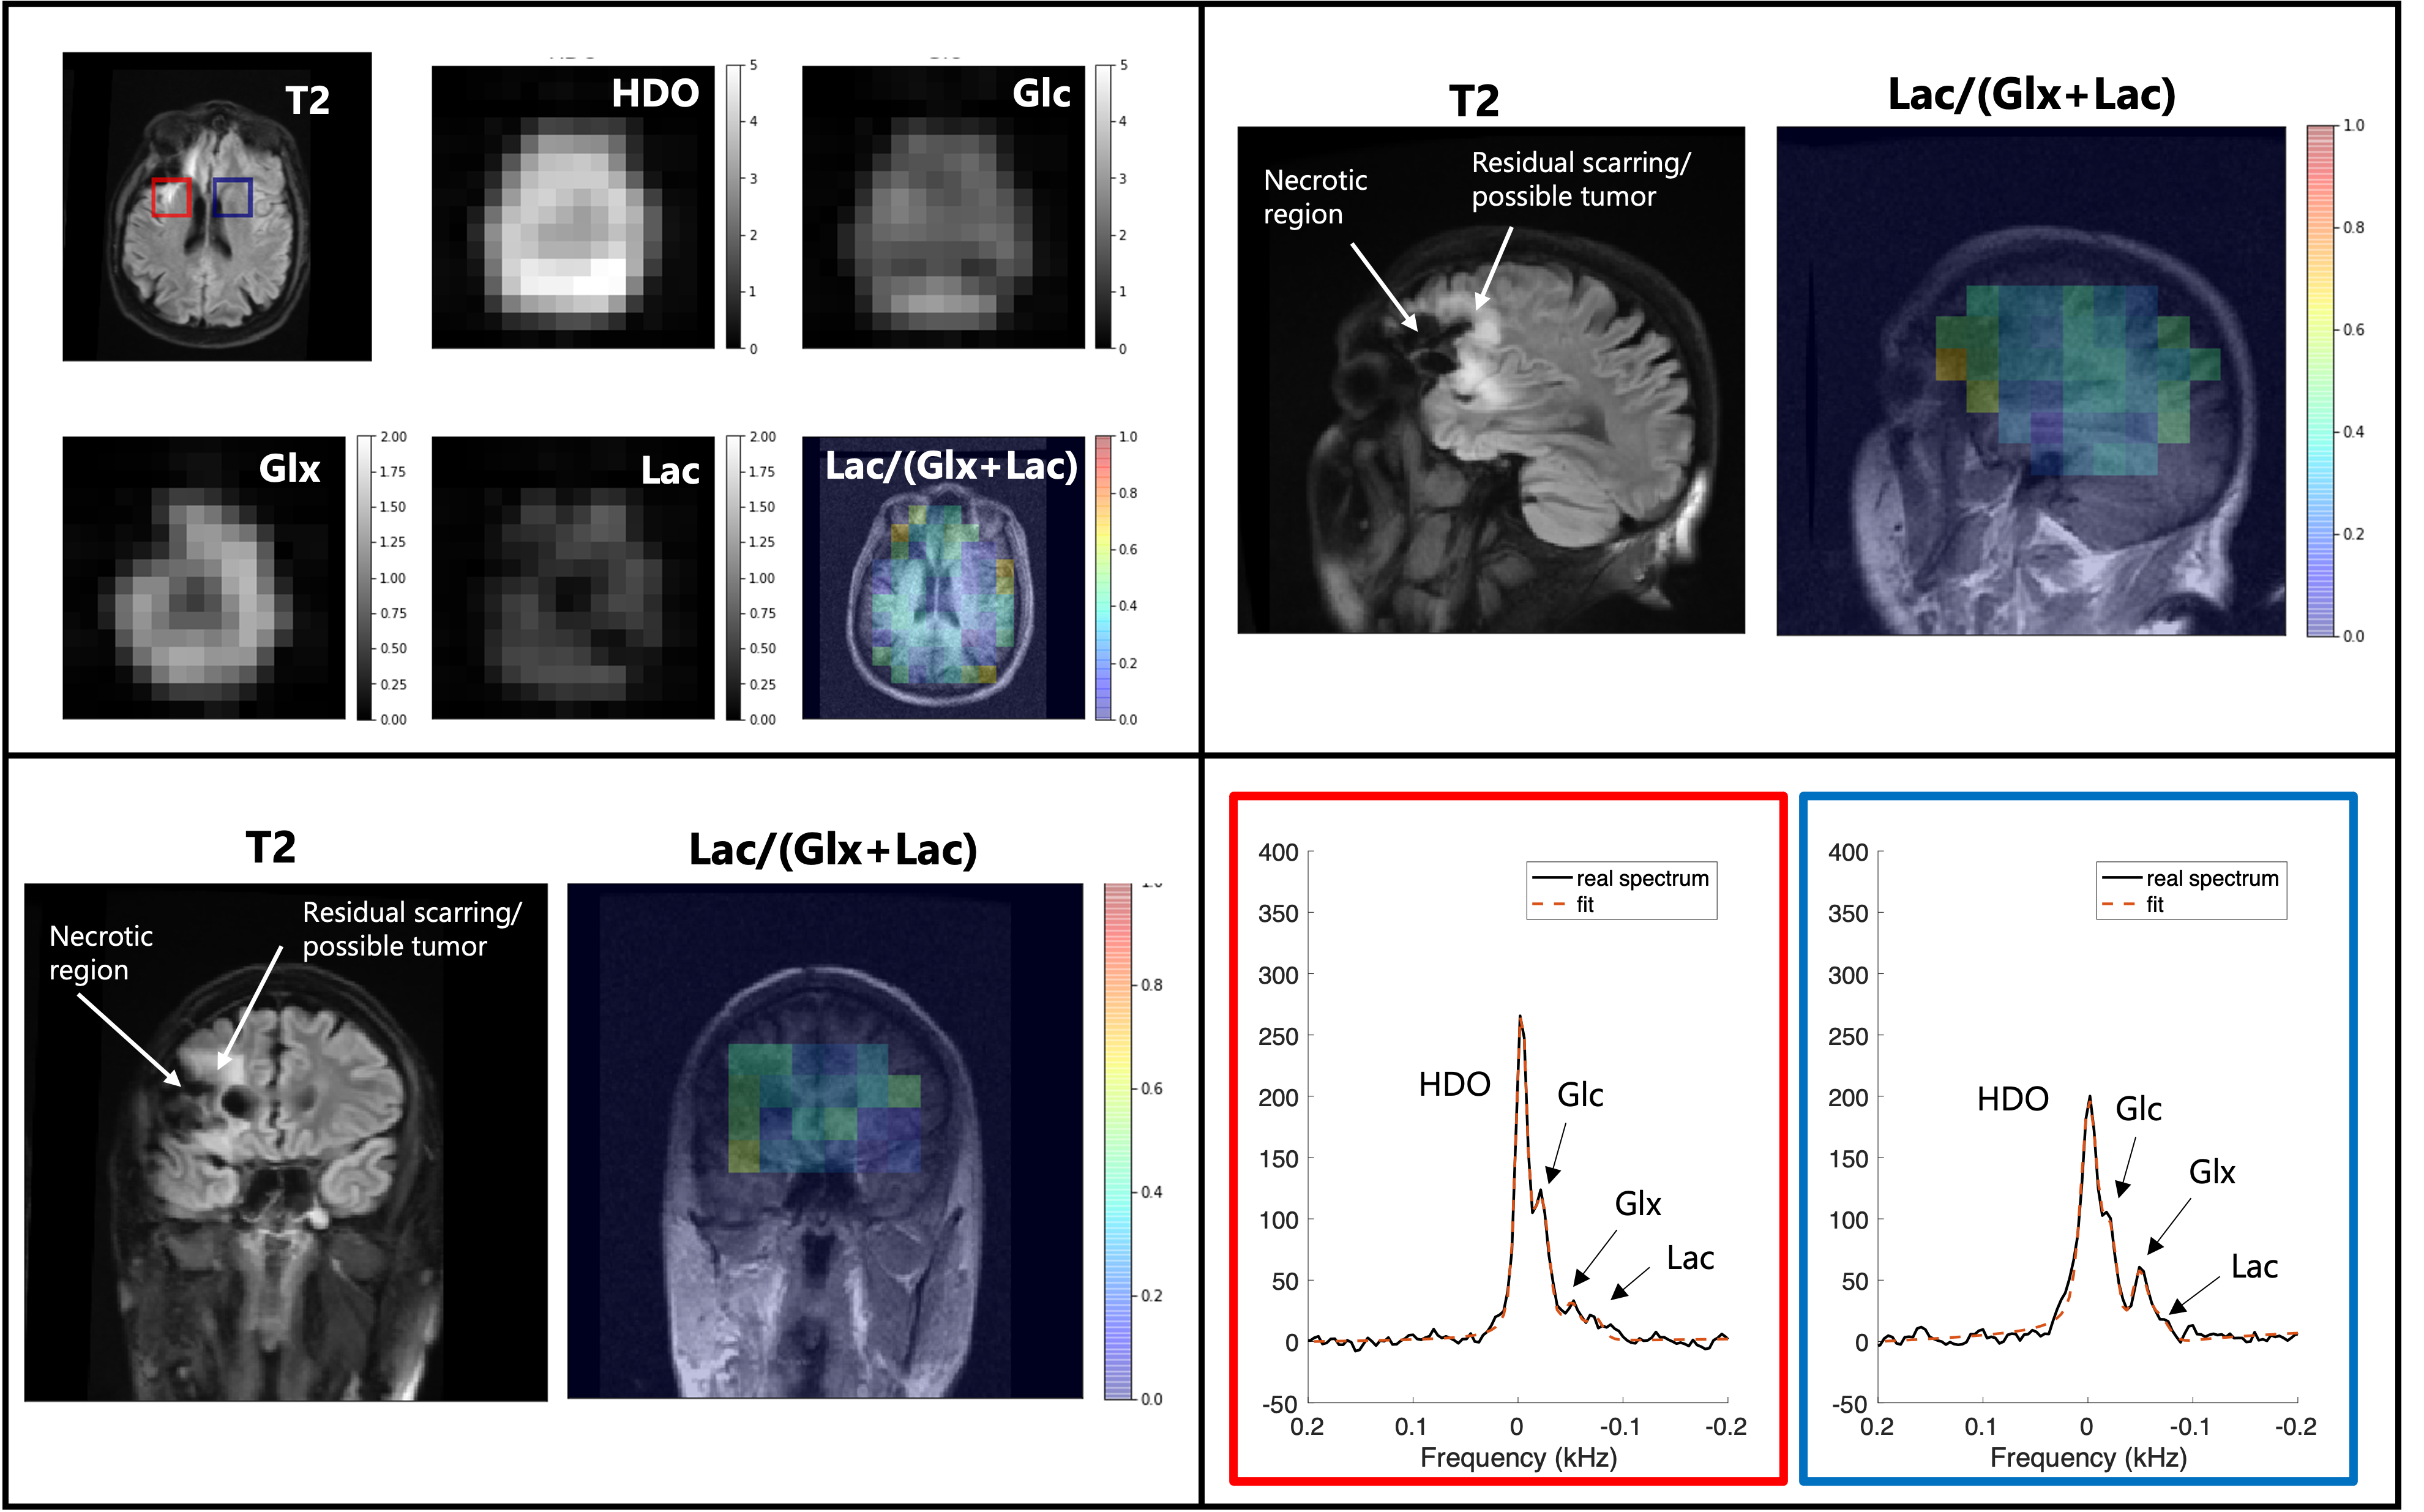
Representative metabolic maps, corresponding anatomical scans, and example spectra of a healthy control, a patient with a well-controlled CNS lesion (Patient A), and a patient with a more aggressive CNS lesion (Patient C) are shown in Figures 1, 2 and 3 respectively. Figure 4 compares the Lac/(Glx+Lac) fraction across all five subjects. 3D whole-brain coverage is achieved in these DMI scans, including areas typically plagued by inhomogeneities in proton MRS such as near the brainstem. Good anatomical correspondence between the cerebrospinal fluid and lowered 2H-Glx is notable in the healthy control (Figure 1). Patient A shows a decrease in 2H-Glx in the necrotic region of the lesion without a corresponding increase in 2H-Lac (Figure 2). Patient C shows decreased Glx as well in the necrotic region of the lesion, with a moderate increase in Lac as seen most clearly on the Lac/(Glx+Lac) map (Figure 3). All patients show an elevated “Lac” signal near the skull due to partial voluming from the natural abundance 2H-lipid peaks overlapping the lactate resonance.Discussion
Following the oral ingestion of deuterated glucose, we used a modified gradient filter, home-built 2H volume RF coil, and spherical k-space sampling in a 3D CSI acquisition to obtain high quality whole-brain metabolic images of 2H-labeled water and glucose metabolic products. We explored the ability to quantify local glucose metabolism in correspondence to anatomical landmarks across patients with varying CNS lesions, and see evidence of the Warburg effect in one patient with the most active disease. Quantification is limited by SNR and spatial resolution, which in future work will be improved through optimizing pulse sequence parameters and machine-learning based multi-modal image denoising.Acknowledgements
NIH R01 CA245097, Berg LLCReferences
1. Corbin, Z., Spielman, D. & Recht, L. A Metabolic Therapy for Malignant Glioma Requires a Clinical Measure. Curr Oncol Rep 19, 84, doi:10.1007/s11912-017-0637-y (2017).
2. Phan, Liem Minh, Sai-Ching Jim Yeung, and Mong-Hong Lee. "Cancer metabolic reprogramming: importance, main features, and potentials for precise targeted anti-cancer therapies." Cancer biology & medicine 11.1 (2014).
3. De Feyter, H. M. et al. Deuterium metabolic imaging (DMI) for MRI-based 3D mapping of metabolism in vivo. Sci Adv 4, eaat7314, doi:10.1126/sciadv.aat7314 (2018).
4. Kreis, F. et al. Measuring Tumor Glycolytic Flux in Vivo by Using Fast Deuterium MRI. Radiology 294, 289-296, doi:10.1148/radiol.2019191242 (2020).
5. Adamson, P. M., Datta, K., Watkins, R., Recht, L., Hurd, R., & Spielman, D. Deuterium Metabolic Imaging for 3D Mapping of Human Brain Metabolism at 3T. Joint Annual Meeting ISMRM-ESMRMB & ISMRT 31st Annual Meeting, London, UK (2022).
6. de Graaf, R. DMIWizard Yale University, MRRC (2021). https://medicine.yale.edu/lab/dmi/resources/software/.
7. R. Beare, B. C. Lowekamp, Z. Yaniv, “Image Segmentation, Registration and Characterization in R with SimpleITK”, J Stat Softw, 86(8), doi: 10.18637/jss.v086.i08, 2018.
Figures
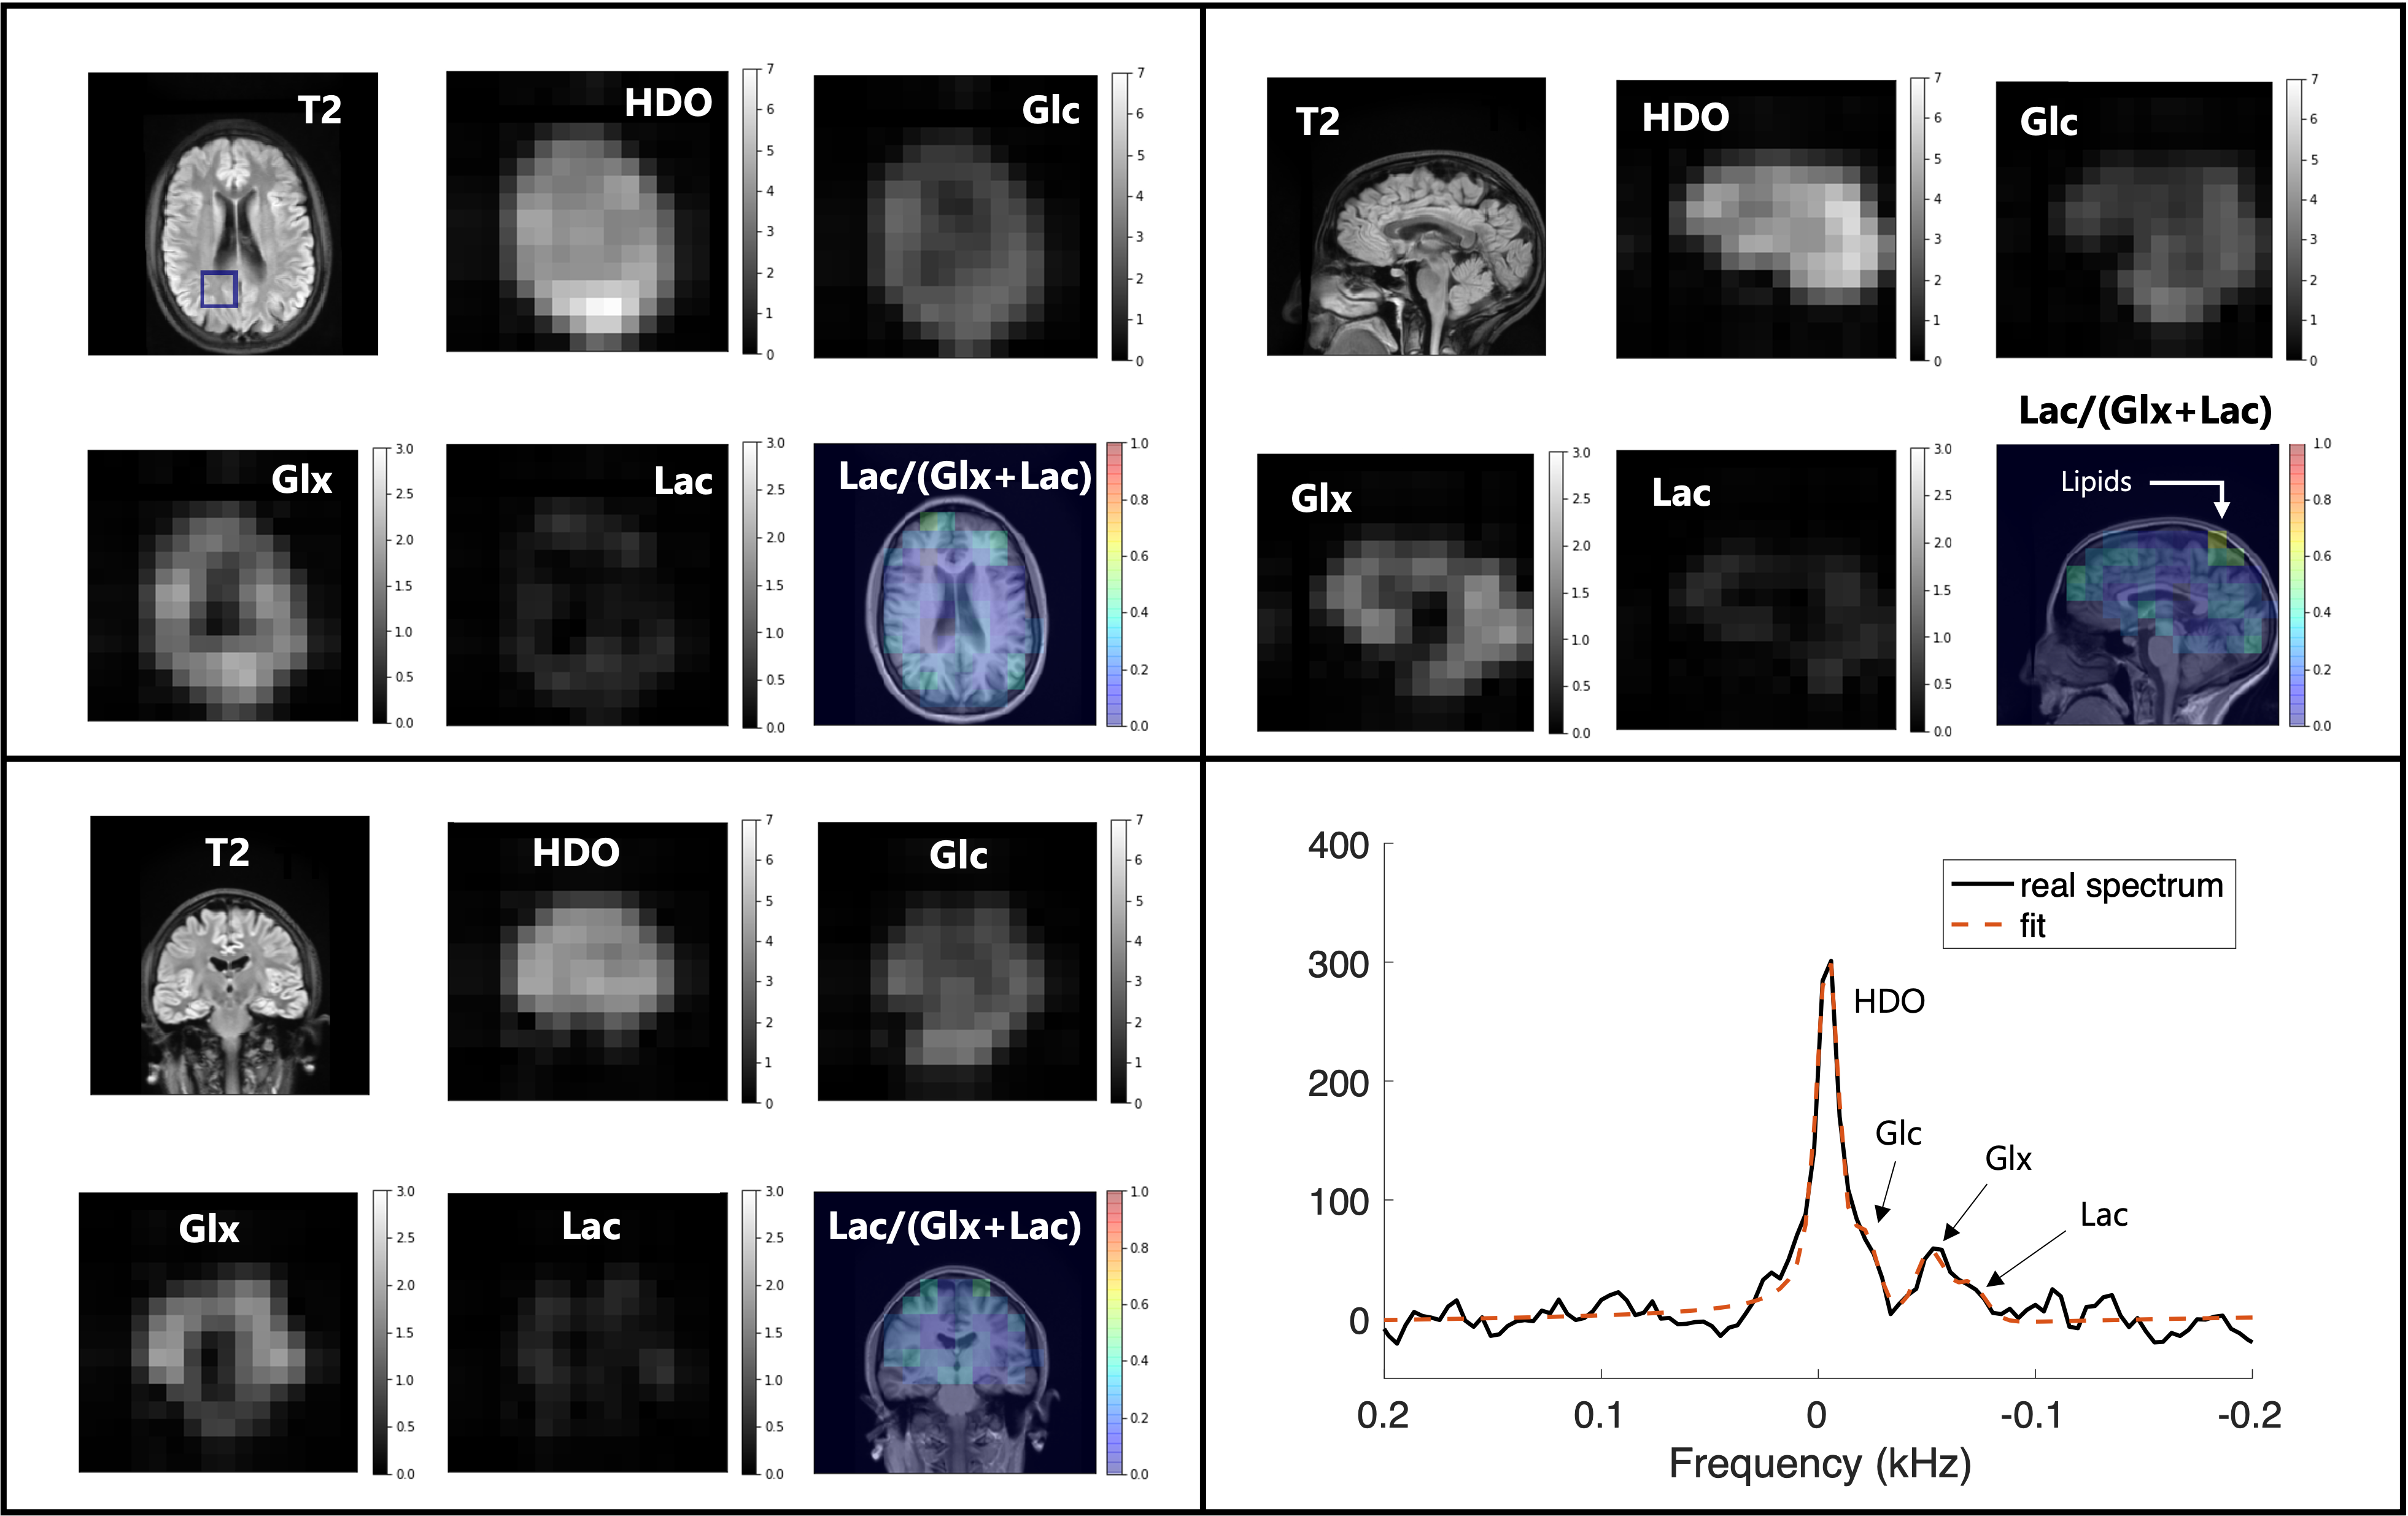
Representative axial, sagittal and coronal slices of a 39 minute DMI scan from a normal control. Each view contains an anatomical scan, HDO, Glc, Glx, Lac and Lac/(Glx+Lac) metabolic maps. An example spectrum (black) and least-squares fit (orange) can be seen on the bottom right and corresponds to the blue box shown in the T2 axial scan. Good anatomical correspondence can be seen between the cerebrospinal fluid and decrease in Glx. Minimal to no Lac signal is observed, though natural-abundance signal from lipids near the skull have overlapping resonances.
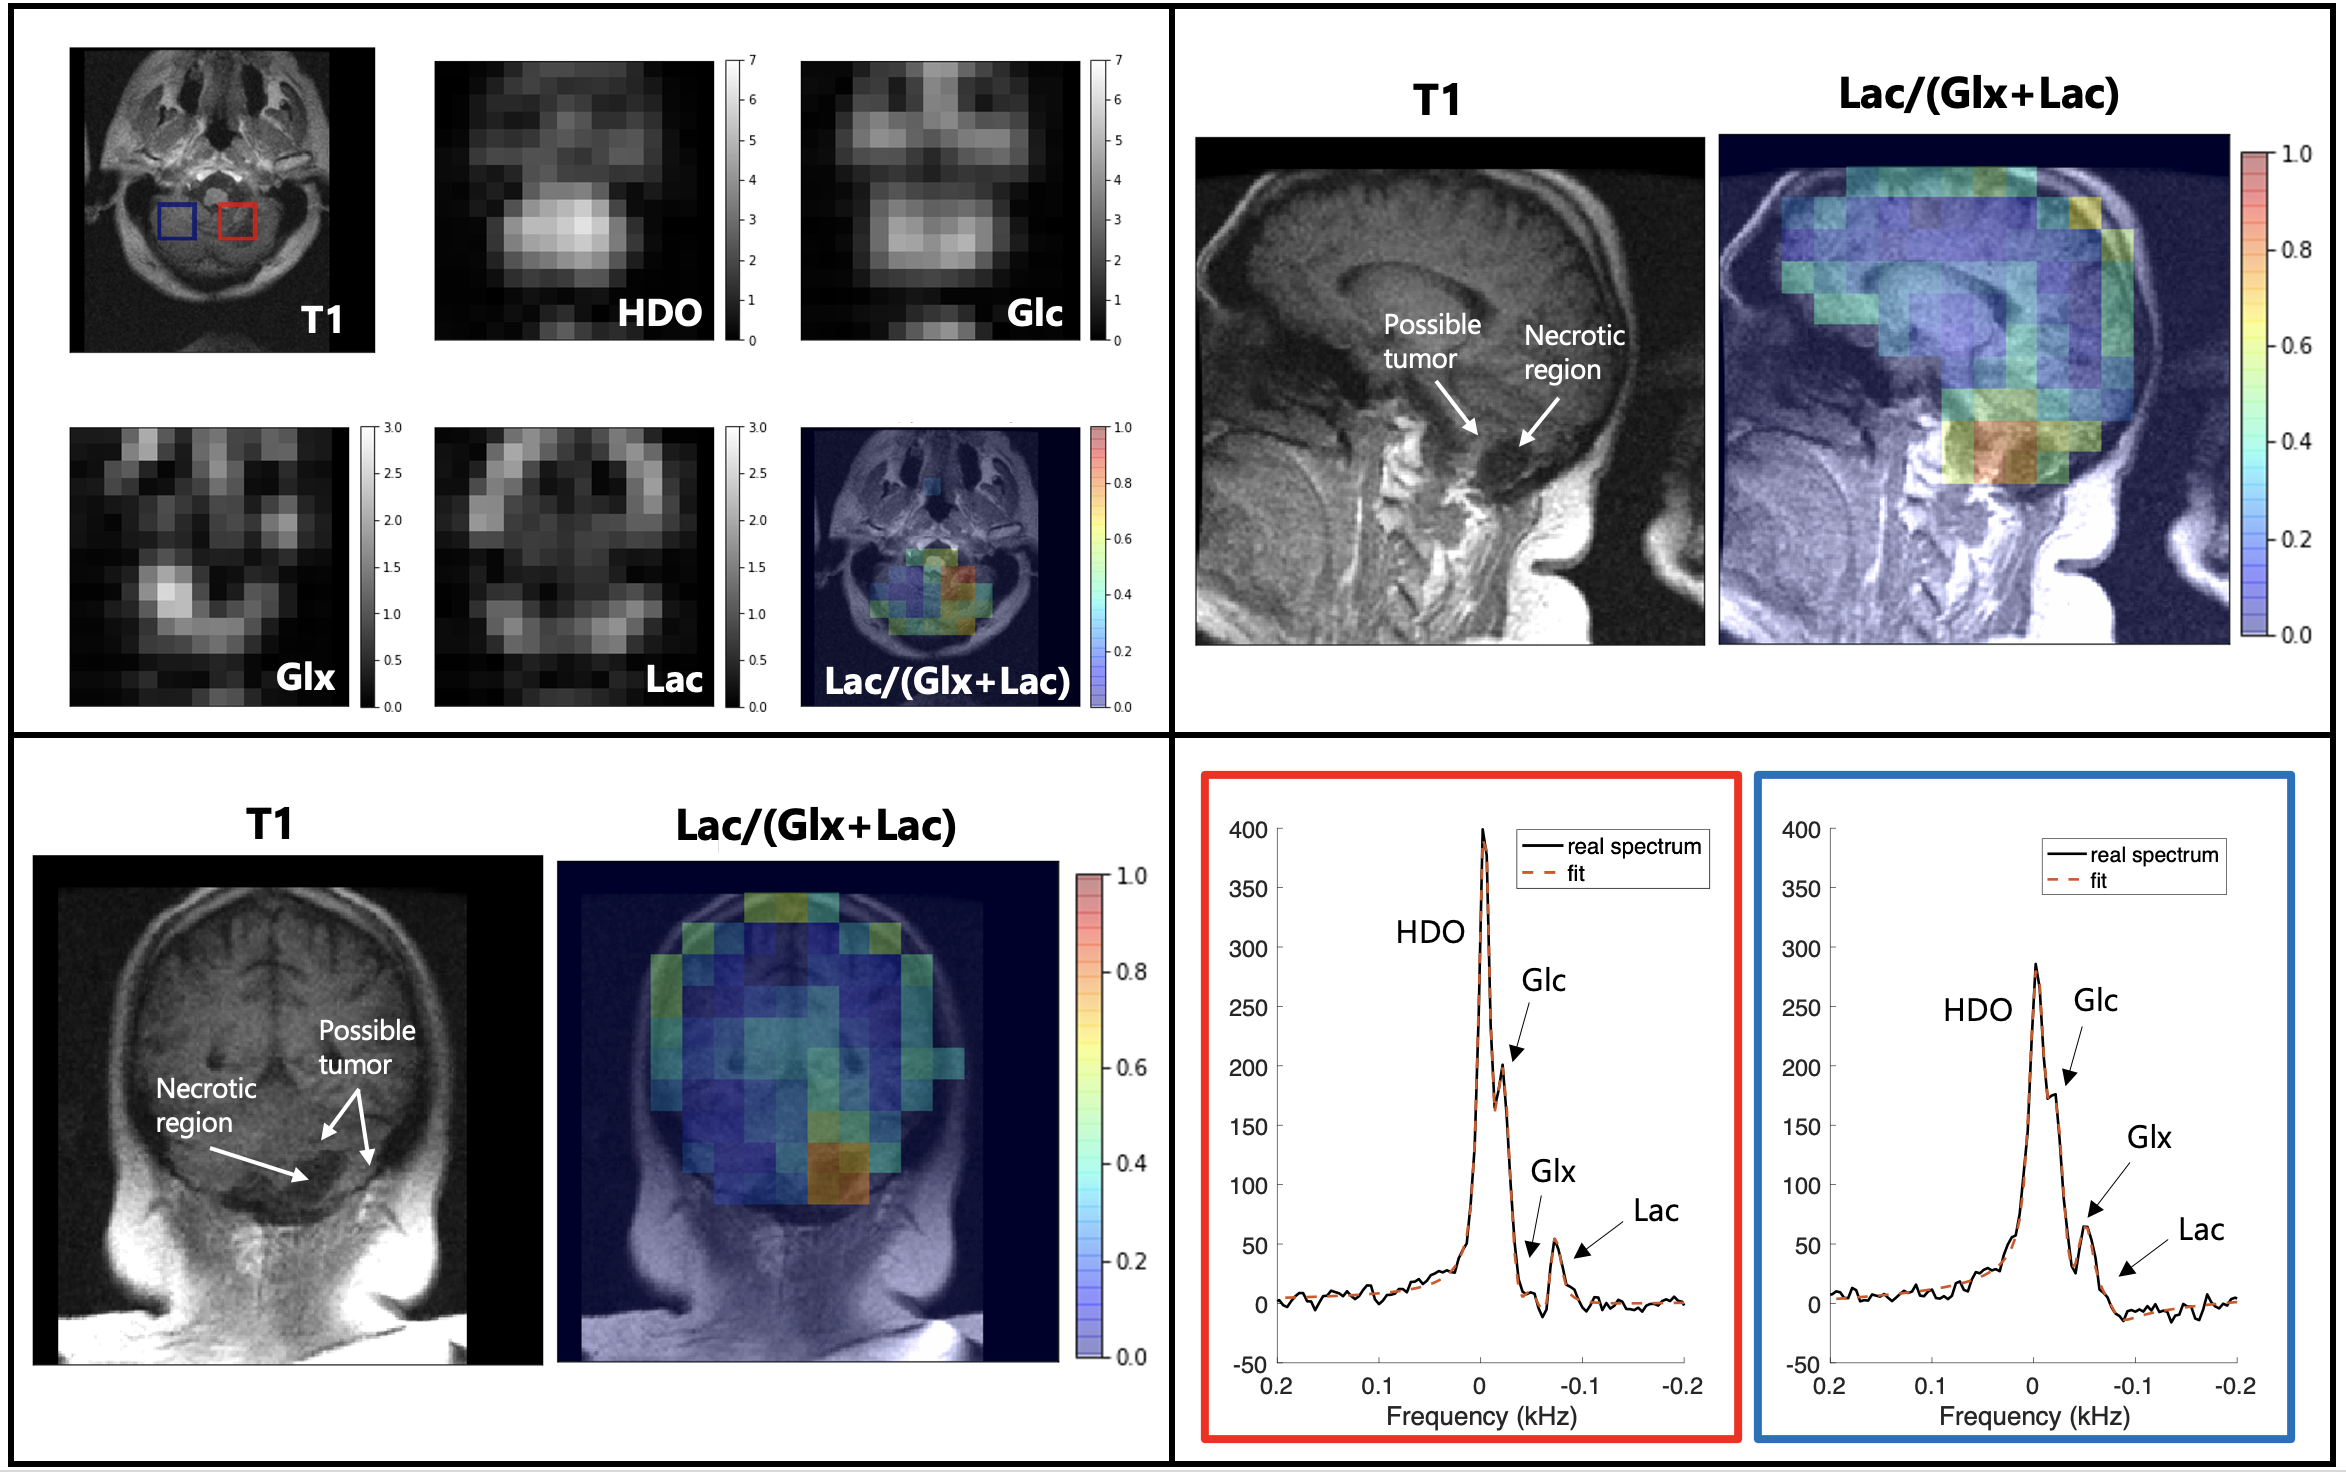
Representative slices of a 39 minute DMI scan from a patient with a more aggressive CNS lesion (Patient C). The axial slice shows an anatomical scan, HDO, Glc, Glx, Lac and Lac/(Glx+Lac) metabolic maps. Anatomical scans and Lac/(Glx+Lac) metabolic maps are shown for the other slices. Example spectra (black) and least-squares fit (orange) correspond to the red box and blue box in the axial anatomical scan respectively. Glucose uptake can be seen bilaterally in the cerebellum. Glx decreases and Lac increases on the patient left near the lesion (red) in contrast to the patient right (blue).
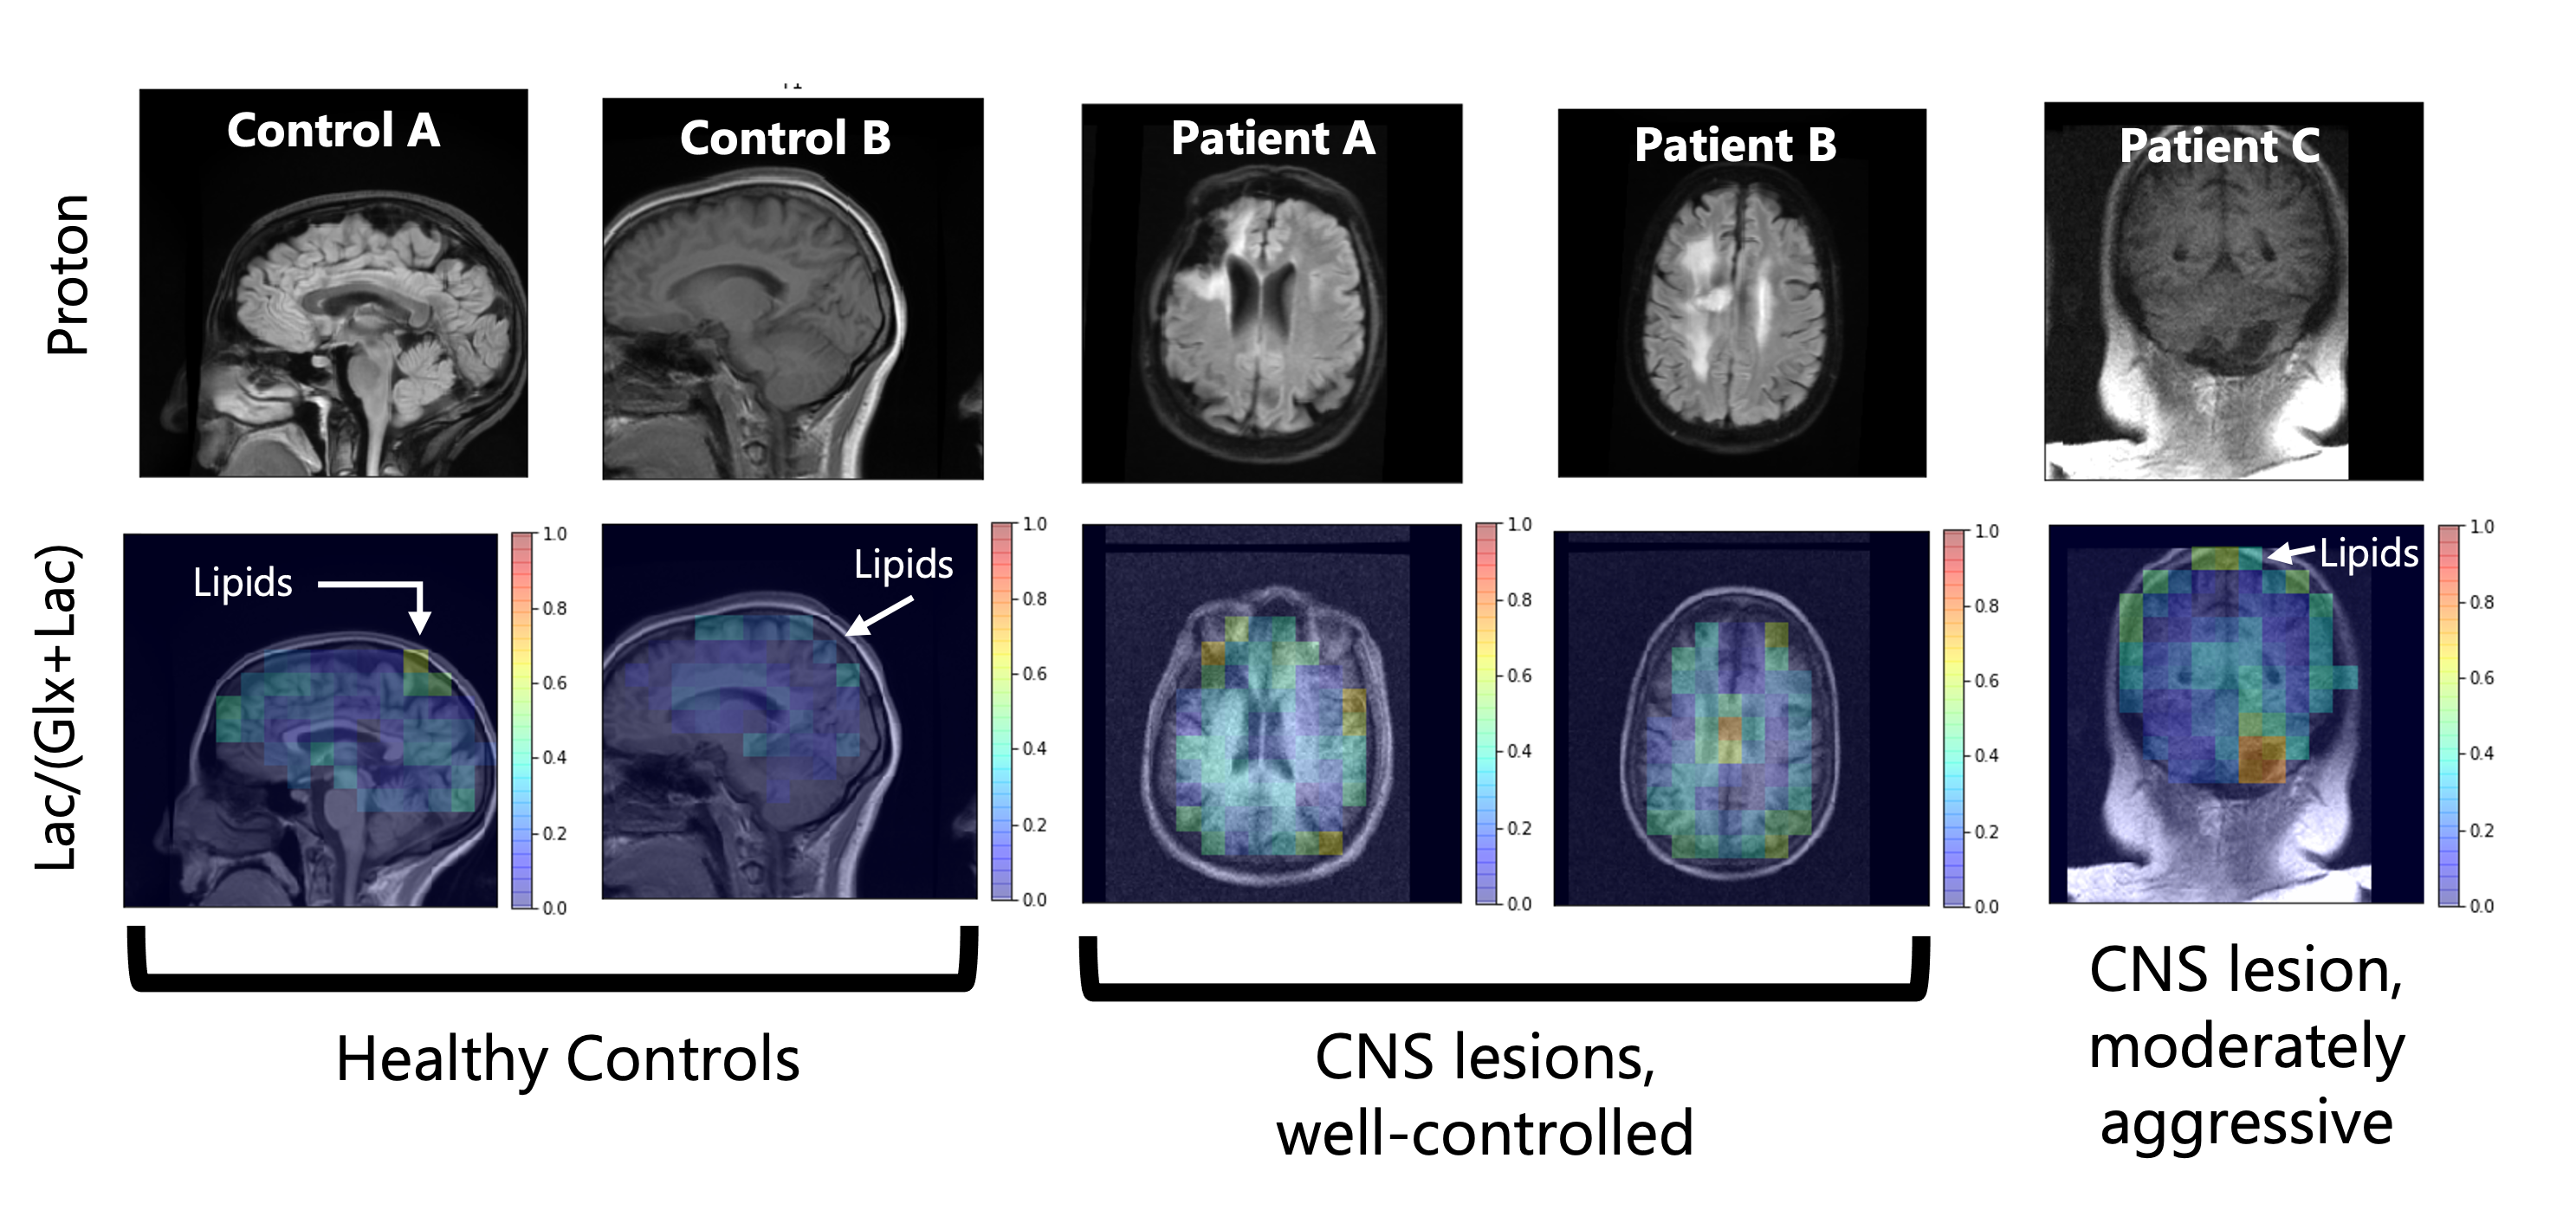
Representative anatomical scans and Lac/(Glx+Lac) maps from all five scan subjects – two healthy controls, two well-controlled CNS lesions, and a moderately aggressive CNS lesion. Healthy controls do not show elevated lactate, though natural-abundance signal from the lipids have overlapping resonances. The well-controlled CNS lesions (Patients A & B) have decreased Glx from necrotic regions of their lesions. The more aggressive lesion in Patient C has an elevated Lac/(Glx+Lac) signal around the lesion, potentially indicative of the Warburg effect.