0008
Quantification of Blood-Brain Barrier Water Exchange & Permeability with Multi-Delay Diffusion Weighted pCASL
Xingfeng Shao1, Chenyang Zhao1, Qinyang Shou1, Keith S St Lawrence2,3, and Danny JJ Wang1
1Laboratory of FMRI Technology (LOFT), Mark & Mary Stevens Neuroimaging and Informatics Institute, Keck School of Medicine, University of Southern California, Los Angeles, CA, United States, 2Lawson Health Research Institute, London, ON, Canada, 3Department of Medical Biophysics, Western University, London, ON, Canada
1Laboratory of FMRI Technology (LOFT), Mark & Mary Stevens Neuroimaging and Informatics Institute, Keck School of Medicine, University of Southern California, Los Angeles, CA, United States, 2Lawson Health Research Institute, London, ON, Canada, 3Department of Medical Biophysics, Western University, London, ON, Canada
Synopsis
Keywords: YIA, Diffusion/other diffusion imaging techniques, Blood-brain barrier, water exchange, diffusion weighted perfusion imaging
We developed an innovate pulse sequence and acquired diffusion weighted pCASL signals from a wide range of PLDs with improved SNR and spatial resolution. A 3-compartment single-pass approximation (SPA) model, which includes an additional venous compartment, was proposed to capture the full dynamics of the labeled blood bolus passing through capillaries while exchanging into tissue space before flowing into venules, and a LRL method was proposed for individual kw quantification.Background:
A diffusion prepared pseudo-continuous arterial spin labeling (DP-pCASL) method was proposed for quantification of water exchange rate (kw) across the blood-brain barrier (BBB)1-3. However, the non-CPMG de-phasing of the diffusion preparation module leads to half signal loss. In this study, we present an innovate pulse sequence and acquired signals from a wide range of PLDs with improved SNR and spatial resolution4. A 3-compartment single-pass approximation (SPA) model, which includes an additional venous compartment, was proposed to capture the full dynamics of the labeled blood bolus passing through capillaries while exchanging into tissue space before flowing into venules. A comprehensive set of parameters including cerebral blood flow (CBF), capillary transit time (τc) and kw were quantified and permeability surface product of water (PSw), total extraction fraction (Ew) and capillary volume (Vc) were derived simultaneously. With information (i.e., Vc and τc) obtained from 3-compartment SPA modeling, a simplified Linear-Regression of Logarithm (LRL) approach was proposed for individual kw quantification.Methods:
Separation of vascular/tissue compartments of ASL signals: Due to the large (pseudo)-diffusion coefficients difference (~100 fold) between ASL water in the tissue (0.0009 mm2/sec) and vascular compartments (0.09 mm2/sec), a small diffusion weighting will null the vascular compartment while has minimal impact on the tissue compartment (1-3).Pulse sequence (Fig. 1): We proposed an embedded first-order Motion Compensated Diffusion Weighting scheme (MCDW) with a BIR-4 (B1-insensitive rotation) non-selective refocusing pulse (Fig. 1B) for robust refocusing and motion compensation in the presence of B1+/B0 field inhomogeneities (5).
3-compartment SPA model: ASL signal can be expressed as the convolution between arterial input function (AIF) and residue functions of vascular (Rv) and tissue (Rt) compartments:
$$\frac{\Delta M}{M_0}=\frac{CBF}{\lambda}(R_v(t)+R_t(t))*AIF(t)\tag*{…[1]}$$
AIF for pCASL and residue functions for SPA (6) model can be expressed as:
$$AIF(t)=\begin{cases}0 & t \in [0,ATT),[ATT+\delta,\inf) \\ e^{-ATT \cdot R_{1a}} & t \in [ATT,ATT+\delta) \end{cases}\tag*{…[2]}$$
$$R_v(t)=\begin{cases}e^{-(k_w+R_{1a}) \cdot t} & t \in [0,\tau _c) \\e^{-k_w\cdot \tau _c}\cdot e^{-R_{1a}\cdot t} & t \in[\tau_c, \inf) \end{cases}\tag*{…[3]}$$
$$R_t(t)=\begin{cases}\frac{k_w}{k_w+R_{1a}-R_{1t}} \cdot (e^{-R_{1t} \cdot t} -e^{-(k_w+R_{1a}) \cdot t})& t \in [0,\tau _c) \\ \frac{k_w}{k_w+R_{1a}-R_{1t}} \cdot (1-e^{-\frac{PS_w}{CBF}-(R_{1a}-R_{1t}) \cdot \tau _c}\cdot e^{-R_{1t} \cdot t}) & t \in[\tau_c, \inf) \end{cases}\tag*{…[4]}$$
where λ is the partition coefficient of water in the brain (0.9 g/ml), δ is the labeling duration, R1a and R1t are the longitudinal relaxation rate of arterial blood and tissue. τc is the capillary transit time. Vc and PSw can be derived:
$$V_c=CBF \cdot \tau _c\tag*{…[5]}$$
$$PS_w=k_w \cdot V_c\tag*{…[6]}$$
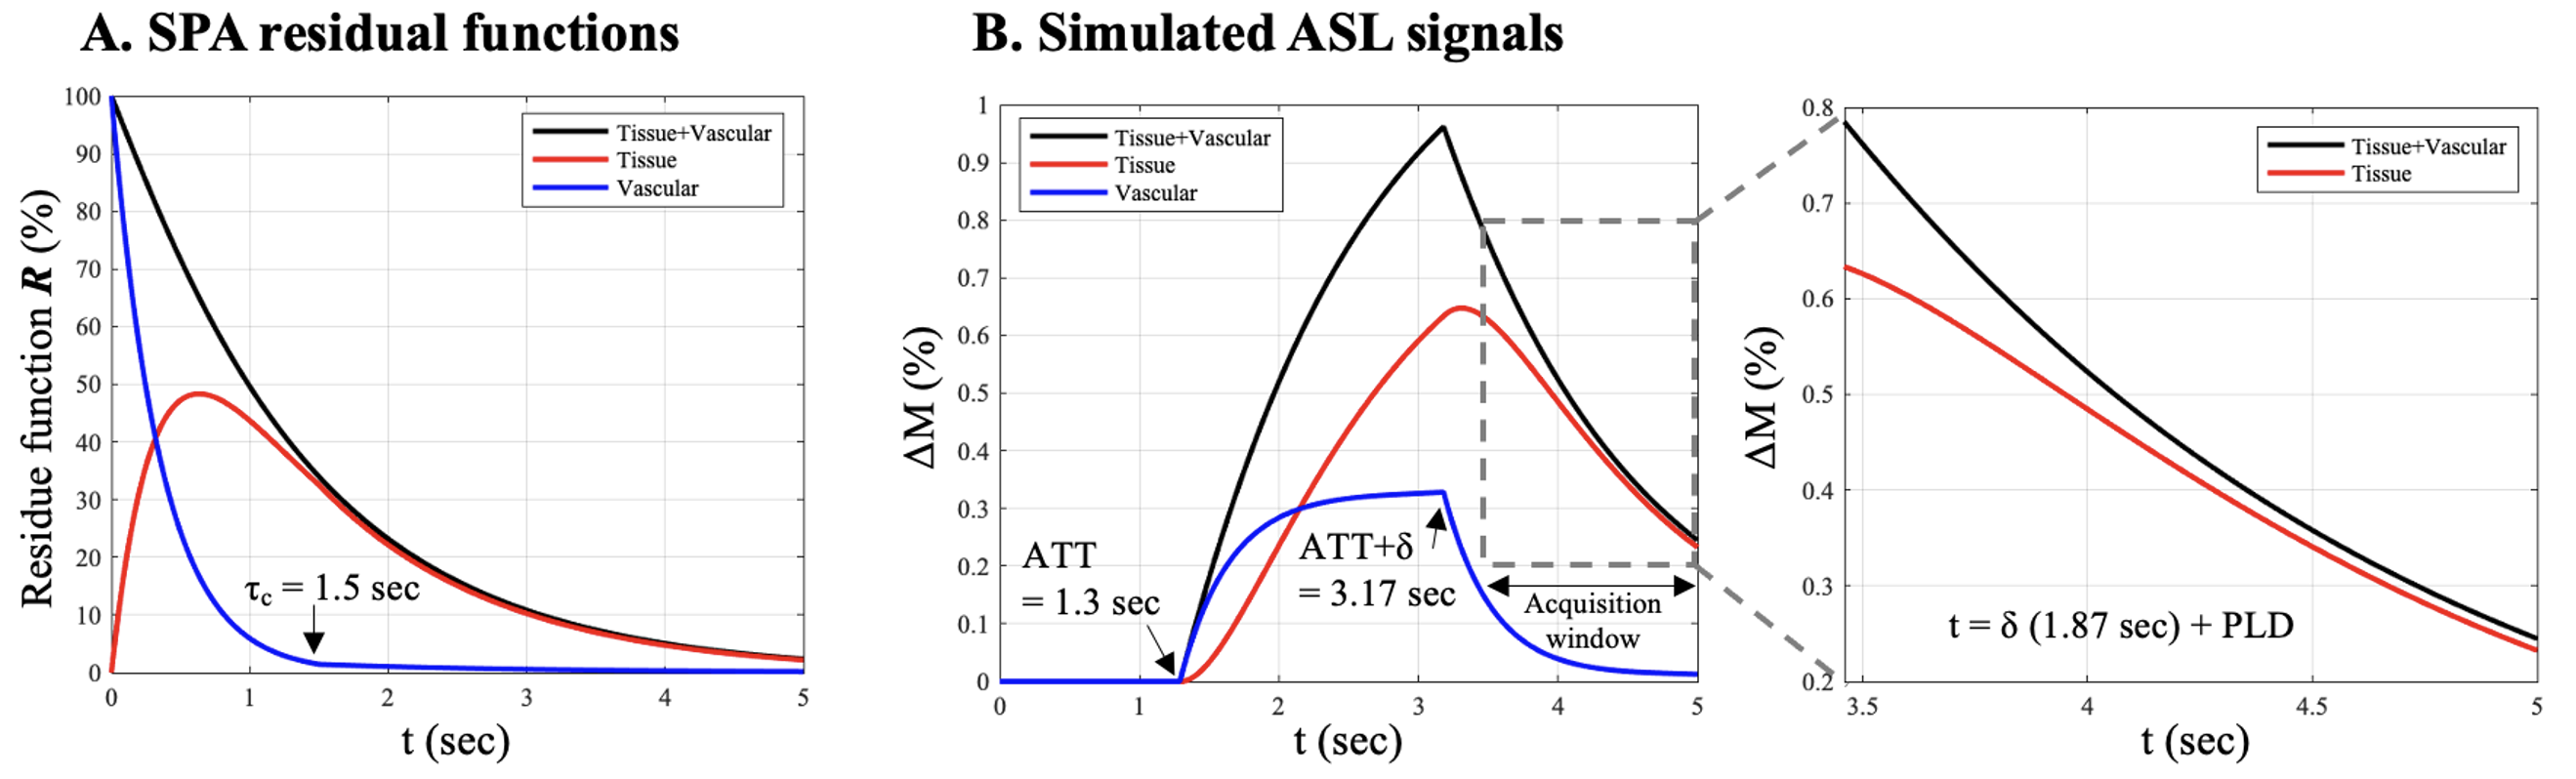
Eq. [3,4] demonstrate the ASL labeled water starts exchanging into tissue compartment when bolus arrives (t=0), and then reaches the non-exchanging venous compartment at t=τc. Fig. 2 shows simulated residue functions (A) and ASL signals (B). Vascular contribution (blue) decreases rapidly when t=[0, τc] due to fast exchange across the BBB, then decays with R1a in the non-exchange venous compartment.
LRL method for individual kw quantification: When venous contribution is small for moderate PLDs (<2.5s according to 3-compartment SPA modeling results), 2-compartment SPA model can be a good approximation (4,6,7):
$$\Delta M_c(t)=-\frac{2\epsilon \cdot CBF \cdot M_0 }{\lambda \cdot(k_w+R_{1a})}\cdot e^{k_w \cdot ATT} \cdot (e^{-(k_w+R_{1a} )(t-\delta)} - e^{-(k_w+R_{1a}) t})\tag*{…[7]}$$
We proposed a LRL method to estimate kw from ΔMc acquired at multi-PLDs. Eq. [7] can be simplified by taking logarithm of both sides:
$$\log(\Delta M_c(t))=\log(-\frac{2\epsilon \cdot CBF \cdot M_0}{\lambda \cdot(k_w+R_{1a})}\cdot e^{k_w \cdot ATT} \cdot (e^{(k_w+R_{1a})\delta} -1) \cdot e^{-(k_w+R_{1a})t})=A+S \cdot t\tag*{…[8]}$$
$$A=\log(-\frac{2\epsilon \cdot CBF \cdot M_0}{\lambda \cdot(k_w+R_{1a})}\cdot e^{k_w \cdot ATT} \cdot (e^{(k_w+R_{1a})\delta} -1))\tag*{…[9]}$$
$$S=-(k_w+R_{1a}) \space or \space k_w=-S-R_{1a}\tag*{…[10]}$$
where A and S are the intercept and slope of the linear function log(ΔMc(t)). Eq. [10] demonstrates that the rate of the exponential decay of ΔMc(t) equals to kw + R1a. A kw map can be generated by voxel-wise linear regression of multi-PLD log(ΔMc) signals.
MRI experiments/data analysis: Imaging parameters were: FOV=224mm2, 36 slices (20% oversampling), 3.5mm3 isotropic resolution, 3-fold acceleration along partition direction with spatiotemporal TGV regularized reconstruction (8), TE = 47.7 msec, label duration=1870 msec. Eighteen label/control pairs were acquired with b=0 or 40.4 sec/mm2 at five PLDs: [1590,1890,2190,2490,2790] msec. Total scan time was 35 mins. 11 subjects (8M/3F, age = 26±3 years) underwent MRI scans on a Siemens 3T Prisma system using a 32‐channel head coil.
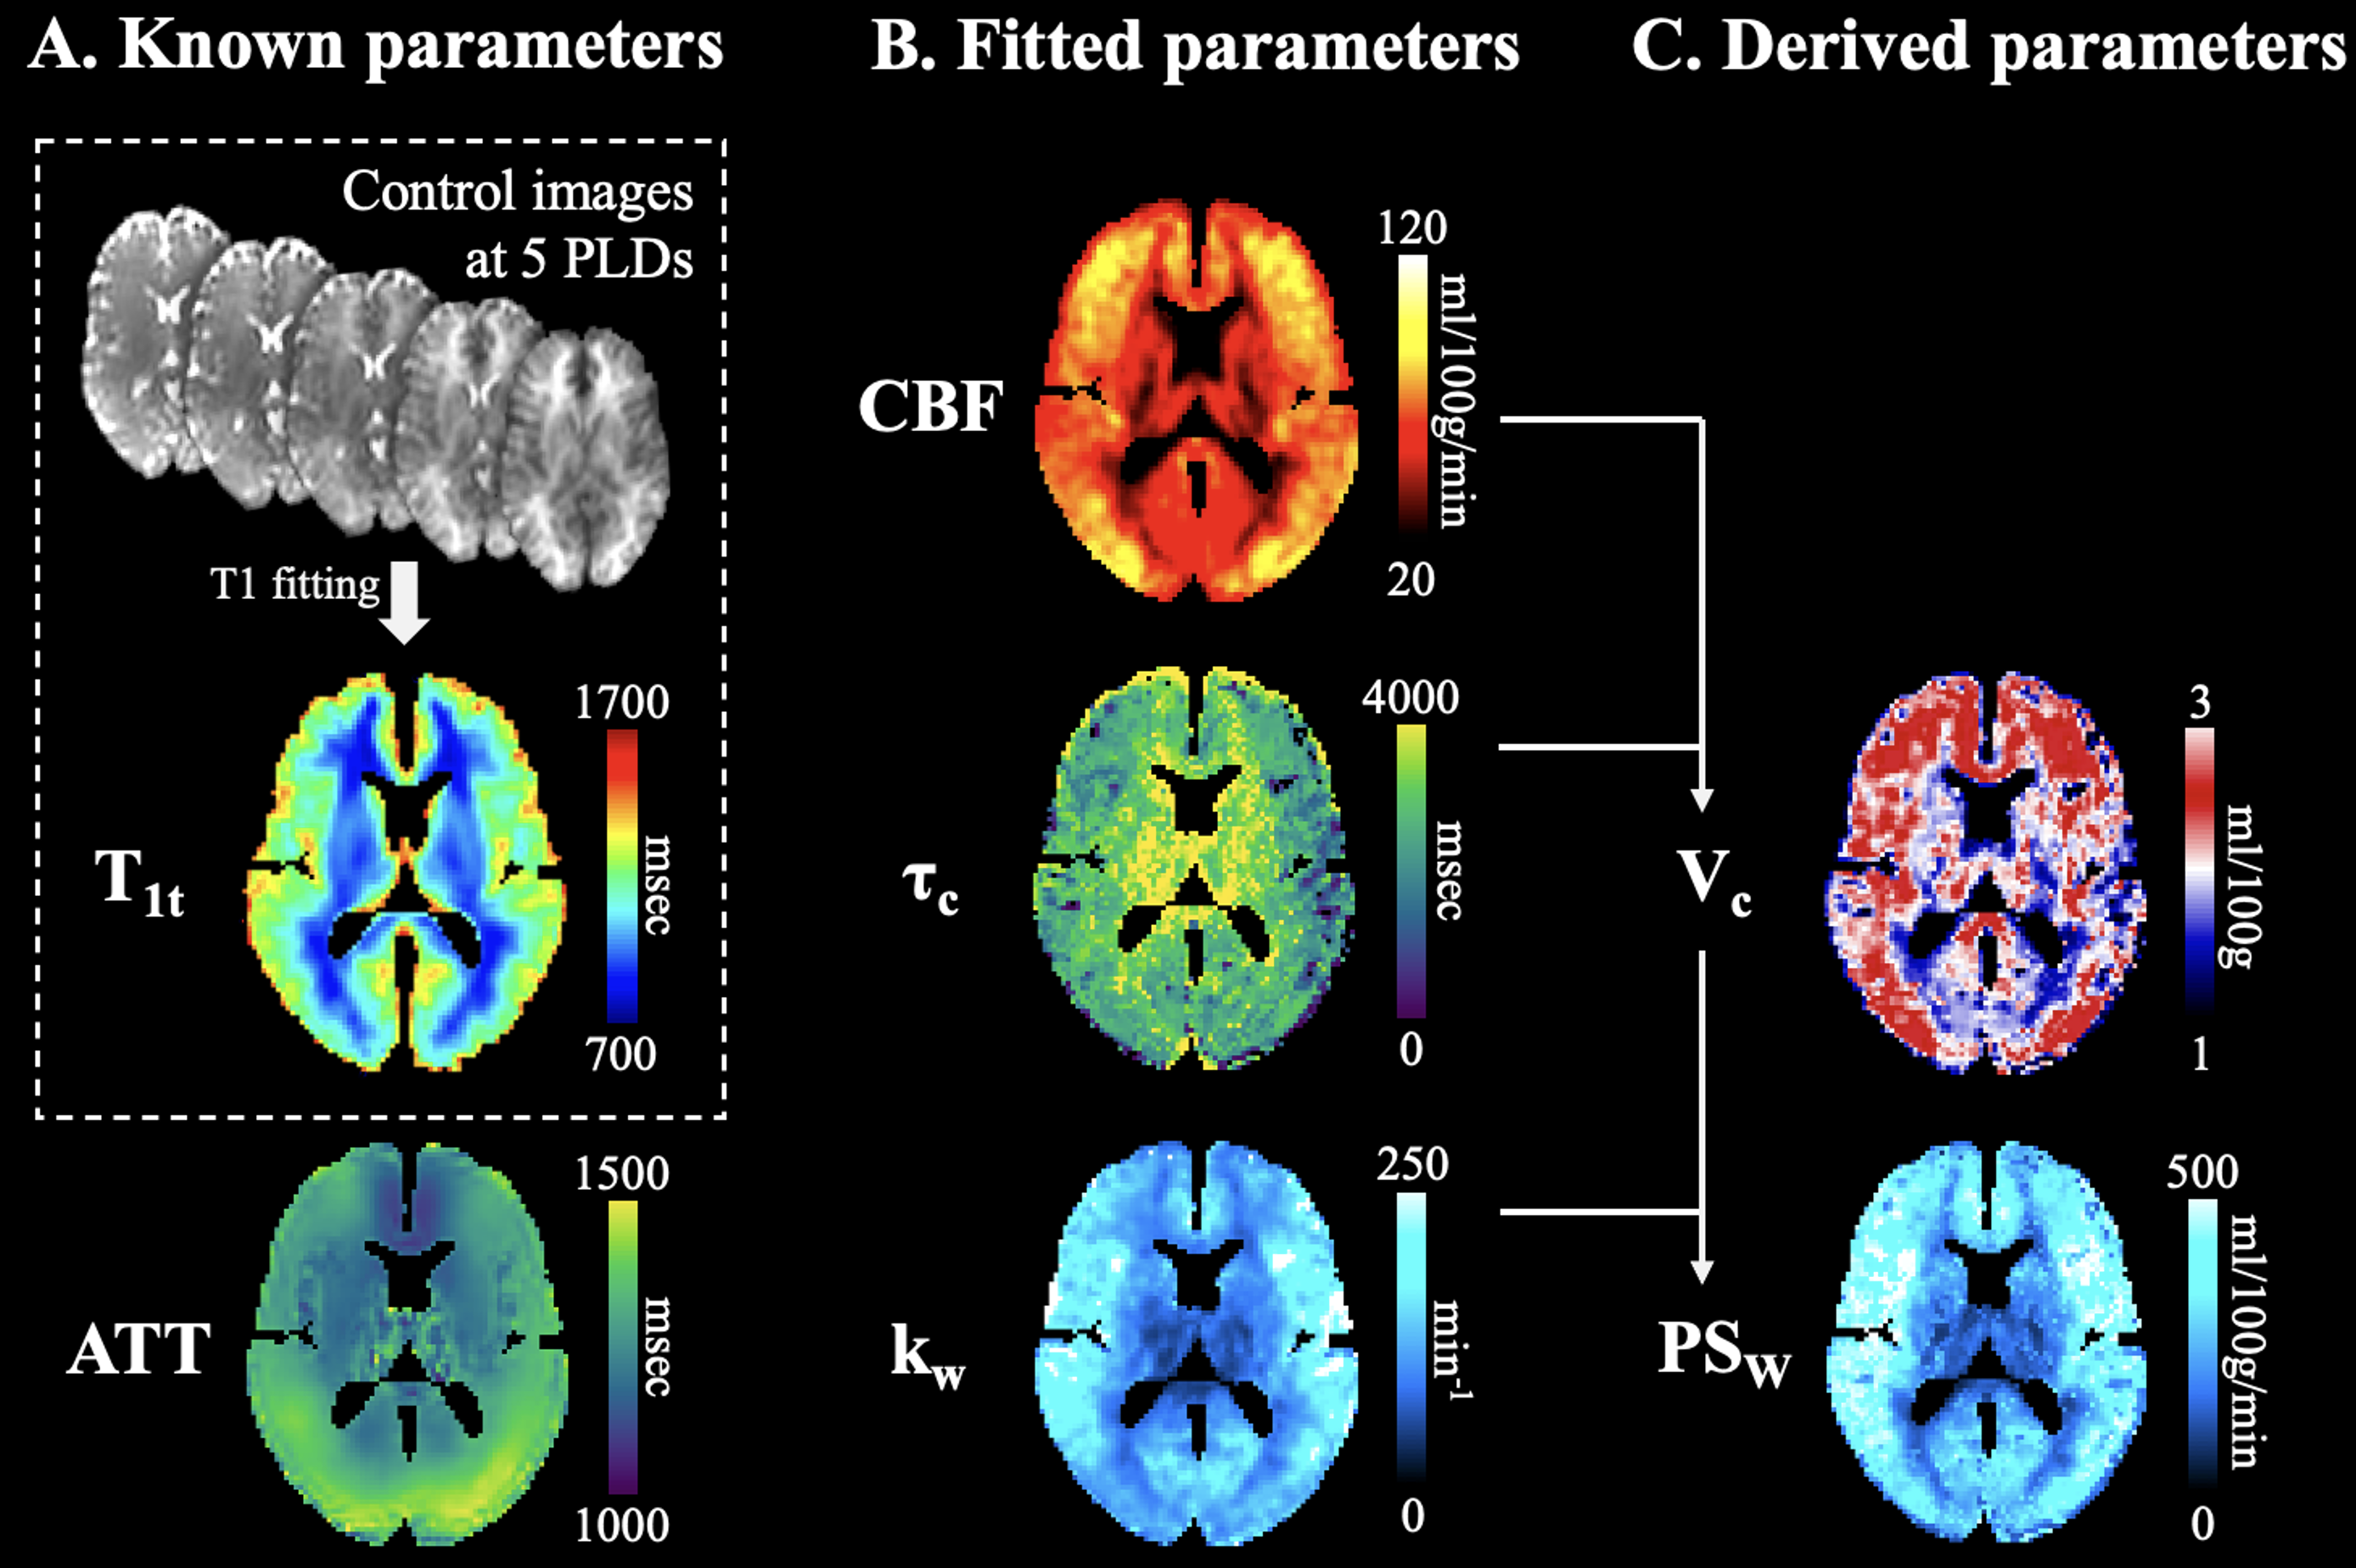
Perfusion images of each subject were normalized into the MNI space. CBF, kw and τc were simultaneously estimated by 3-compartment SPA modeling on the group-averaged signals using least-square non-linear curve fitting in MATLAB (lsqcurvefit). PSw and Vc were derived by Eqs. [5,6].
Results & Discussion:
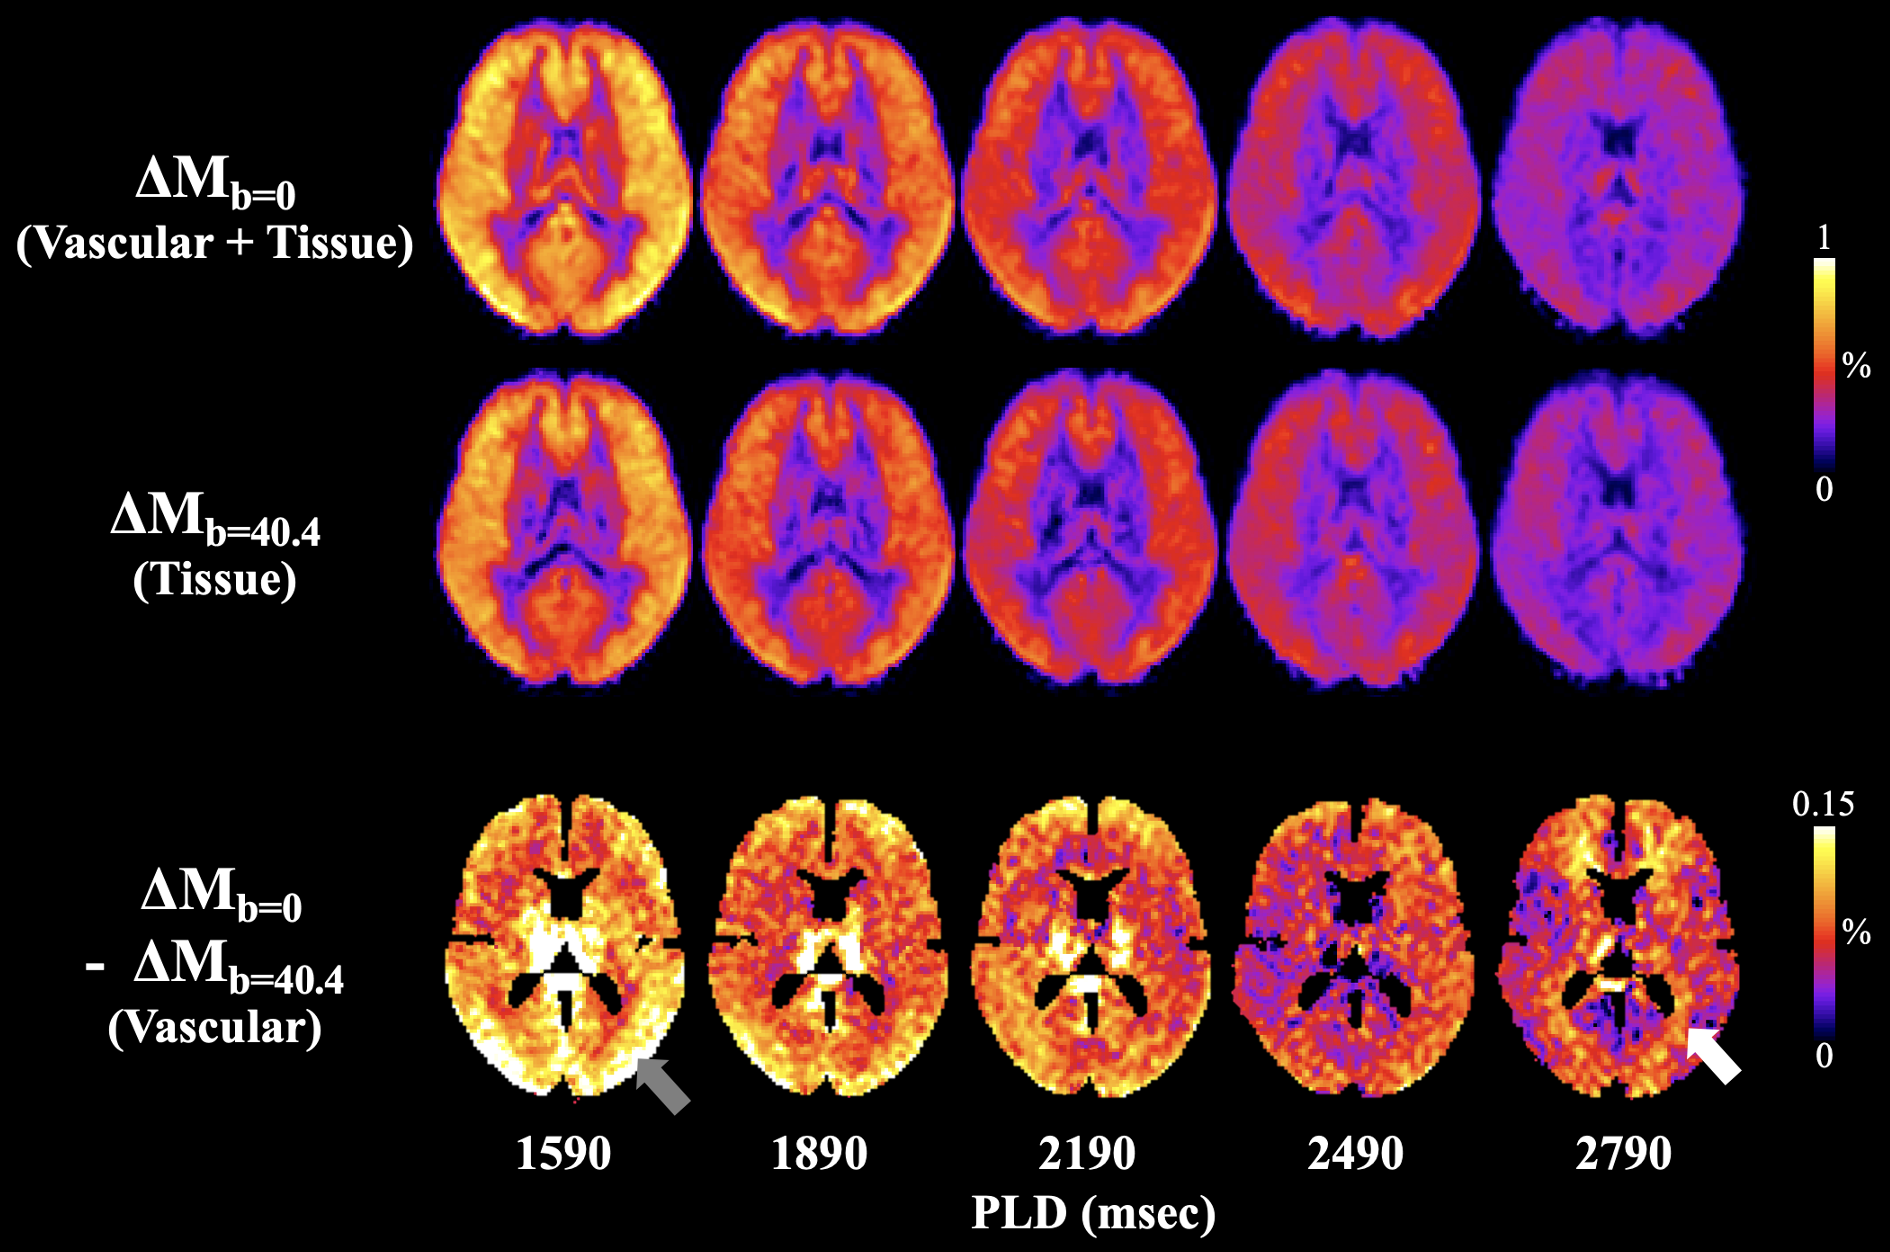
Fig. 3 (left) shows one representative slice of group-averaged perfusion images acquired at five PLDs. ΔMb=0 has overall higher intensity, and the difference (vascular compartment) is shown in the third row. Signal intensity in the vascular compartment decreased at longer PLD. Vascular contribution was relatively higher in GM at short PLD (1590msec) and became relatively higher in WM at long PLD (2790msec).Fig. 4 shows group-averaged 3-compartment SPA modeling results. CBF, τc, kw, Vc and PSw maps were simultaneously obtained from voxel-wise 3-compartment SPA modeling. Average CBF = 51.5/36.8 ml/100g/min, kw = 126.3/106.7 min-1, PSw = 151.6/93.8 ml/100g/min, τc = 1409.2/1431.8 msec and Vc = 1.2/0.9 ml/100g in grey and white matter, respectively.
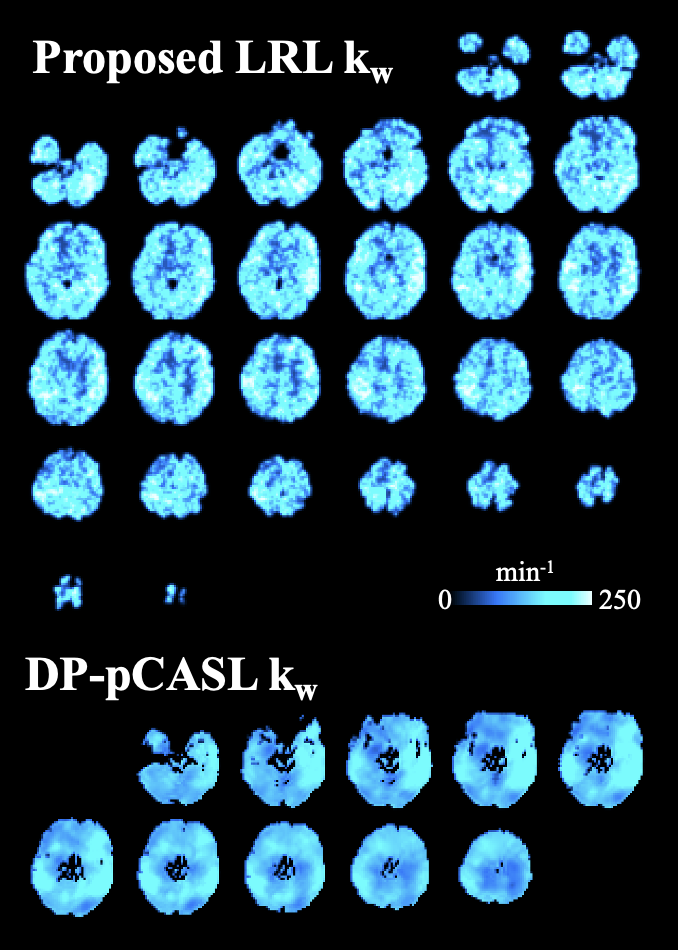
Fig. 5 shows kw maps obtained from the proposed LRL method (top) and DP-pCASL (bottom) techniques from one representative subject (F, 25 years). 12 slices with moderate thickness (8 mm) were acquired in DP-pCASL scans (3). 36 thinner slices (3.5 mm) were acquired by the proposed MCDW-pCASL. Additionally, the proposed LRL approach, which does not require spatial regularized reconstruction, improved spatial resolution of kw map.
Conclusion:
MCDW-pCASL allows visualization of intra-/extra-vascular ASL signals across multiple PLDs. Three-compartment SPA model provides a comprehensive measurement of BBB water dynamics from group-averaged data, and a simplified LRL method was proposed for individual kw quantificationAcknowledgements
This work was supported by National Institute of Health (NIH) grant UF1-NS100614, R01-NS114382 and R01-EB028297References
- Wang J, Fernández-Seara MA, Wang S, Lawrence KSS. When perfusion meets diffusion: in vivo measurement of water permeability in human brain. Journal of Cerebral Blood Flow & Metabolism 2007;27(4):839-849.
- St Lawrence KS, Owen D, Wang DJ. A two-stage approach for measuring vascular water exchange and arterial transit time by diffusion-weighted perfusion MRI. Magn Reson Med 2012;67(5):1275-1284.
- Shao X, Ma SJ, Casey M, D'Orazio L, Ringman JM, Wang DJJ. Mapping water exchange across the blood-brain barrier using 3D diffusion-prepared arterial spin labeled perfusion MRI. Magn Reson Med 2019;81(5):3065-3079.
- Shao X, Zhao C, Shou Q, St Lawrence KS, Wang DJ. Quantification of blood–brain barrier water exchange and permeability with multidelay diffusion‐weighted pseudo‐continuous arterial spin labeling. Magnetic Resonance in Medicine 2023.
- De Graaf RA, Nicolay K. Adiabatic rf pulses: Applications to in vivo NMR. Concepts in Magnetic Resonance: An Educational Journal 1997;9(4):247-268.
- St. Lawrence K, Frank J, McLaughlin A. Effect of restricted water exchange on cerebral blood flow values calculated with arterial spin tagging: a theoretical investigation. Magnetic Resonance in Medicine: An Official Journal of the International Society for Magnetic Resonance in Medicine 2000;44(3):440-449.
- Parkes LM, Tofts PS. Improved accuracy of human cerebral blood perfusion measurements using arterial spin labeling: accounting for capillary water permeability. Magnetic Resonance in Medicine: An Official Journal of the International Society for Magnetic Resonance in Medicine 2002;48(1):27-41.
- Spann SM, Shao X, Wang DJ, Aigner CS, Schloegl M, Bredies K, Stollberger R. Robust single-shot acquisition of high resolution whole brain ASL images by combining time-dependent 2D CAPIRINHA sampling with spatio-temporal TGV reconstruction. NeuroImage 2020;206:116337.
Figures
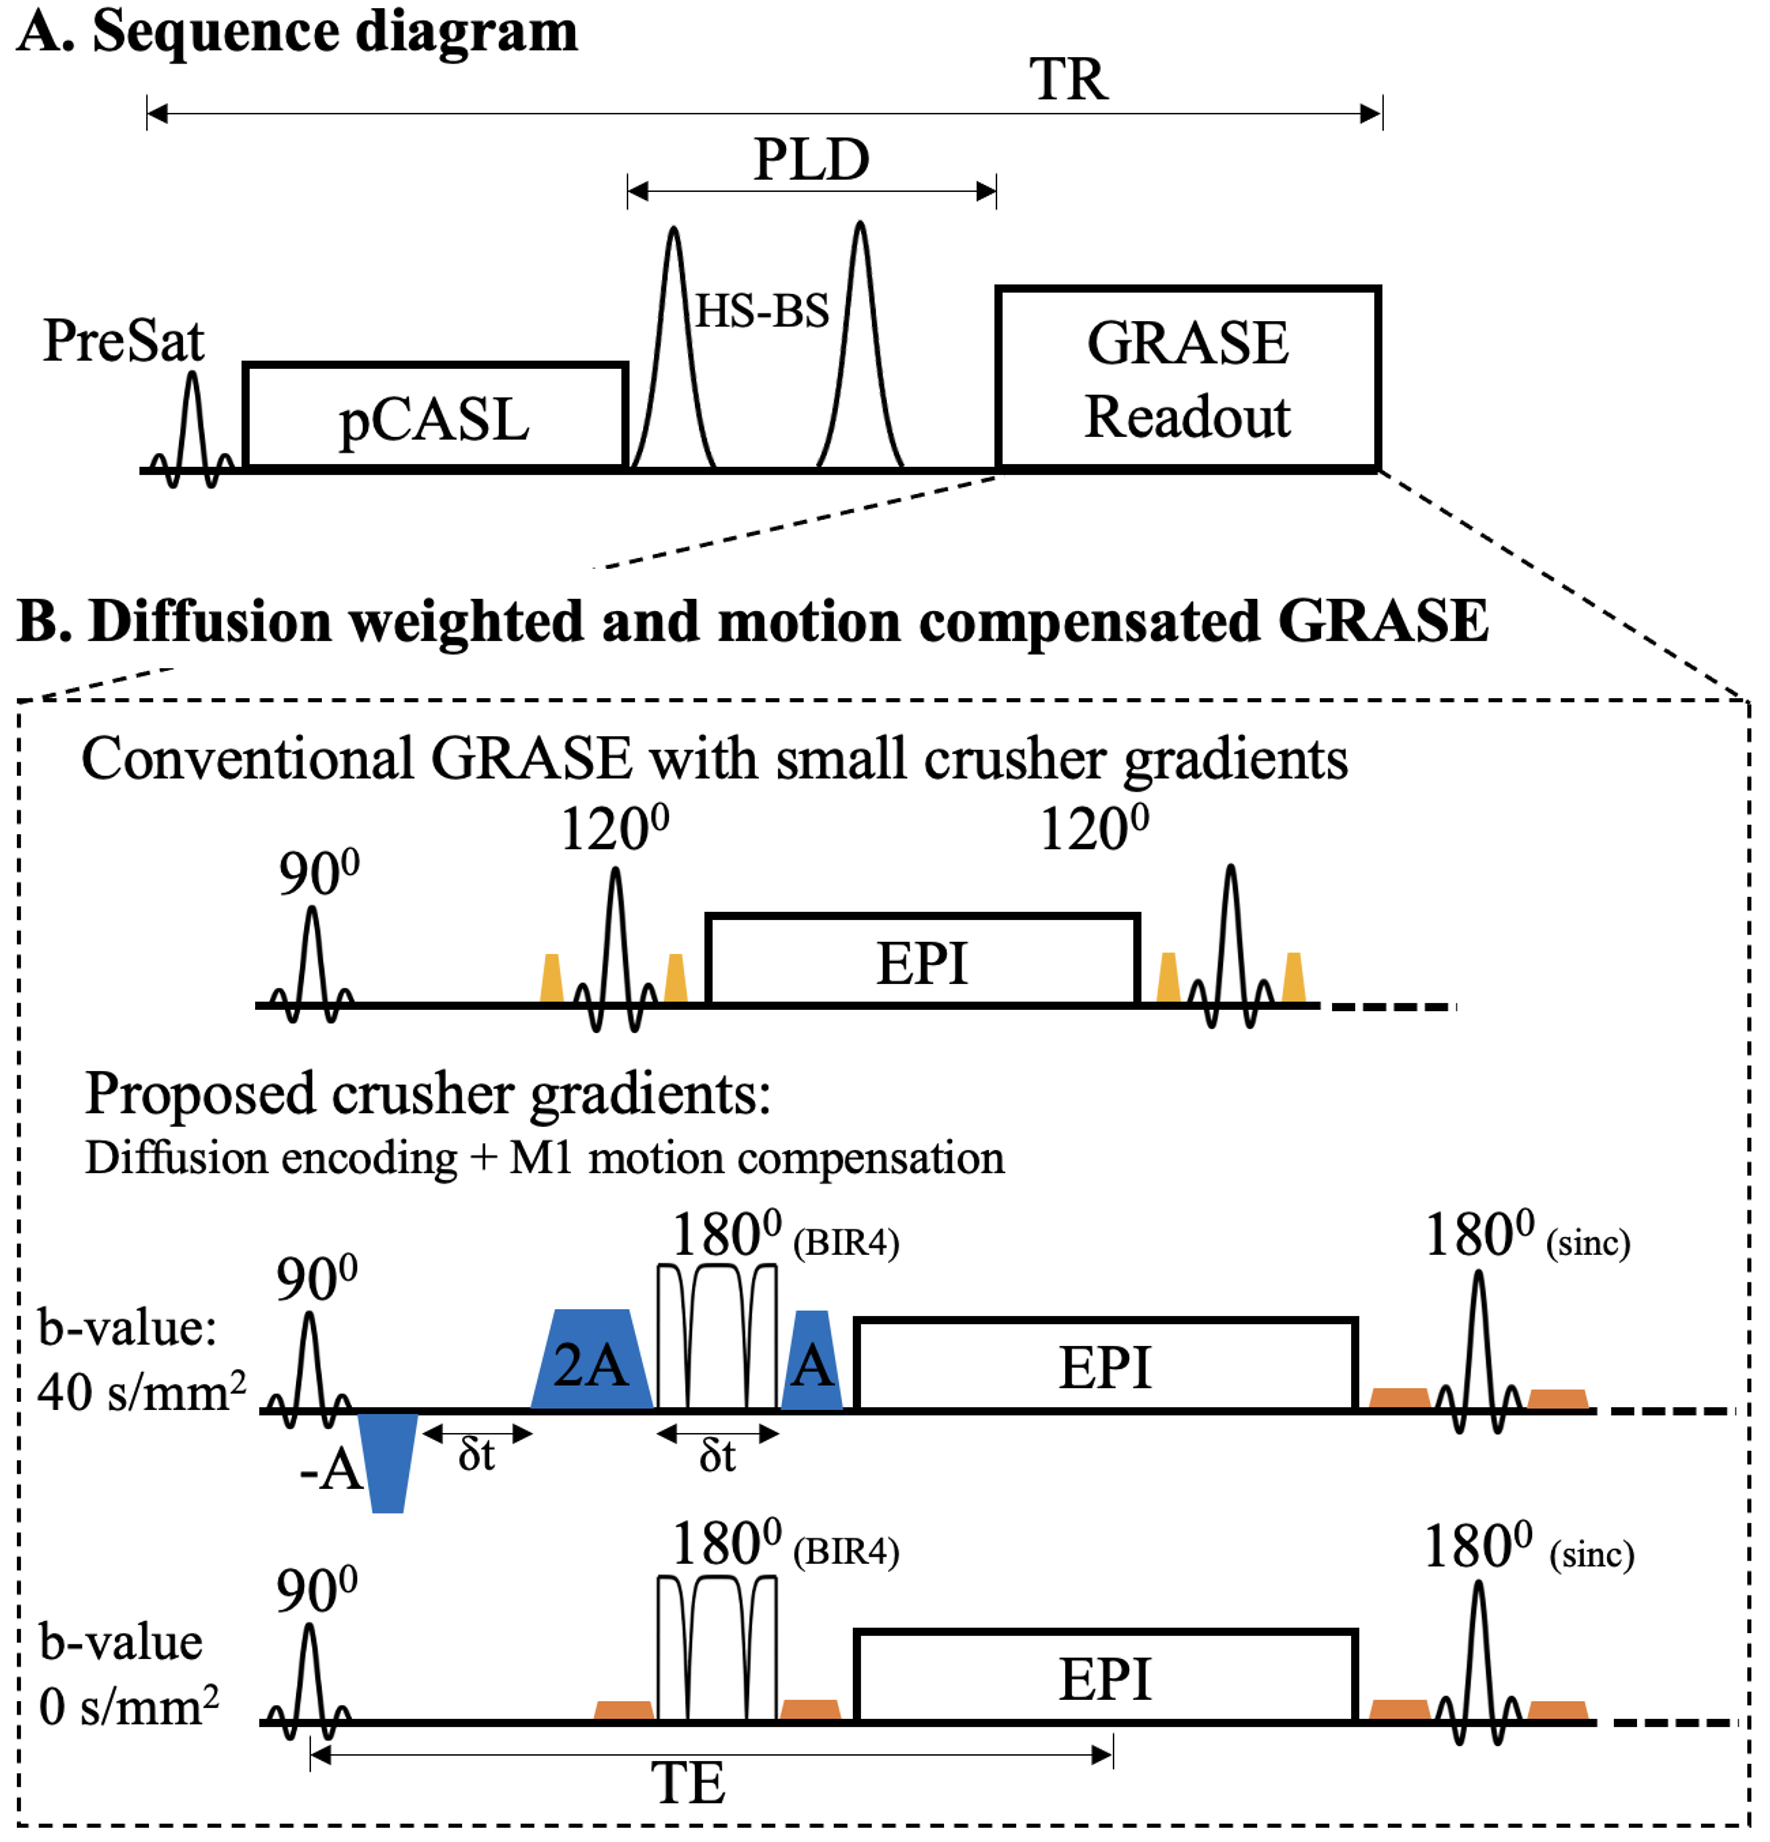
Figure
1. A. Sequence diagram. B. Implementation of M1 compensated and diffusion
weighted (MCDW) GRASE. The original slice crusher pairs (yellow) of the 1st
refocusing pulse were replaced by three-lobe M1-motion compensated gradients
(blue) with maximal amplitude and prolonged duration to achieve sufficient
diffusion weighting (b-value = 40.4 sec/mm2). Gradient amplitude was reduced for the
remaining crusher pairs (orange). 1st 180° sinc pulses of GRASE was replaced by
BIR4 non-selective refocusing pulse to improve the robustness to B1+/B0
inhomogeneities.
Figure
2. A. Simulated residue functions of the SPA model. Vascular contribution
decays fast before τc due to rapid exchange into tissue
compartment. B. ASL signals were calculated by Eq. [2]. An inset (dashed box)
shows the tissue and combined ASL signals within the acquisition window
(PLD~1.5-3s). Black, red, and blue traces indicate combined, tissue and
vascular compartment, respectively. Parameters used for this simulation are: R1a =
0.6 sec-1, R1t = 0.77 sec-1, ATT = 1.3 sec, δ
= 1.87 sec, CBF = 60 ml/100g/min, kw = 133.3 min-1, Vc =
1.5 ml/100g, τc = 1.5 sec and PSw = 200
ml/100g/min.
Figure
3. Group-averaged 5-PLD perfusion images (columns) in MNI space. The first and
second row show perfusion maps without and with diffusion weighting. Perfusion
signal intensities decreased at longer PLDs. The difference image is shown in
the third row. Vascular contribution was relatively higher in gray matter at
PLD = 1590ms (gray arrow) and became relatively higher in WM at PLD = 2790ms
(white arrow). Right side shows plots of perfusion signals and fitting results
in GM/WM.
Figure
4. Results of 3-compartment SPA modeling. A. Parameters obtained prior to model
fitting. T1 values were estimated from background suppressed control images
acquired at 5 PLDs. ATT map was obtained from a separate DP-pCASL scan and
normalized to MNI space. B. CBF, τc and kw maps were simultaneously computed by
3-compartment SPA fitting of the 5-PLD ΔMb=0 and ΔMb>0 signals. C. Two derived parameters Vc and PSw calculated according
to Eqs. [5,6].
Figure
5. kw maps obtained from the MCDW-pCASL LRL (top) and DP-pCASL (bottom)
techniques from one representative subject (Female, 25 years). 36 and 12 slices
were acquired by the proposed and DP-pCASL, respectively. A few (top/bottom)
slices were discarded due to motion correction and co-registration.
DOI: https://doi.org/10.58530/2023/0008