0006
Predicting the Onset of Ischemic Stroke with Fast High-Resolution 3D MR Spectroscopic Imaging
Zengping Lin1, Ziyu Meng1, Tianyao Wang2, Rong Guo3,4, Yibo Zhao3,5, Yudu Li3,5, Bin Bo1, Yue Guan1, Jun Liu2, Hong Zhou6, Xin Yu7, David J Lin8, Zhi-Pei Liang3,5, Parashkev Nachev9, and Yao Li1
1School of Biomedical Engineering, Shanghai Jiao Tong University, Shanghai, China, 2Radiology Department, Shanghai Fifth People's Hospital, Fudan University, Shanghai, China, 3Beckman Institute for Advanced Science & Technology, University of Illinois at Urbana-Champaign, Urbana, IL, United States, 4Siemens Medical Solutions USA, Inc, Urbana, IL, United States, 5Department of Electrical & Computer Engineering, University of Illinois at Urbana-Champaign, Urbana, IL, United States, 6Department of Radiology, The First Affiliated Hospital of South China of University, South China of University, Hengyang, China, 7Department of Biomedical Engineering, Case Western Reserve University, Cleveland, OH, United States, 8Center for Neurotechnology and Neurorecovery, Department of Neurology, Massachusetts General Hospital, Harvard Medical School, Boston, MA, United States, 9Institute of Neurology, University College London, London, United Kingdom
1School of Biomedical Engineering, Shanghai Jiao Tong University, Shanghai, China, 2Radiology Department, Shanghai Fifth People's Hospital, Fudan University, Shanghai, China, 3Beckman Institute for Advanced Science & Technology, University of Illinois at Urbana-Champaign, Urbana, IL, United States, 4Siemens Medical Solutions USA, Inc, Urbana, IL, United States, 5Department of Electrical & Computer Engineering, University of Illinois at Urbana-Champaign, Urbana, IL, United States, 6Department of Radiology, The First Affiliated Hospital of South China of University, South China of University, Hengyang, China, 7Department of Biomedical Engineering, Case Western Reserve University, Cleveland, OH, United States, 8Center for Neurotechnology and Neurorecovery, Department of Neurology, Massachusetts General Hospital, Harvard Medical School, Boston, MA, United States, 9Institute of Neurology, University College London, London, United Kingdom
Synopsis
Keywords: YIA, Ischemia
Neurometabolite concentrations provide a direct index of infarct progression in stroke, but their relationship with stroke onset time remains unclear. Using a fast high-resolution 3D MRSI technique, this study assessed the temporal dynamics of N-acetylaspartate (NAA), creatine, choline, and lactate and estimated their value in predicting early (<6 hours) vs late (6–24 hours) hyperacute ischemic stroke groups. We found that lesional NAA and creatine was reduced from acute to subacute stroke patients and NAA level was inversely related to onset time in hyperacute patients. The changes in neurometabolite levels provided good discrimination between patients for early & late hyperacute time windows.Introduction:
Developing novel neuroimaging techniques to directly define the biological characteristics of infarcts and to establish the duration and extent of tissue damage is of great importance in stroke management1,2. Neurometabolite concentrations provide a direct index of infarct progression in stroke3–5. MRSI is a potentially powerful tool for noninvasive measurement of neurometabolites changes in stroke6–8. However, partial volume effects arising from the poor spatial resolution of previous studies (over 10 mm for single slice chemical shift imaging) have thus far limited the sensitivity of MRSI, and long acquisition time (over 15 min for a single slice) has obstructed its clinical translation9–11. Furthermore, the temporal relationships between the time of onset and neurometabolite concentrations in the acute stroke remain to be established in a clinical context. A fast, high-resolution 3D MRSI technique named SPICE (SPectroscopic Imaging by exploiting spatiospectral CorrElation)12–16 was shown to enable near whole-brain neurometabolite mapping at 2.0 × 3.0 × 3.0 mm3 nominal resolution in acute stroke patients8. In this study, we investigated the temporal changes of neurometabolite levels within ischemic lesions, i.e., NAA, creatine, choline, and lactate, in both acute (0 – 1 week) and subacute (1 – 2 weeks) stroke patients. Moreover, we assessed the extent to which the combination of all neurometabolite signals measured by 3D MRSI could discriminate between early (< 6 hours) and late hyperacute (6 – 24 hours) stroke patients17.Methods:
We included seventy-three patients (23 females, 65 ± 14 years) with ischemic stroke of known onset within 2 weeks of presentation. All patients underwent at least one MRI scan and the median onset time to the first scan was 30.1 (interquartile range, 12.8 – 66.6) hours. Twenty-five patients underwent a follow-up MRI scan at 29.8 to 322.5 hours after onset. Imaging was performed on a 3T Siemens Skyra MR. The acquisition protocol included MRSI (TR/TE = 160/1.6 ms, resolution = 2.0 × 3.0 × 3.0 mm3, FOV = 240 × 240 × 72 mm3, scan time = 8 min), MPRAGE imaging (TR/TE/TI = 2400/2.13/1100 ms, resolution = 1.0 × 1.0 × 1.0 mm3, FOV = 256 mm, 192 slices), DWI (TR/TE = 5200/64 ms, resolution = 1.3 × 1.3 × 4.0 mm3, FOV = 240 mm, 25 slices, b = 0 and b = 1000 s/mm2), and FLAIR imaging (TR/TE = 9000/89 ms, resolution = 0.5 × 0.5 × 2.0 mm3, FOV = 240 mm, 82 slices). The ischemic lesions were manually delineated on DWI for images acquired within one week after symptom onset, and on FLAIR for images acquired more than one week after symptom onset. The corresponding lesion masks were registered to the MRSI images using affine linear transformation.Patients were divided into hyperacute (0–24 hours, N = 32), acute (24 hours–1 week, N = 47), and subacute (1–2 weeks, N = 19) groups. The hyperacute group was further divided into early (<6 hours, N = 11) and late (6–24 hours, N = 21) hyperacute groups17,18. The neurometabolites were calculated relative to the sum of contralateral NAA, creatine, and choline signals. Linear mixed effects modeling was used for group-wise comparisons between NAA, creatine, choline, and lactate19. Pearson’s correlation analysis was used to evaluate the relationship between neurometabolites and time. Bayesian logistic regression was used to compare classification performance between early and late hyperacute groups. P < 0.05 was considered statistically significant. The study was approved by the local Institutional Review Board. Written informed consent was obtained from all participants.
Results:
Figure 1 shows the tri-planar NAA images and the representative spectra of a patient scanned at 13.0 hours and 219.0 hours post stroke onset. The spectra acquired at the later time point showed reduced NAA levels. Representative multimodal images from six patients are shown in Figure 2. Reduced NAA signal intensity and enhanced lactate signal intensity within the lesion compared to the contralateral side can be observed, as well as an inverse relationship between the NAA signal and onset time. Lesional NAA and creatine were significantly lower in subacute than in acute stroke patients (Figure 3). The main effects of time were shown on NAA (F = 14.321) and creatine (F = 12.261). NAA was significantly lower in late than early hyperacute stroke patients, and was inversely correlated to time from symptom onset across both groups (r = - 0.440) (Figure 4). The decrease of NAA and increase of lactate were correlated with lesion volume (NAA: r = - 0.472; lactate: r = 0.366) in hyperacute stroke. Discrimination was improved by combining NAA, creatine, and choline signals (area under the curve (AUC) = 0.90).Conclusion:
Using fast high-resolution 3D MRSI, we assessed neurometabolite changes over time in ischemic stroke patients. The changes of neurometabolites measured by 3D MRSI provided good discrimination between ischemic stroke patients for early and late hyperacute (i.e., before and after 6 hours) time windows.Acknowledgements
No acknowledgement found.References
- Albers GW, Marks MP, Kemp S, et al. Thrombectomy for stroke at 6 to 16 hours with selection by perfusion imaging. N Engl J Med. 2018;378(8):708-718.
- Nogueira RG, Jadhav AP, Haussen DC, et al. Thrombectomy 6 to 24 hours after stroke with a mismatch between deficit and infarct. N Engl J Med. 2018;378(1):11-21.
- Prass K, Royl G, Lindauer U, et al. Improved reperfusion and neuroprotection by creatine in a mouse model of stroke. J Cereb Blood Flow Metab. 2007;27(3):452-459.
- Brouns R, De Deyn PP. The complexity of neurobiological processes in acute ischemic stroke. Clin Neurol Neurosurg. 2009;111(6):483-495.
- Gillard JH, Barker PB, van Zijl PC, et al. Proton MR spectroscopy in acute middle cerebral artery stroke. Am J Neuroradiol. 1996;17(5):873.
- Barker PB, Gillard JH, van Zijl PC, et al. Acute stroke: evaluation with serial proton MR spectroscopic imaging. Radiology. 1994;192(3):723-732.
- Muñoz MS, Cvoro V, Chappell FM, et al. Changes in NAA and lactate following ischemic stroke: a serial MR spectroscopic imaging study. Neurology. 2008;71(24):1993-1999.
- Li Y, Wang T, Zhang T, et al. Fast high-resolution metabolic imaging of acute stroke with 3D magnetic resonance spectroscopy. Brain. 2020;143(11):3225-3233.
- Wild JM, Wardlaw JM, Marshall I, et al. N-acetylaspartate distribution in proton spectroscopic images of ischemic stroke: relationship to infarct appearance on T2-weighted magnetic resonance imaging. Stroke. 2000;31(12):3008-3014.
- Nicoli F, Lefur Y, Denis B, et al. Metabolic counterpart of decreased apparent diffusion coefficient during hyperacute ischemic stroke: a brain proton magnetic resonance spectroscopic imaging study. Stroke. 2003;34(7):e82-87.
- Cvoro V, Wardlaw JM, Marshall I, et al. Associations between diffusion and perfusion parameters, N-acetyl aspartate, and lactate in acute ischemic stroke. Stroke. 2009;40(3):767-772.
- Liang ZP. Spatiotemporal imaging with partially separable functions. In: 2007 Joint Meeting of the 6th International Symposium on Noninvasive Functional Source Imaging of the Brain and Heart and the International Conference on Functional Biomedical Imaging. 2007:181-182.
- Lam F, Liang ZP. A subspace approach to high-resolution spectroscopic imaging. Magn Reson Med. 2014;71(4):1349-1357.
- Lam F, Ma C, Clifford B, et al. High-resolution 1H-MRSI of the brain using SPICE: Data acquisition and image reconstruction. Magn Reson Med. 2016;76(4):1059-1070.
- Ma C, Lam F, Johnson CL, et al. Removal of nuisance signals from limited and sparse 1H MRSI data using a union-of-subspaces model. Magn Reson Med. 2016;75(2):488-497.
- Li Y, Lam F, Clifford B, et al. A Subspace approach to spectral quantification for MR spectroscopic imaging. IEEE Trans Biomed Eng. 2017;64(10):2486-2489.
- Allen LM, Hasso AN, Handwerker J, et al. Sequence-specific MR imaging findings that are useful in dating ischemic stroke. Radiogr Rev Publ Radiol Soc N Am Inc. 2012;32(5):1285-1297; discussion 1297-1299.
- Bernhardt J, Hayward KS, Kwakkel G, et al. Agreed definitions and a shared vision for new standards in stroke recovery research: The Stroke Recovery and Rehabilitation Roundtable taskforce. Int J Stroke Off J Int Stroke Soc. 2017;12(5):444-450.
- Chen G, Saad ZS, Britton JC, et al. Linear mixed-effects modeling approach to fMRI group analysis. NeuroImage. 2013;73:176-190.
Figures
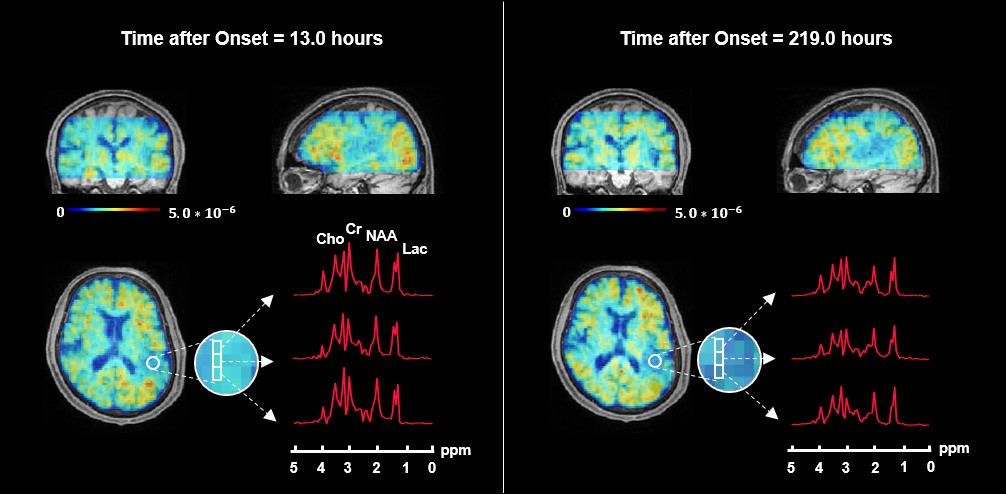
Figure 1. 3D N-acetylaspartate (NAA) maps and representative spectra from the ischemic lesion of a stroke patient scanned repeatedly at 13.0 hours and 219.0 hours after symptom onset, respectively. The NAA maps in triplanar views are registered to and overlaid on T1-weighted images.
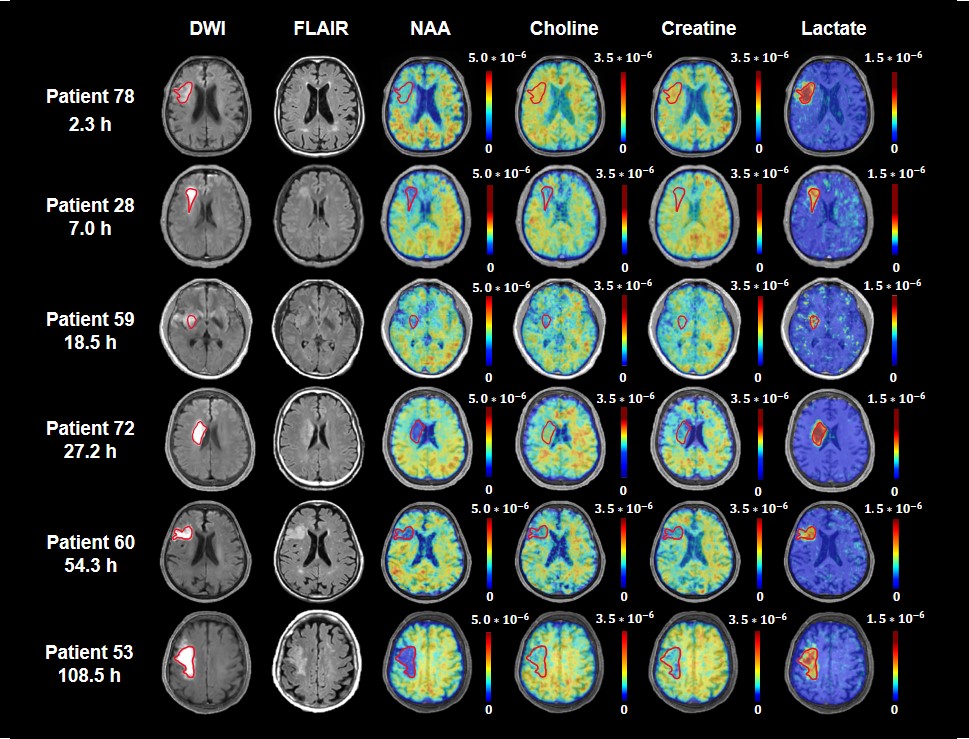
Figure 2. Multimodal images from representative patients at 2.3 to 108.5 hours after ischemic stroke. The ischemic lesions were depicted in red on DWI images. All images (DWI, FLAIR, NAA, Choline, Creatine and Lactate) were registered to the structural T1-weighted images. The color bar for MRSI shows neurometabolite level in institutional units, for which the MRSI metabolite measurements were normalized over the companion unsuppressed water signals.
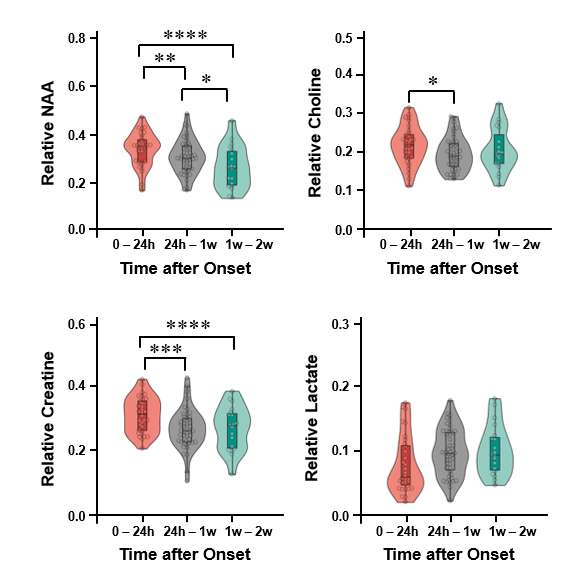
Figure 3. Comparisons of the neurometabolites within ischemic lesion of acute and subacute ischemic stroke patients at 0 – 24 hours, 24 hours – 1 week and 1– 2 weeks after symptom onset. Error bars represent 95% confidence intervals. * P < 0.05; ** P < 0.01; *** P < 0.001; **** P < 0.0001.
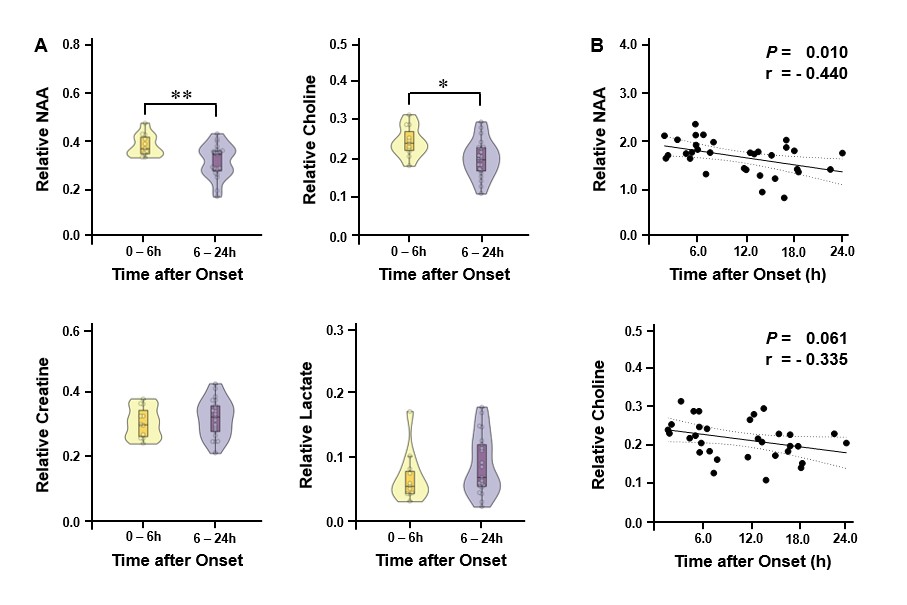
Figure 4. (A) Comparisons of neurometabolites within DWI lesion in hyperacute ischemic stroke patients at 0 – 6 hours and 6 – 24 hours after symptom onset. Error bars represent 95% confidence intervals. ** P < 0.01; * P < 0.05. (B) NAA decreased with time after onset within the first 24 hours post stroke. Dashed lines represent 95% confidence interval of fit.
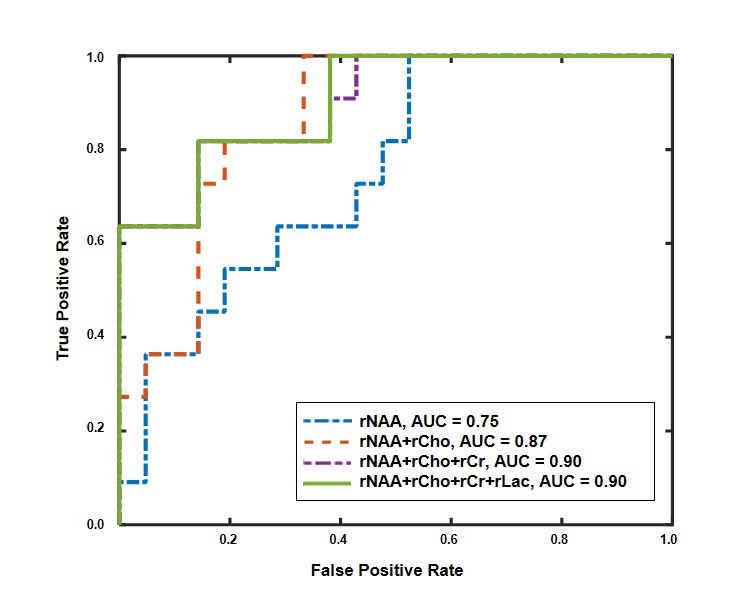
Figure 5. Receiver operating characteristic curves of Bayesian logistic ridge regression for separation between early (0 – 6hours) and late hyperacute (6 – 24hours) ischemic stroke patients.
DOI: https://doi.org/10.58530/2023/0006