0001
Pulmonary MRI & Cluster Analysis Help Identify Novel Asthma Phenotypes1Centre for Heart Lung Innovation, St. Paul’s Hospital, University of British Columbia, Vancouver, BC, Canada, 2Division of Respiratory Medicine, Department of Medicine, University of British Columbia, Vancouver, BC, Canada, 3Robarts Research Institute, Department of Medical Biophysics, Western University, London, ON, Canada, 4Division of Respirology, Department of Medicine, Western University, London, ON, Canada, 5Robarts Research Institute, Department of Medical Biophysics; Division of Respirology, Department of Medicine, Western University, London, ON, Canada
Synopsis
Keywords: YIA, Lung
Pulmonary functional MRI measurements have never been evaluated for the generation of imaging-based asthma patient clusters, although computed tomography (CT)-based clusters have been determined. Here we investigated hyperpolarized 129XeMRI ventilation in combination with CT airway measurements in 45 patients with asthma and identified 4 phenotypic clusters with distinct structure-function and clinical characteristics. Our results revealed a novel cluster of patients only distinguished by MRI ventilation measurements, underscoring the utility of MRI to discriminate airway pathologies in asthma. Imaging-based clusters of asthma provide novel structure-function insights that may be exploited in future studies and challenge current clinical paradigms for asthma phenotyping.Introduction:
Asthma is a common chronic inflammatory lung disease with a range of underlying disease processes.1 Current clinical phenotypes are typically based on demographic, clinical and/or pathobiological characteristics, yet most do not show strong relationships with disease pathogenesis or treatment responses. Quantitative imaging biomarkers in combination with machine learning clustering methods provide novel ways to generate imaging-based phenotyping of patients with respiratory disease. Hyperpolarized 129Xe gas MRI has revealed spatially and temporally persistent ventilation abnormalities in patients with asthma that are sensitive to patient outcomes and treatment responses.2 Chest computed tomography (CT) phenotypes have previously been explored,3,4 however the incorporation of functional 129XeMRI in cluster analyses has the potential to better describe airway pathologies and provides new information, complementary to CT measurements. The purpose of this study was to derive novel data-driven imaging phenotypic clusters of asthma using functional 129XeMRI biomarkers in combination with structural CT airway biomarkers.Methods:
Participants and Data Acquisition:Participants with asthma provided written informed consent to an ethics-board-approved protocol (NCT02351141/NCT02263794/NCT03733535) and underwent MRI, CT and pulmonary function tests during a single two-hour visit. Asthma severity was defined using Global Initiative for Asthma (GINA) treatment step criteria.1 1H and 129XeMRI were performed within five-minutes using a whole-body 3.0T MR750 system (General Electric Healthcare, USA) with broadband imaging capabilities as previously described.5 Subjects were instructed to inhale a gas mixture from a 1.0L Tedlar bag from functional residual capacity and image acquisition was performed under breath-hold conditions. Anatomical 1H MRI was performed before 129Xe after inhalation of 100% N2 using the whole-body radiofrequency coil and 1H fast-spoiled, gradient-recalled echo (FGRE) sequence with partial echo (8s total acquisition time, repetition-time (TR)/echo-time (TE)/flip angle=4.7ms/1.2ms/30°, field-of-view (FOV)=40x40cm, matrix=128x80 zero-padded to 128x128, 15-17 slices, 15mm slice thickness, zero gap). 129Xe static ventilation images were acquired after inhalation of 400mL 129Xe diluted to 1.0L with N2 using a custom-built linear birdcage or commercial flexible vest (Clinical MR Solutions, USA) transmit/receive chest coil and fast-gradient echo method with partial echo (11s total acquisition time, TR/TE/=5.1ms/1.5ms, variable flip-angle, initial=1.3°, FOV=40x40cm, matrix=128x80 zero-padded to 128x128, 15-17 slices, 15mm slice thickness, zero gap). CT was acquired using a 64-slice Lightspeed VCT system (GEHC) within ten minutes after MRI, under breath-hold conditions after inhalation of 1.0L N2 to volume-match to MRI.
Data Analysis:
Figure1 provides an overview of the analysis methodology including quantitative MR and CT measurements, and the data clustering approach. Static ventilation MR images were segmented to generate ventilation defect percent (VDP) as the ventilation defect volume normalized to the thoracic cavity volume6 (Figure1A). Airways were segmented from CT using commercial VIDAvision software (VIDA Diagnostics Inc., USA); total airway count (TAC) was quantified as the sum of airways in the segmented airway tree,7 and mean airway wall area percent (WA%), wall thickness (WT), wall thickness percent (WT%), lumen area (LA) and lumen diameter (D) were measured for all third to fifth generation airway segments (Figure1B). WT and D were normalized (denoted*) by participant-specific tracheal values to remove inter-subject variability from age, sex and height.8 Clustering was performed using MATLAB R2020a (Mathworks, USA) in five steps (Figure1C): (1) variable selection based on weakly or nonstatistically significant Spearman correlations between MRI VDP and CT airway measurements, (2) z-score scale normalization of selected variables (3) hierarchical clustering to determine the likely number of clusters, (4) k-means clustering for number of hierarchical clusters ±1, and (5) internal cluster validation using Dunn’s index (maximized), silhouette width (maximized) and Davies-Bouldin index (minimized).
Results:
We evaluated 45 participants with asthma (54±14-years, 27 female), including 10 mild-moderate (GINA2-3), 16 moderate-severe (GINA4) and 19 severe (GINA5). All demographic, pulmonary function test, and imaging measurements were not significantly different between asthma severity groups (p>0.5). VDP was weakly or non-significantly correlated with TAC (ρ=-0.22, p=0.2), WT* (ρ=0.08, p=0.6), and D* (ρ=-0.30, p=0.048), which were therefore selected for clustering. Hierarchical clustering suggested three clusters, and internal validation of two, three and four k-means clusters suggested four was the optimal cluster number. Figure2 shows a qualitative description of the imaging and clinical characteristics of the four final clusters with 129XeMRI and CT airway tree for a representative participant from each. Demographic, pulmonary function test and imaging measurements were significantly different across the clusters (Figure3), with Cluster4 uniquely distinguished by MRI VDP alone.Discussion:
We used MRI VDP with CT TAC, WT* and D* to drive imaging-based clusters with distinct structural, functional and clinical characteristics that directly reflect airway pathologies in asthma. There were otherwise no differences between clinically-defined GINA severity groups. Our results also revealed a novel asthma subgroup (Cluster4) with severely abnormal MRI ventilation that underscores the ability of 129XeMRI to discriminate between abnormal airways that allow ventilation and those that do not, whereas CT or pulmonary function tests alone could not. MRI-CT clusters of asthma provide novel airway structure-function insights that may be exploited in future longitudinal, treatment, epidemiological and genetic studies.Conclusions:
We generated four imaging-derived clusters of asthma with distinct structure-function pathologies and clinical characteristics. Cluster analysis of patients with asthma is feasible using 129XeMRI in combination with CT biomarkers and may challenge currently used paradigms for asthma phenotyping and treatment decisions.Acknowledgements
No acknowledgement found.References
- Global Initiative for Asthma (GINA). Global Strategy for Asthma Management and Prevention. 23, 61, 63 (2022).
- Kooner, H. K. et al. Pulmonary functional MRI: Detecting the structure-function pathologies that drive asthma symptoms and quality of life. Respirology 27, 114-133, doi:10.1111/resp.14197 (2022).
- Gupta, S. et al. Quantitative computed tomography-derived clusters: redefining airway remodeling in asthmatic patients. J Allergy Clin Immunol 133, 729-738.e718, doi:10.1016/j.jaci.2013.09.039 (2014).
- Choi, S. et al. Quantitative computed tomographic imaging-based clustering differentiates asthmatic subgroups with distinctive clinical phenotypes. J Allergy Clin Immunol 140, 690-700.e698, doi:10.1016/j.jaci.2016.11.053 (2017).
- Svenningsen, S. et al. Hyperpolarized (3) He and (129) Xe MRI: differences in asthma before bronchodilation. J Magn Reson Imaging 38, 1521-1530, doi:10.1002/jmri.24111 (2013).
- Kirby, M. et al. Hyperpolarized 3He magnetic resonance functional imaging semiautomated segmentation. Academic radiology 19, 141-152, doi:10.1016/j.acra.2011.10.007 (2012).
- Kirby, M. et al. Total Airway Count on Computed Tomography and the Risk of Chronic Obstructive Pulmonary Disease Progression. Findings from a Population-based Study. Am J Respir Crit Care Med 197, 56-65, doi:10.1164/rccm.201704-0692OC (2018).
- Choi, S. et al. Quantitative assessment of multiscale structural and functional alterations in asthmatic populations. J Appl Physiol (1985) 118, 1286-1298, doi:10.1152/japplphysiol.01094.2014 (2015).
Figures
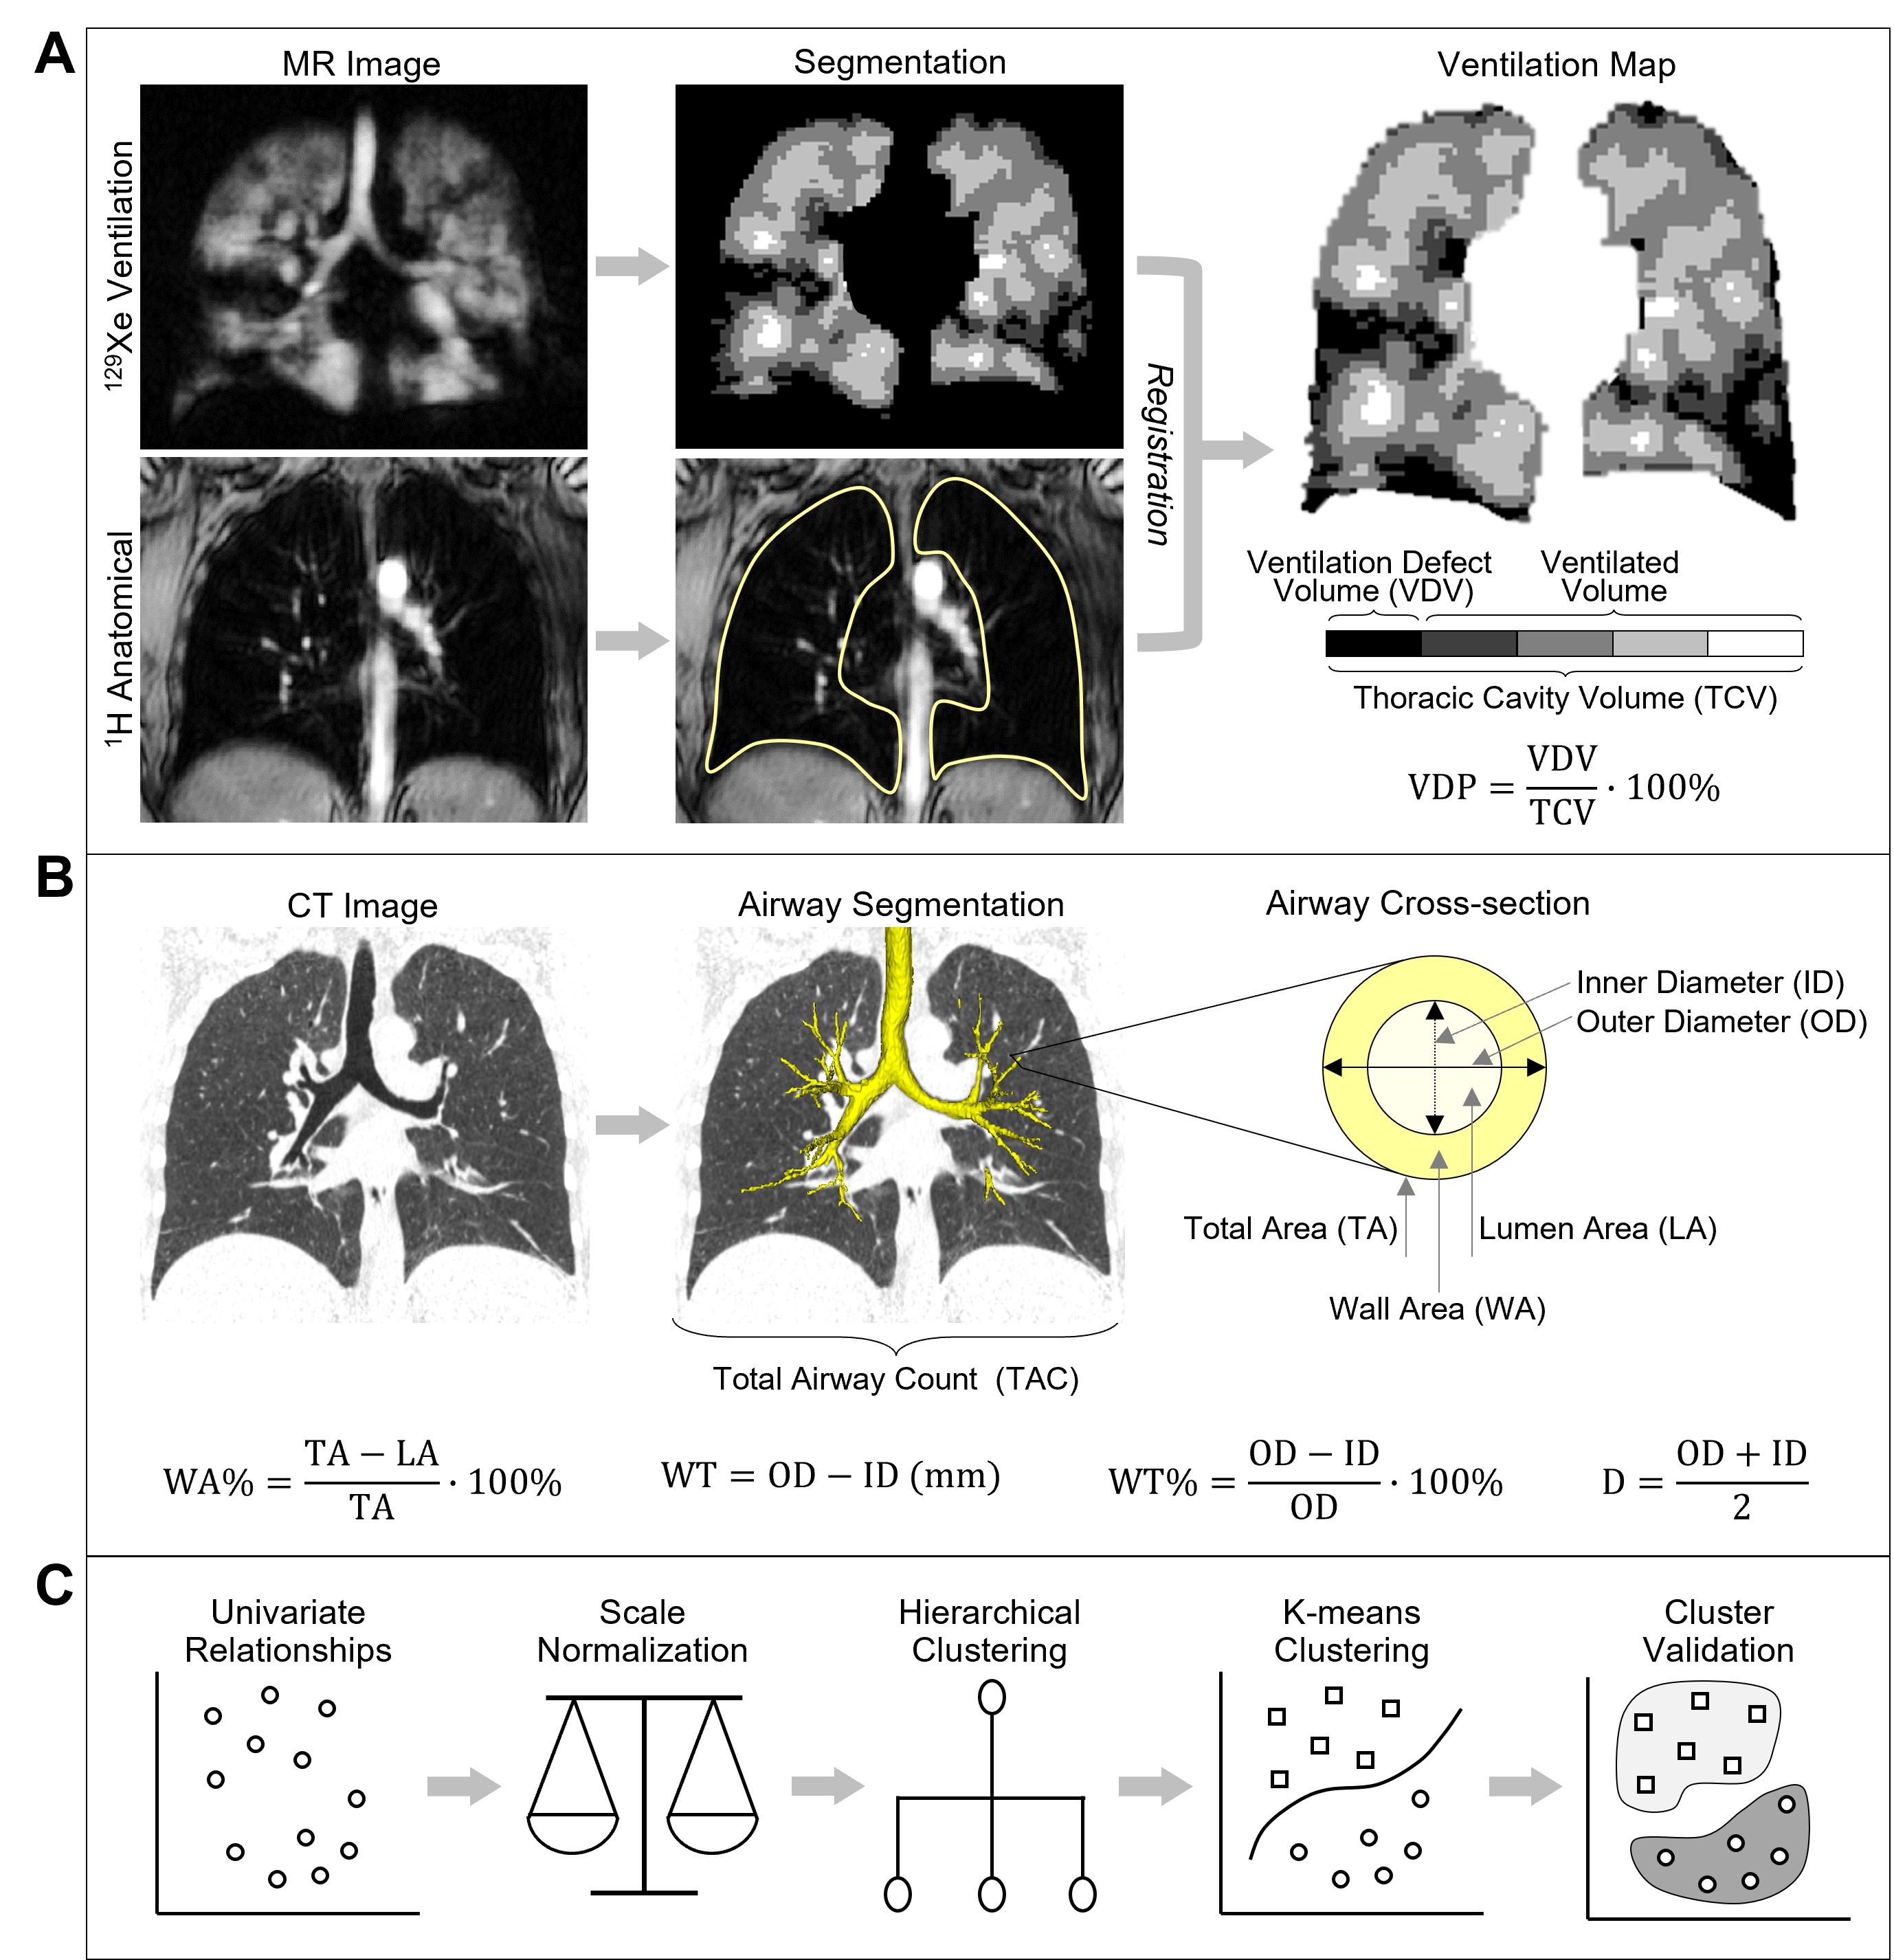
Figure 1. Data Analysis Methodology.
(A) MR image analysis to generate ventilation defect percent (VDP). (B) Computed tomography (CT) analysis to segment the airway tree and generate cross-sectional airway measurements. (C) Clustering methodology to generate imaging-based phenotypic clusters of asthma.
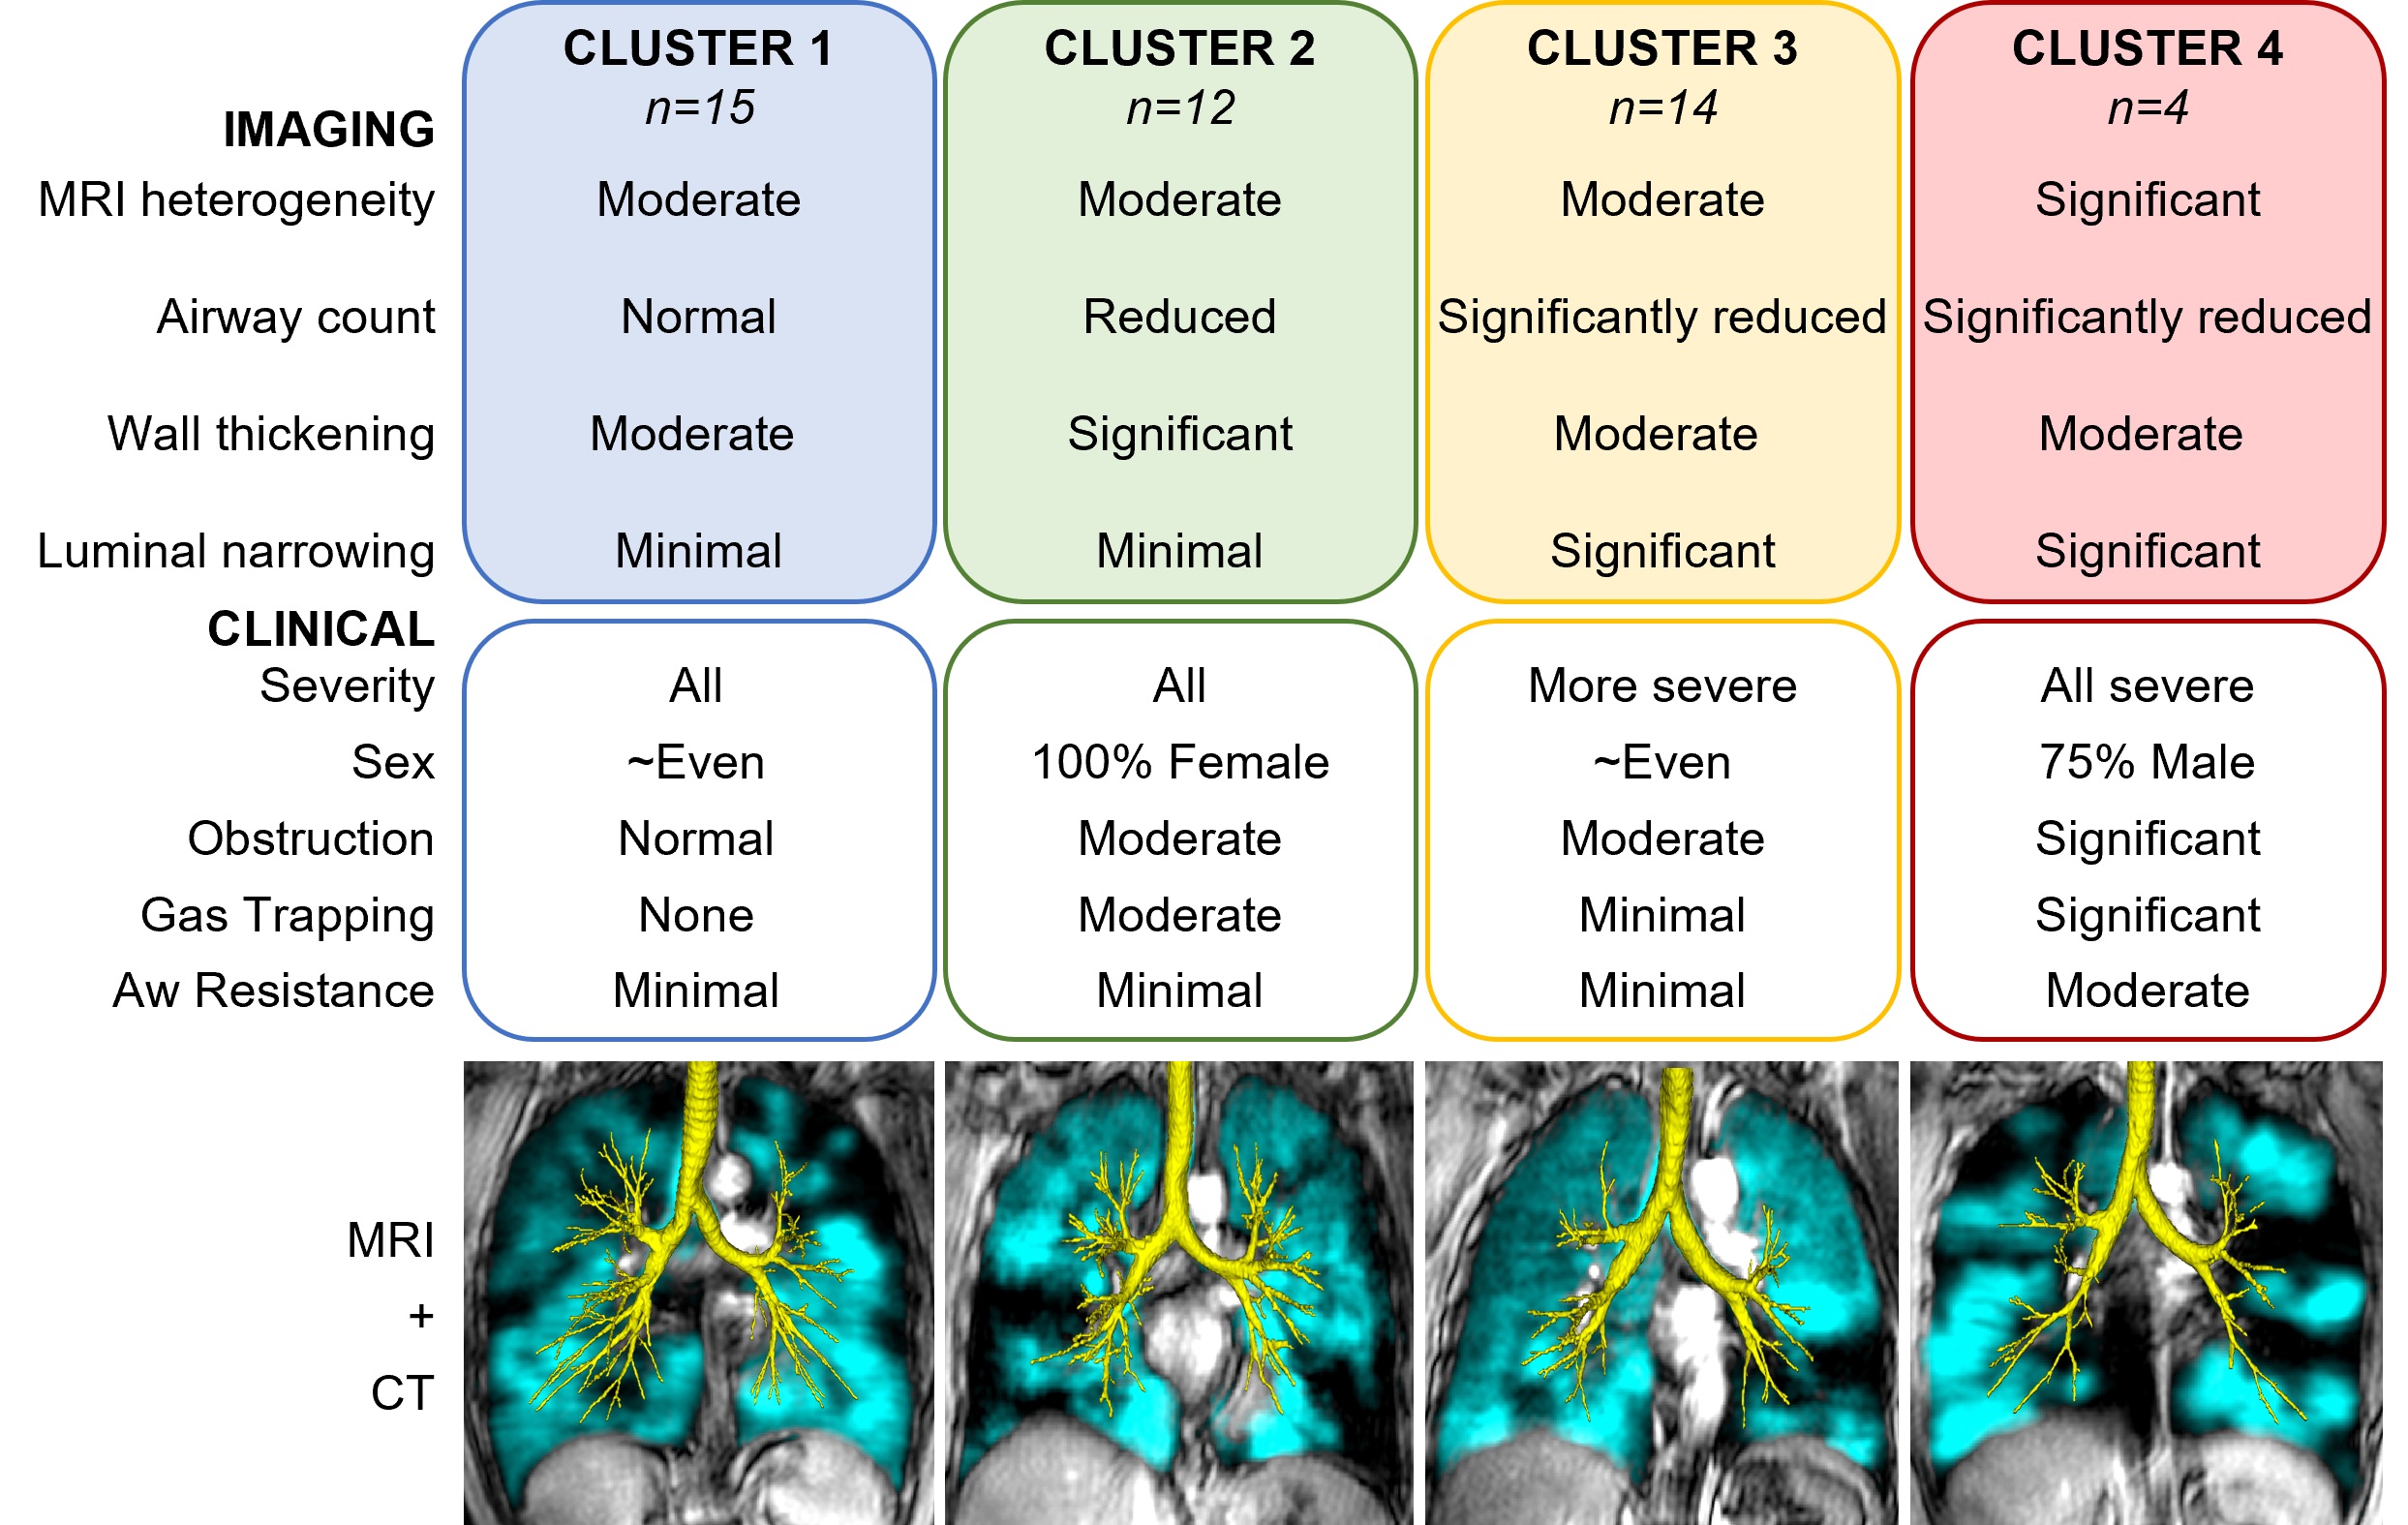
Figure 2. Summary of Asthma Imaging Clusters.
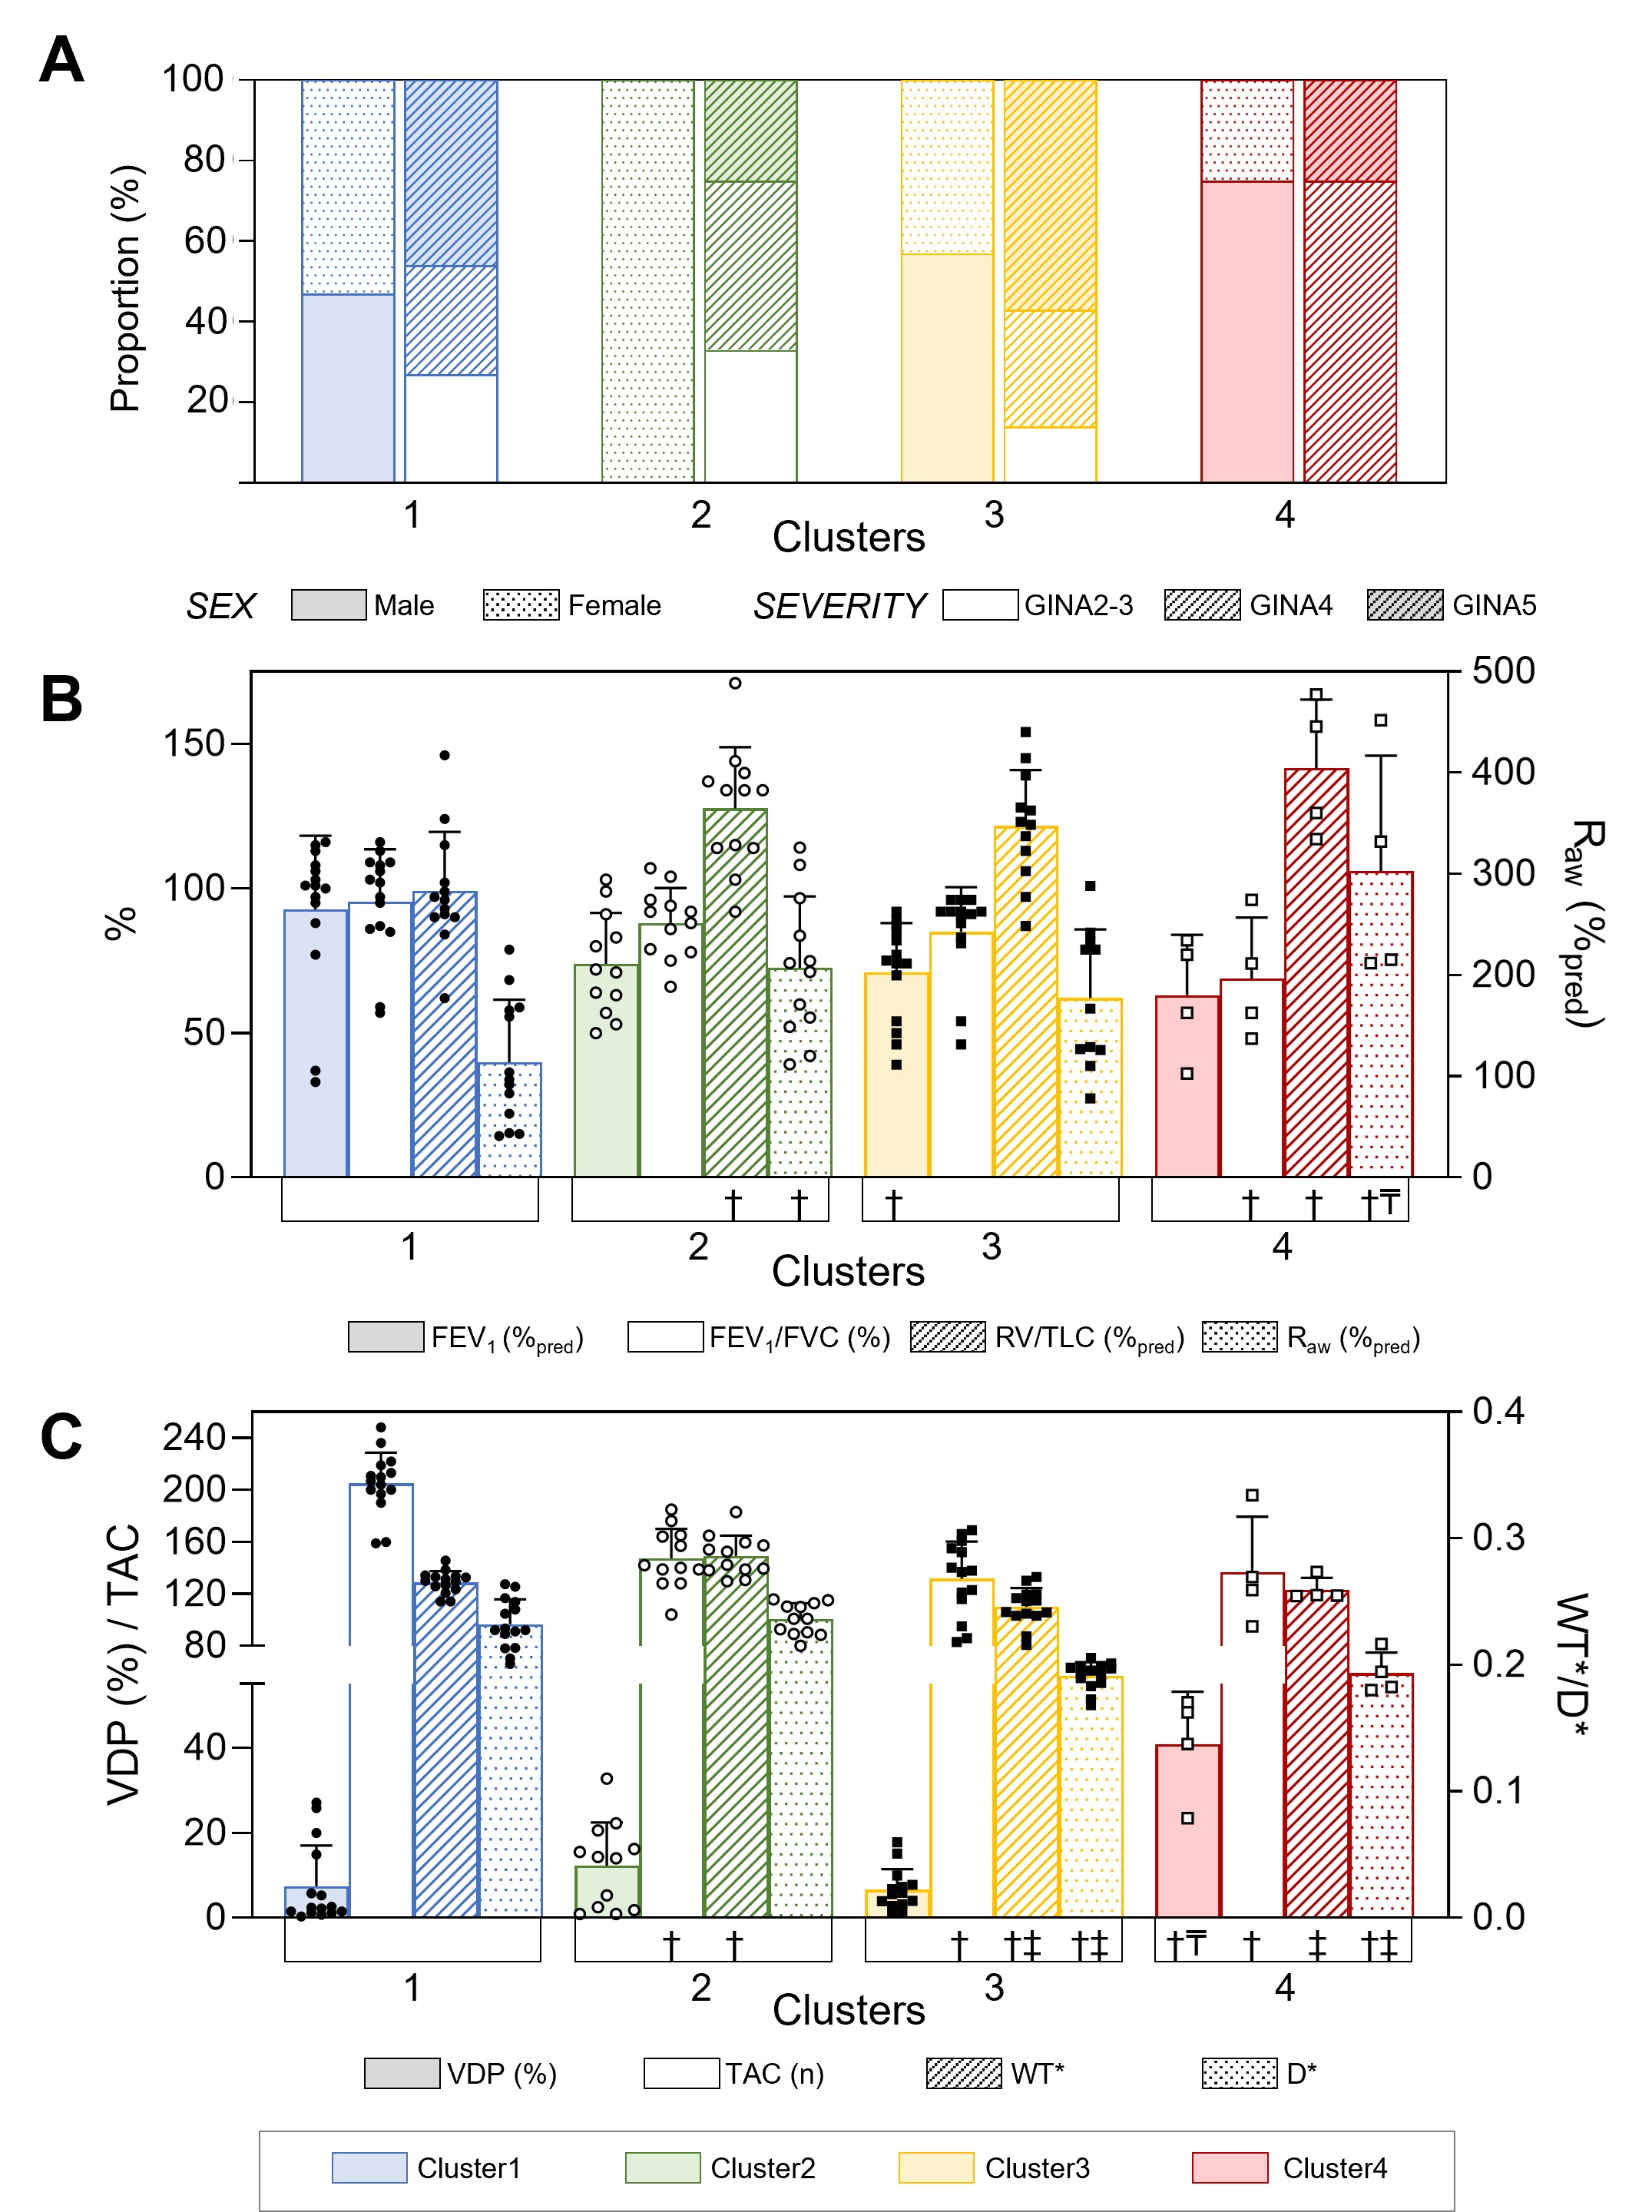
Figure 3. Measurement Comparisons Across Clusters.
(A) Demographic, (B) clinical, and (C) imaging characteristics across clusters.
†Significantly different from Cluster1; ‡Significantly different from Cluster2; ₸Significantly different from Cluster3. GINA=Global Initiative for Asthma; FEV1=forced expiratory volume in 1-second; %=percent of predicted; FVC=forced vital capacity; RV=residual volume; TLC=total lung capacity; Raw=airways resistance.