5078
Constructing an Image Quality Comparison1Radiology, Boston Children's Hospital, Boston, MA, United States, 2Computational Radiology Laboratory, Boston Children's Hospital, Boston, MA, United States
Synopsis
Magnetic resonance imaging (MRI) has become an increasingly popular imaging exam for pediatric patients due to its high resolution, multiplanar capabilities, and lack of ionizing radiation [1]. MRI is highly beneficial by providing detailed imaging to assist in the diagnosis and treatment plan for patients, but before a sequence becomes part of an established clinical protocol, there are many trials performed and data collected. Novel sequences, such as the motion robust imaging technique MPnRAGE [2], are emerging to help alleviate clinical imaging dilemmas, like motion artifacts, but this data needs to be examined and understood to make advancements.
Background
Before a sequence is employed for patient care purposes, it's considered a work in progress (WIP) and is investigated. With the data collected, scientists can make improvements and ultimately create an established sequence impacting patient care. In pediatric MRI, WIP sequences help support advancements like increasing image quality, decreasing scan duration, and eliminating motion artifacts. Diagnostic pediatric MRI exams are challenging to achieve due to patient fear and anxiety which causes motion. Repeated exams are costly and delay the diagnosis and treatment. Due to these challenges, anesthesia is administered, but also incurs motion artifacts, increased cost, schedule delays, and risks of adverse events. There is a growing need to evaluate new concepts that may be helpful in reducing these issues while preserving diagnostic image quality. The evaluation of novel imaging strategies benefits from both qualitative assessment by expert radiologists, and from quantitative assessment of image quality measures. The use of objective image quality measures can allow for rapid assessment of different image acquisition parameters and different reconstruction algorithms, enabling the evaluation of a much broader range of imaging strategies with less time and cost than could be carried out relying on expert evaluation alone. In this work, we investigated the image quality measures to compare two 3D high-resolution T1 structural imaging sequences, an established sequence, Cartesian MPRAGE, and a WIP sequence, radial MPnRAGE, which can alleviate motion artifacts.Method
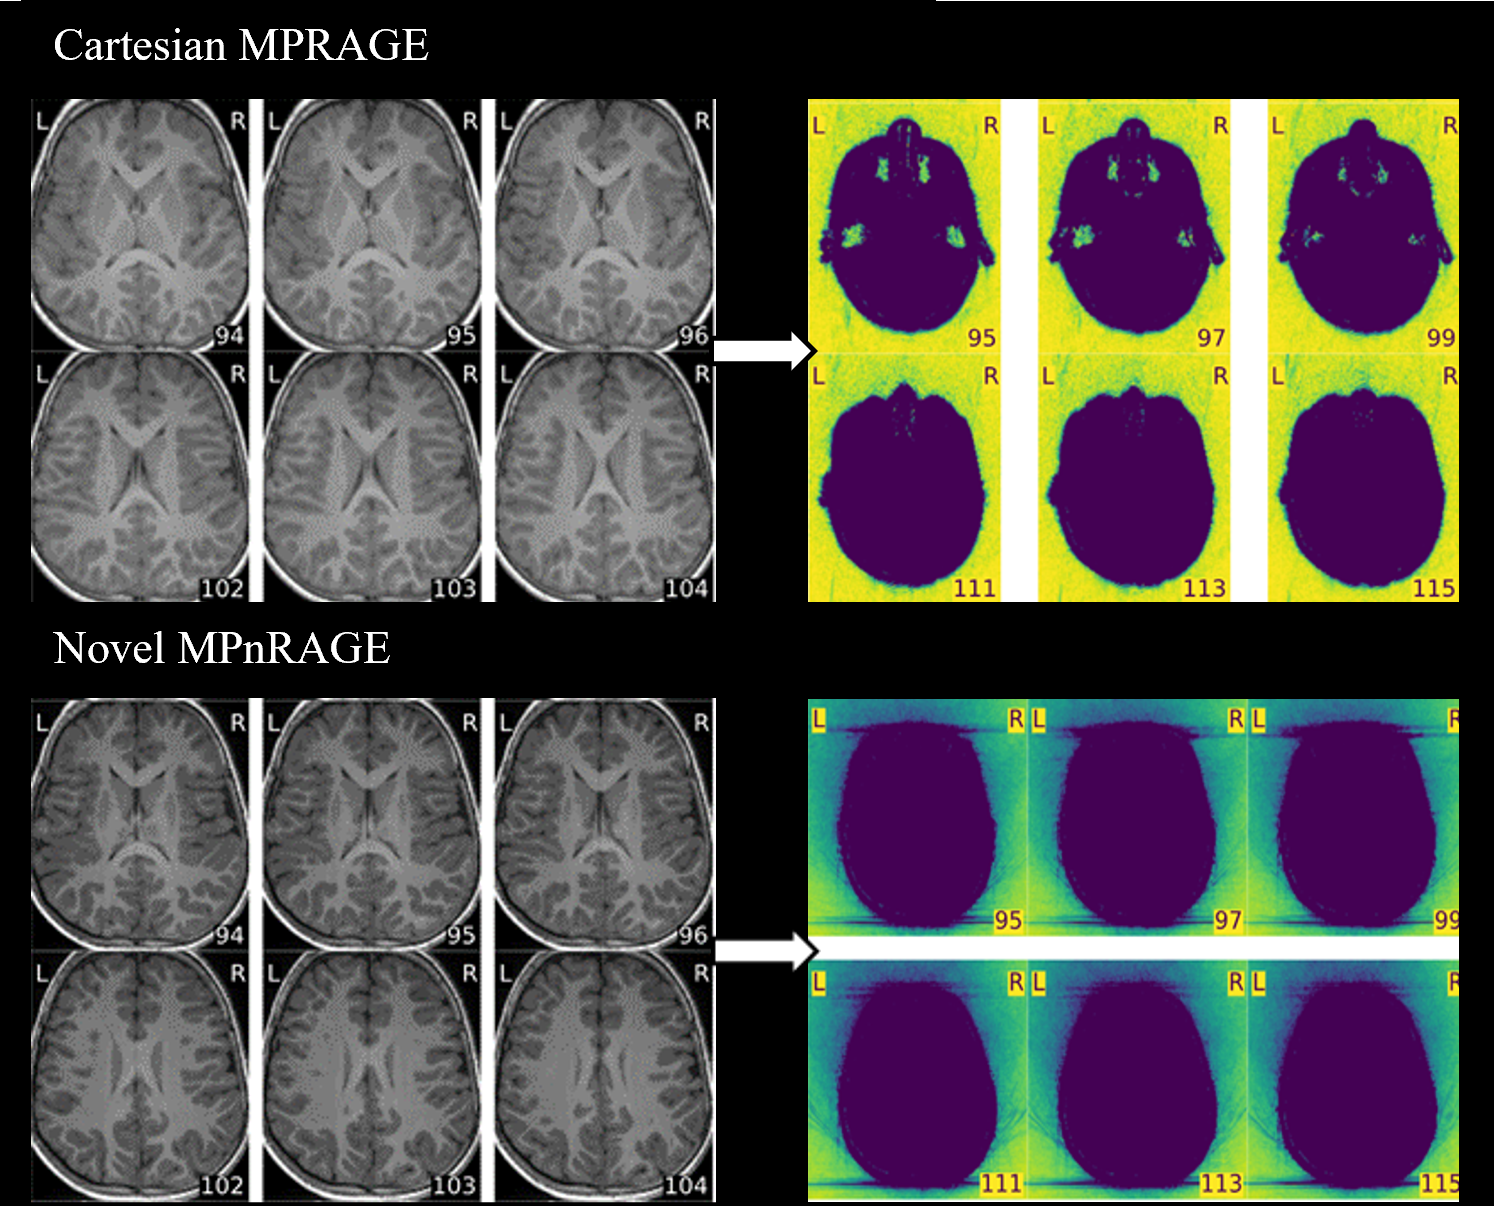
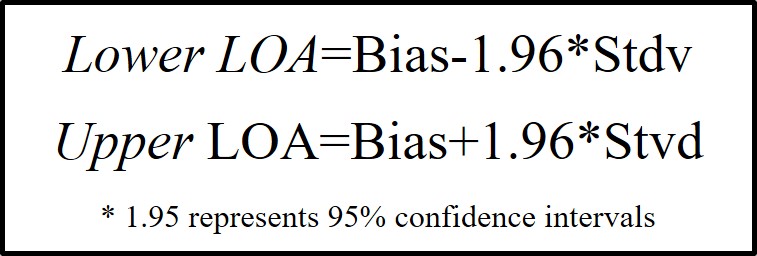
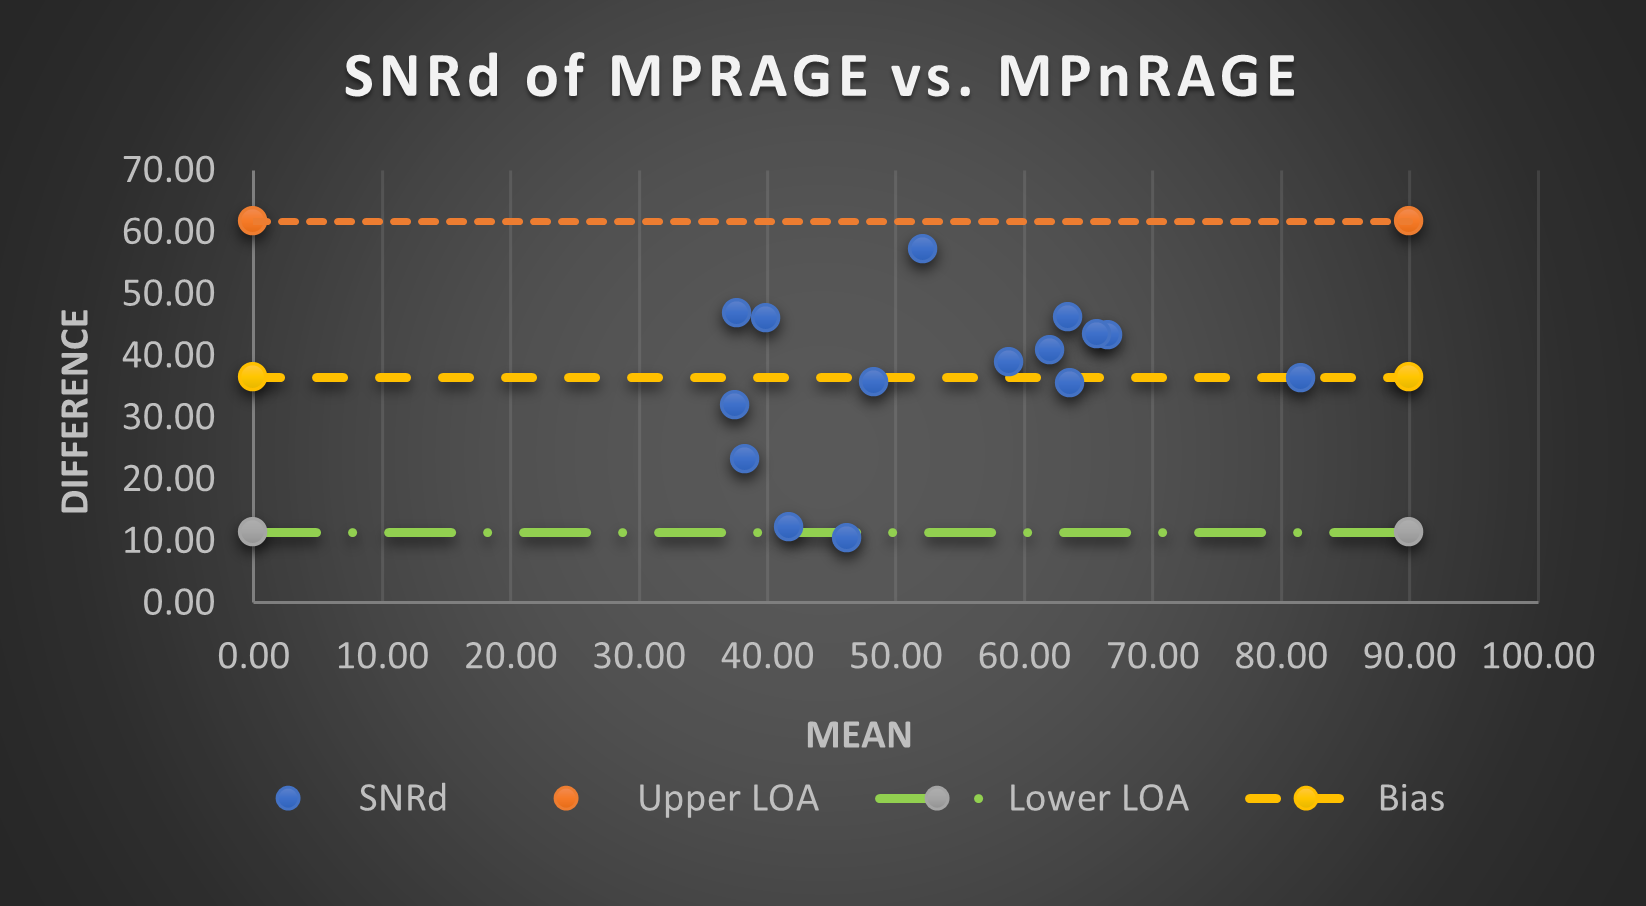
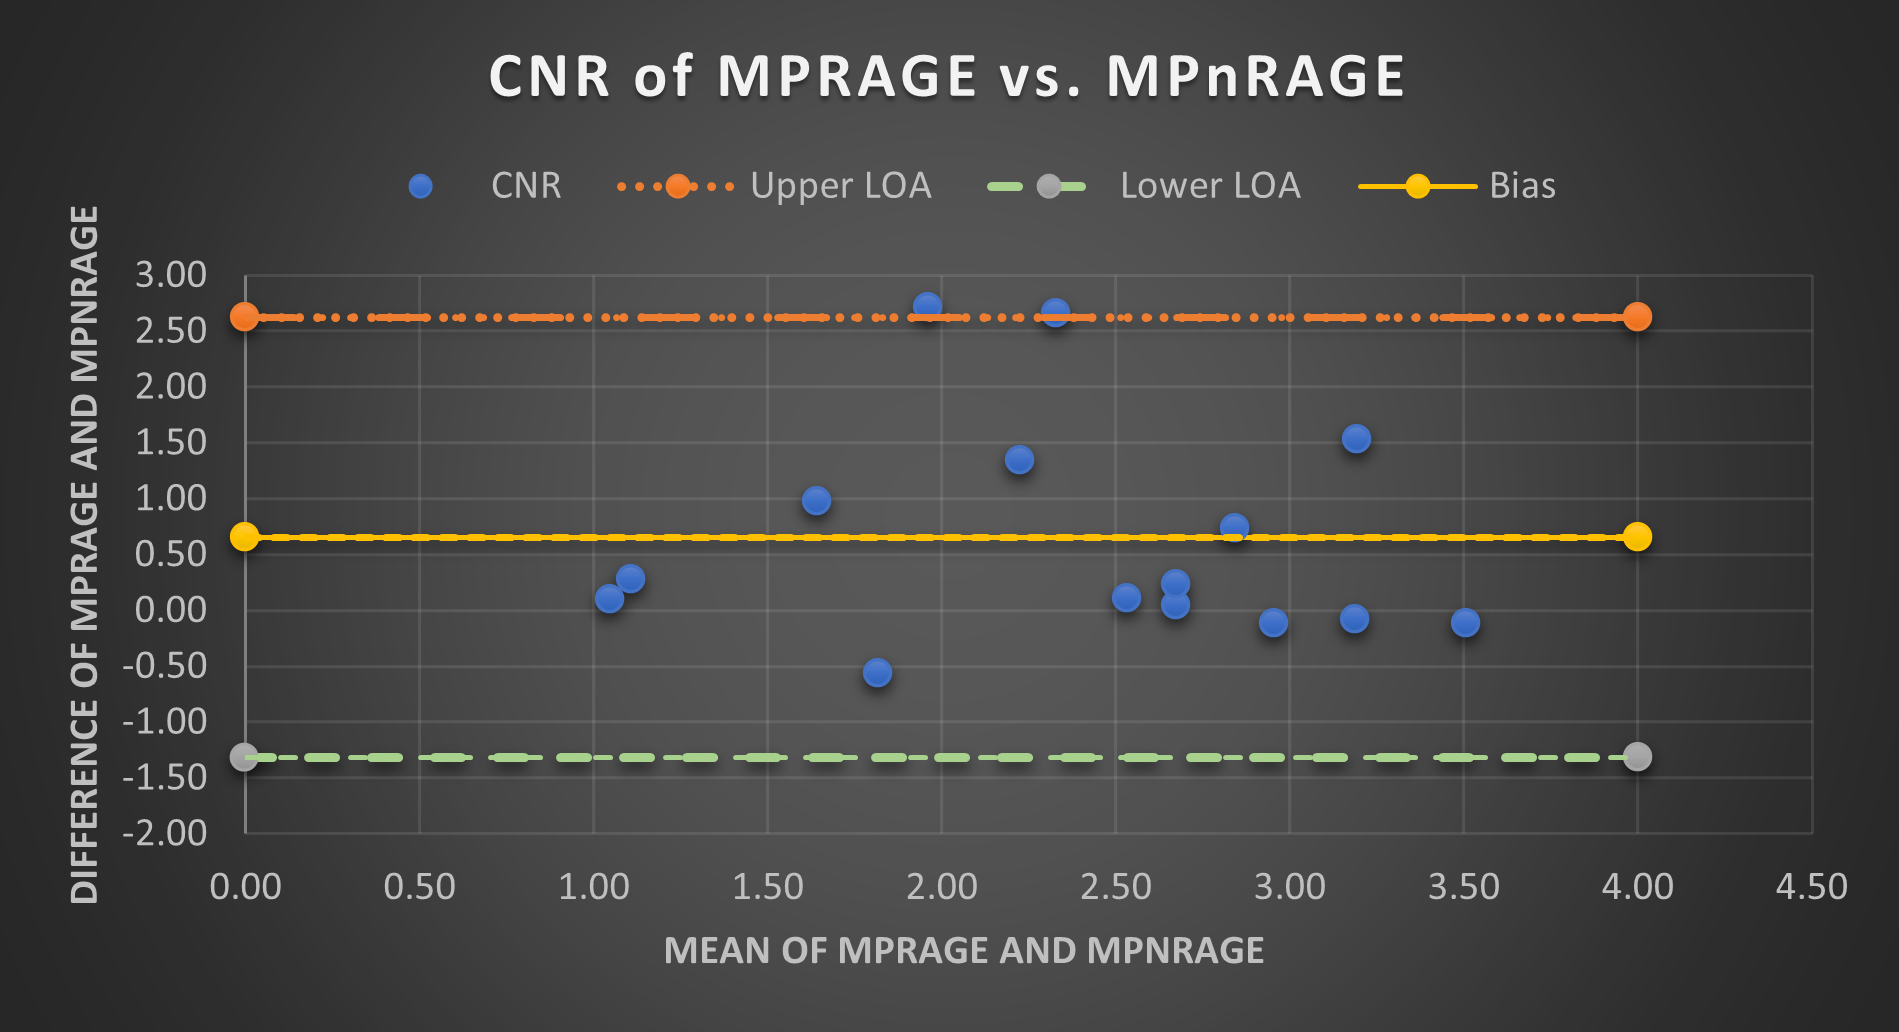
A cohort of subjects undergoing routine clinical MRI was recruited, consented with an appropriate institutional review board (IRB) protocol, and acquired the established MPRAGE and WIP MPnRAGE. At exam completion, images were electronically transferred into FlyWheel software, a cloud based computationally enabled research DICOM service, where each sequence was assessed using MRIQC, a previously described and validated software application which provides image quality metrics (IQMs) for structural T1and T2 weighted sequences [6]. When visually comparing the images of the MPRAGE and MPnRAGE sequence (Fig.1), it is observed that the images offer similar contrast and spatial resolution. Image quality metrics (IQMs) of signal to noise ratio (Dietrich’s) (SNRd) and contrast to noise ratio (CNR) were measured with MRIQC [6]. SNRd is defined by MRIQC based on Dietrich’s description of the mean of the signal in a region of interest, divided by an estimate of image noise computed from an automatically determined region of interest in the background [6]. This routinely employed quantification can assess imaging hardware, protocols, and acquisition sequences [6][7]. CNR is a measurement of the image contrast to the background noise. This is calculated by measuring the mean signal intensity of two regions of interest in an image, subtracting them and normalizing by a pooled measure of the standard deviation which reflects noise power. The ability to identify subtle features in images improves as the SNR and CNR increase. A visualization of the data that allows for assessment of similarities or differences between imaging techniques is the Bland-Altman plot. To display the findings, the SNRd and CNR data collected were each imported into a Bland Altman plot respectively. “The Bland Altman plot assesses a bias and estimates an agreement interval, within which 95% of the differences of the second method, compared to the first one, fall” [3,9]. We created Bland-Altman plots for the SNRd and CNR of the MPRAGE and a particular setting of the WIP MPnRAGE for 15 subjects. The bias, defined as the average of the differences between the two data sets, and the standard deviation of the differences were determined and used to calculate the lower level of agreement (LOA) and upper LOA. The lower and upper LOAs were determined utilizing the equations in Figure 2. These calculations were then plotted displaying the difference and mean of SNRd and CNR between the established MPRAGE and novel MPnRAGE.Results
Data was collected from 15 participants, who received both the established Cartesian MPRAGE sequence and the novel radial MPnRAGE sequence. Previously stated, in Figure 1 the images from the MPRAGE and MPnRAGE look similar in contrast. Visual differences can be altered by display settings, so it is valuable to make quantitative assessments. The Bland Altman plots help display the SNRd and CNR in the images (Figures 3 and 4). The data displayed offers insight into mean differences of SNRd and indicate an elevated variance in the background of the work-in-progress sequence. This finding through quantitative measurements then suggests the need for further investigation to identify the source of the elevated signal in the background, which may arise from aspects of the image reconstruction pipeline or suggest other changes in acquisition parameters be made to further increase image quality. Non-cartesian reconstructions may exhibit reconstruction artifacts differently to Cartesian acquisitions and may warrant different assessment strategies.Conclusion
With the rising demand for increased image quality in pediatric MRI imaging, it is imperative to continue exploring new imaging techniques and compare them to the gold standards of today. The availability of quantitative measurements can aid in understanding and optimizing imaging parameters. Plots such as the Bland Altman are easy to review and conclude where improvements could be made. With these plots, improvements can be put forth to increase the image quality of the next cohort.Acknowledgements
This research was supported in part by the following grant: NIH-2R01EB019483-05A1.References
1. Jaimes C, Gee MS. Strategies to minimize sedation in pediatric body magnetic resonance imaging. Pediatr Radiol 2016; 46:916–927.
2. Kecskemeti et al. (2018) Robust Motion Correction Strategy for Structural MRI in Unsedated Children Demonstrated with Three-dimensional Radial MPnRAGE. Radiology; 289, pp. 509-516
3. Giavarina D. Understanding Bland Altman analysis. Biochem Med (Zagreb). 2015;25(2):141-151. Published 2015 Jun 5. doi:10.11613/BM.2015.015
4. Lemaire C, Moran GR, Swan H. Impact of audio/visual systems on pediatric sedation in magnetic resonance imaging. J Magn Reson Imaging. 2009 Sep;30(3):649-55. doi: 10.1002/jmri.21870. PMID: 19630083.
5. Ma YJ, Shao H, Fan S, Lu X, Du J, Young IR, Bydder GM. New options for increasing the sensitivity, specificity and scope of synergistic contrast magnetic resonance imaging (scMRI) using Multiplied, Added, Subtracted and/or FiTted (MASTIR) pulse sequences. Quant Imaging Med Surg. 2020 Oct;10(10):2030-2065. doi: 10.21037/qims-20-795. PMID: 33014733; PMCID: PMC7495319.
6. Esteban O, Birman D, Schaer M, Koyejo OO, Poldrack RA, Gorgolewski KJ; MRIQC: Advancing the Automatic Prediction of Image Quality in MRI from Unseen Sites; PLOS ONE 12(9): e0184661; doi: 10.1371/journal.pone.0184661.
7. Welvaert M, Rosseel Y. On the definition of signal-to-noise ratio and contrast-to-noise ratio for FMRI data. PLoS One. 2013;8(11): e77089. Published 2013 Nov 6. doi: 10.1371/journal.pone.0077089.
8. Dietrich et al., Measurement of SNRs in MR images: influence of multichannel coils, parallel imaging, and reconstruction filters, JMRI 26(2):375–385. 2007. doi:10.1002/jmri.20969.
9. Bland JM, Altman DG. Statistical methods for assessing agreement between two methods of clinical measurement. Lancet. 1986 Feb 8;1(8476):307-10. PMID: 2868172.
Figures