5074
Reducing MRI scan time to increase patient throughput1Radiology, UCSF, San Francisco, CA, United States, 2Chemistry nd Chemical Biology, Cornell University, Ithaca, NY, United States
Synopsis
We have developed a novel wavelet-based signal processing algorithm capable of denoising signals with extremely low signal-to-noise ratios. The idea is that if raw MRI signals can be denoised in real-time prior to image generation, high quality images can potentially be obtained at drastically shorter scan-times, thereby improving patient comfort and increasing imaging throughput. While conventional signal processing methods are often limited by inadequate noise removal or signal distortion, our method does not suffer from such drawbacks, as it performs localized noise removal based on capturing randomness. This represents an opportunity to increase MRI throughput within existing infrastructure.
Purpose:
To increase patient throughput by reducing MRI scan time.Method:
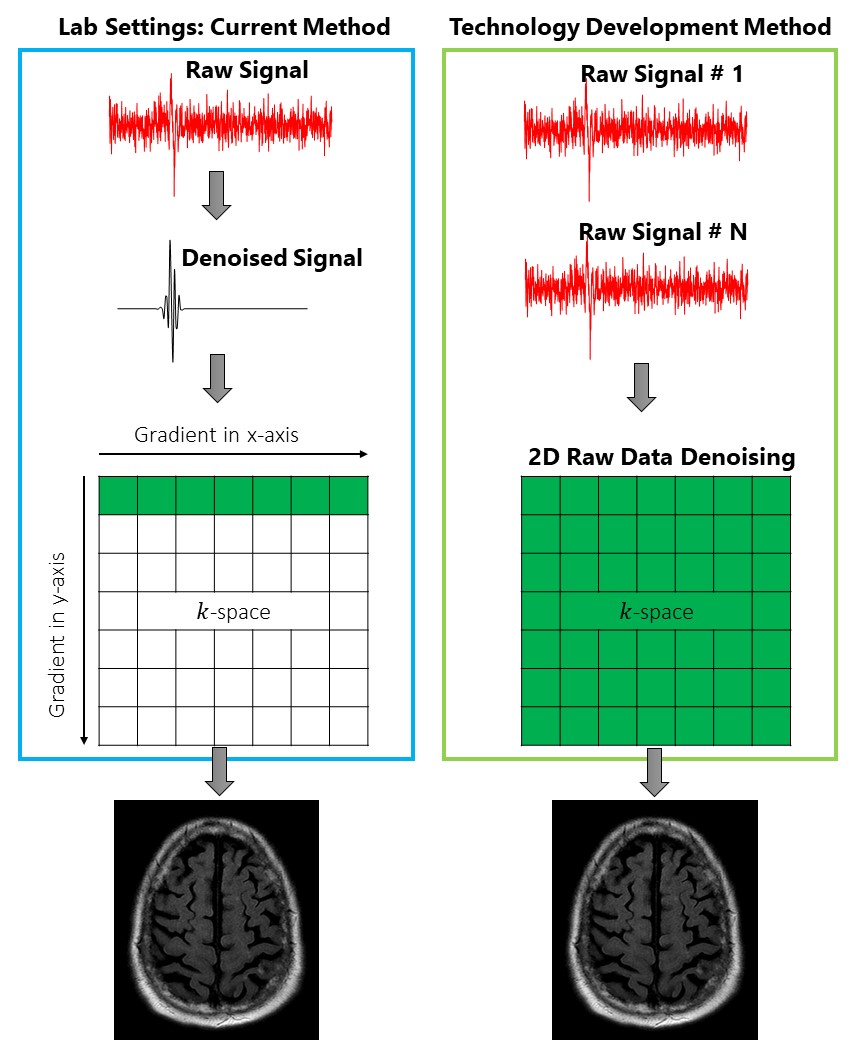
In MRI, image quality directly trade-offs with the scan-time. Longer scan-time yields better image quality and vice-versa. We provide a novel signal processing approach that inputs the poor quality (noisy) images obtained at short scan-times and outputs a denoised image, similar to what would have been obtained after long data acquisition times. Our algorithm isolates noise from raw MRI data by distinguishing between their distinct characteristics: noise is random while raw MRI data contains patterns/features. There are two novel features of our approach: 1) ability to identify and separate noise; and 2) its application in MRI. Compared to conventional signal processing methods such as filtering methods, our new wavelet-shrinkage-based denoising method can process low SNR signals without the limitations of inadequate noise removal or signal distortion (cf. Fig. 1). For applying 2D denoising in the k-space, the following 2D approaches will be developed:- Symmetric 2D Undecimated Discrete Wavelet Transform (2D-SUDWT): Individual raw MRI data are stacked to generate the 2D k-space. To identify noise and signal coefficients, a 2D wavelet representation, 2D-SUDWT, is developed for transforming the 2D k-space signal for enhanced resolution into the wavelet domain. The 2D-SUDWT procedure currently lacks development for arbitrary signal lengths, which is required for its MRI application in the k-space signals for noise removal. This new 2D-SUDWT for k-space is incorporated the signal structure and satisfy its properties for the transform.
- Development of 2D Wavelets: Customized 2D symmetric wavelets is developed to maximize the separation between the randomness of noise and features of signal in the wavelet domain. Both the dimensions of the wavelet will be constructed from “coif3” wavelets. The “coif3” wavelet is selected based in its superior ability to distinguish noise and signal coefficients for such signals, as previously shown by Srivastava et al.1
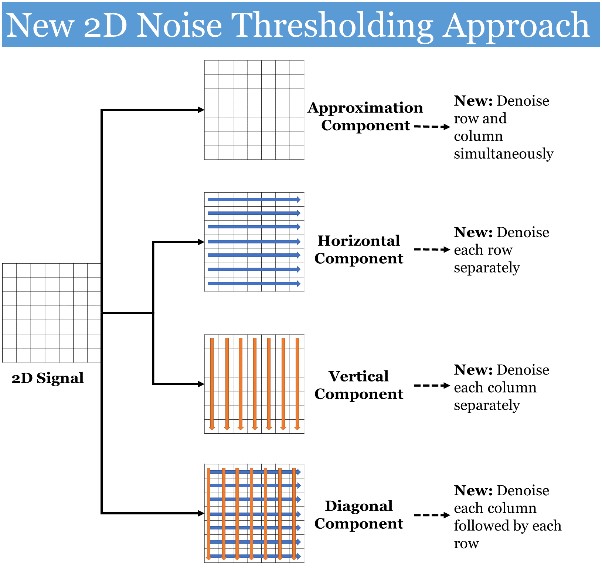
- Noise Thresholding to Remove Noise from Signal: A noise thresholding procedure is developed for each dimension that identifies and eliminates small wavelet coefficients, while keeping large coefficients representing signal. The wavelet components containing noise is identified using the sparsity parameter1–4 developed for the 2D wavelet components. Following this, noise thresholding will be applied to separate noise from signal coefficients, based on differences in their magnitude. Magnitudes of noise coefficients will be smaller than the signal coefficients, as noise is randomly dispersed, and signal is coherent in the wavelet domain. The 2D noise threshold method is developed to remove noise in different wavelet components (cf. Fig. 2).
Data Sources:
The MRI data was collected from the GE machines at 3T magnetic strength at the three imaging facilities. The MRI sequences used for imaging includes the 2D T2-Weighted, 2D Echo-Planar Diffusion Weighted, and 3D T1 and T2-Weighted sequence with and without Fluid Attenuation.Results:
We were able to reduce the MRI scan time by 50% without compromising the image quality. The data was collected, processed, and analyzed for different acquisition times reflecting 25%, 50%, 75% and 100% image quality from the standard protocol. For quantitative measure, objective criteria such as SNR, Contrast-to-Noise Ratio (CNR)5 and Structural Similarity Index Measure (SSIM)6 is used to compare the image similarity between the denoised MRI images and the reference.Conclusion:
As a software-based approach, our denoising algorithm can potentially be integrated with existing instrumentation without any hardware modifications. Since our technology is focused on the novel application of denoising raw data before construction of the MRI image, it exists in a unique position within the image generation process and is complementary with other solutions that are in development (such as artificial intelligence/deep learning) for reducing scan-time.Acknowledgements
This work was supported by the NIGMS/NIH under Grant P41GM103521, the NSF grant under Grant 2044599, and the Cornell IGNITE Grant.References
(1) Srivastava, M.; Anderson, C. L.; Freed, J. H. A New Wavelet Denoising Method for Selecting Decomposition Levels and Noise Thresholds. IEEE Access 2016, 4, 3862–3877. https://doi.org/10.1109/ACCESS.2016.2587581.
(2) Srivastava, M.; Anderson, C. L.; Freed, J. H. Systems, Methods and Programs for Denoising Signals Using Wavelets. US20190287220A1, 2021.
(3) Bekerman, W.; Srivastava, M. Determining Decomposition Levels for Wavelet Denoising Using Sparsity Plot. IEEE Access 2021, 9, 110582–110591. https://doi.org/10.1109/ACCESS.2021.3103497.
(4) Srivastava, M.; Dzikovski, B.; Freed, J. H. Extraction of Weak Spectroscopic Signals with High Fidelity: Examples from ESR. J. Phys. Chem. A 2021, 125 (20), 4480–4487. https://doi.org/10.1021/acs.jpca.1c02241.
(5) Welvaert, M.; Rosseel, Y. On the Definition of Signal-to-Noise Ratio and Contrast-to-Noise Ratio for FMRI Data. 2013.
(6) Wang, Z.; Bovik, A.; Sheikh, H. R.; Simoncelli, E. P. Image Quality Assessment: From Error Visibility to Structural Similarity. IEEE Trans. Image Process. 2004, 13 (4), 600–612. https://doi.org/10.1109/TIP.2003.819861.
Figures