5058
Iterative decomposition of water and fat with echo asymmetry and least-squares estimation (IDEAL-IQ) for evaluation of early bone mass changes in senile osteoporosis patients1Department of Radiology Imaging, The Second Affiliated Hospital of Xiamen Medical College, Xiamen, China, 2GE Healthcare, Beijing, China
Synopsis
BMD is the basis of the diagnostic criteria of OP recommended byWHO. However, limitations in the prediction and evaluation of fracture in postmenopausal_women, because BMD can not fully reflect the bone quality that affects bone strength and fracture risk. We found significant differences in the values among three groups. FF, fat-phase and water-phase value had good performance, while R2*value had poor performance in discriminating osteopenia and OPgroups. Overall, IDEAL-IQtechniqueis expected to provide certain reference indexes, which can noninvasively and quantitatively evaluate the bone metabolism of lumbar vertebrae, such as fat content, and provide accurate information for differential diagnosis of OP.
Introduction
Primary osteoporosis (OP) is one of the common diseases in the elderly. With the development of aging of the global population, the incidence of OP and the accompanying brittle fracture continues to rise, which has become a serious public health problem worldwide [1-5]. Fractures caused by OP directly affect the quality of life of patients, and shorten their life span. Therefore, early diagnosis of OP is very important. At present, BMD is the basis of the diagnostic criteria of OP recommended by the World Health Organization [1,2,5]. However, there are some limitations in the prediction and evaluation of fracture in postmenopausal women, because BMD can not fully reflect the bone quality that affects bone strength and fracture risk[1-3]. Bone strength is not only related to bone mineral content, but also depends on bone quality and renewal metabolism [4,5]. Bone microstructure is a critical factor of bone fragility and plays an independent role in assessing bone quality [3,4,5]. Conventional MRI methods reflect the bone structure, but cannot determine the early metabolism alterations.Quantitative micro-MRI (mu-MRI) and MR spectroscopy (MRS) provide noninvasive information on bone quality. However,their application for detecting OP in clinical practice is limited [6,7,8].The purpose of this study was to investigate the feasibility of Iterative Decomposition of water and fat with Echo Asymmetry and Least-squares estimation (IDEAL-IQ) imaging technique in the early diagnosis of senile OP.Materials and Methods
The research project was reviewed and approved by the Medical Ethics Committee of our institution, and written informed consent was obtained from all participants. 172 participants with 100 cases inthe normal group, 33 casesin the osteopenia group, and 39 cases in the OP groupwere enrolledin this study.All participants underwent MRI examinations on a 3.0T scanner (GE Healthcare, Milwaukee, WI). Conventional 2D T1WI andT2WI were first obtained, followed by 3D IDEAL-IQ acquisition. The detailed parameters of IDEAL-IQ were as follows: TR = 9.7 ms, TE = 3.3 ms, flip angle = 4°, FOV = 32 cm × 32 cm, matrix size = 160 × 160, slice thickness = 3 mm, number of slices = 32, NEX = 0.5.Fat fraction (FF), relaxation rate (R2*), water-phase, fat-phase, in-phase and out-phase results were automatically generated on the console. Based on T1W and T2W images, the ROIs for each participant were manually drawn with following steps: 1) five middle slices were selected; 2) L1-L5 vertebral bodies in each slice were selected; 3) six 10 mm × 10 mm ROIs in each vertebral body of each slice were delineated, resulting in a total of 300 ROIs (Figure 1). Six parameters among threegroups were compared using one-way ANOVA, and post-hoc LSD and s-n-k test. Receiver operating characteristic (ROC) curve analysis was usedto assess the performance in differentiating between groups, and the sensitivity and 1-specificity were acquired. P-values < 0.05 were considered statistically significant.Results
FF, R2*, water-phase, fat-phase, in-phase, and out-phase valuesin males of three groups wereshown in Table 2. The F values for these sixparameters were 11319.292, 180.130, 1227.821, 4081.919, 157.476, and 203.397 (all P < 0.0001), respectively.The sensitivity and 1-specificity of FF values in differentiating normal and osteopenia groups, differentiating normal and OP groups, and differentiating osteopenia and OP groups were 0.906 and 0.050, 0.994 and 0.003, 0.865 and 0.180. For R2*, they were 0.665 and 0.384, 0.563 and 0.481, 0.571 and 0.632. For water-phase, they were 0.736 and 0.400, 0.843 and 0.251, 0.682 and 0.348. For fat-phase, they were 0.851 and 0.120, 0.869 and 0.045, 0.663 and 0.267. For in-phase, they were 0.593 and 0.369, 0.602 and 0.349, 0.542 and 0.463. For out-phase, they were 0.740 and 0.496, 0.472 and 0.354, 0.589 and 0.241 (Figure 2a, b, c and Table 3). FF, R2*, water-phase, fat-phase, in-phase, and out-phase valuesin females of three groups wereshown in Table 2. The F values for these sixparameters were12461.658, 548.274, 2200.872, 7114.207, 736.805, and 170.702 (all P < 0.0001), respectively.The sensitivity and 1-specificity of FF values in differentiating normal and osteopenia groups, differentiating normal and OP groups, and differentiating osteopenia and OP groups were 0.985 and 0.009, 0.996 and 0.004, 0.581 and 0.322. For R2*, they were 0.698 and 0.270, 0.603 and 0.335, 0.622 and 0.475. For water-phase, they were 0.823 and 0.220, 0.888 and 0.179, 0.606 and 0.419. For fat-phase, they were 0.946 and 0.024, 0.965 and 0.010, 0.553 and 0.297. For in-phase, they were 0.676 and 0.314, 0.729 and 0.252, 0.531 and 0.409. For out-phase, they were 0.755 and 0.397, 0.348 and 0.436, 0.470 and 0.234(Figure 2d, e, f and Table 3).Discussion
In this study, we found significant differences in the values among three groups. Pairwise ROC analysis showed that FF, fat-phase and water-phase value had good performance, while R2* value had poor performance in discriminating osteopenia and OP groups. Overall, IDEAL-IQ techniqueis expected to provide certain reference indexes, which can noninvasively and quantitatively evaluate the bone metabolism of lumbar vertebrae, such as fat content, and provide accurate information for differential diagnosisof OP.Acknowledgements
Funding
This work was supported by
1.Planned Project Grant (Grant No. 3502Z20199064) from the Science and Technology Bureau of Xiamen(CN).
2.The training project (Grant No. 2020GGB067)of the youth and middle-aged talents of Fujian Provincial Health Commission(CN).
References
1. Miller RG. Osteoporosis in postmenopausal women:Therapy options across a wide range of risk for fracture [J].Geriatrics,2006,61(1): 24-30.
2. Oei L, Rivadeneira F, Zillikens MC, et al. Diabetes, diabeticcomplications, and fracture risk [J]. CurrOsteoporos Rep, 2015, 13(2):106-115.
3. Paul D Miller. Management of severe osteoporosis. Expert OpinPharmacother. 2016;17(4):473-88.doi: 10.1517/14656566.2016.1124856.
4. David Kendler, Arkadi Chines, Patricia Clark, et al. Bone Mineral Density After Transitioning From Denosumab to Alendronate [J]. J Clin Endocrinol Metab. 2020 Mar 1;105(3):e255-e264.doi: 10.1210/clinem/dgz095.
5. Allyson Sleeman, Jennifer N Clements. Abaloparatide: A new pharmacological option for osteoporosis [J]. Am J Health Syst Pharm. 2019 Jan 25;76(3):130-135.doi: 10.1093/ajhp/zxy022.
6. Cao H, Nazarian A, Ackerman JL,et al. Quantitative31PNMRspectroscopy and1HMR measurements of bone mineral and matrixdensity differentiate metabolic bone diseases in rat models[J]. Bone,2010,46:1582-1590.
7. Li X, Kuo D, Schafer AL, et al. Quantification of vertebral bonemarrow fat content using 3 Tesla MR spectroscopy: reproducibility,vertebral variation, and applications in osteoporosis [J]. J MagnResonImaging, 2011, 33(4): 974-979.
8. Soldati E, Rossi F, Vicente J, Guenoun D, Pithioux M, Iotti S, Malucelli E, Bendahan D.Survey of MRI Usefulness for the Clinical Assessment of Bone Microstructure.Int J Mol Sci. 2021 Mar 2;22(5):2509. doi: 10.3390/ijms22052509.
Figures
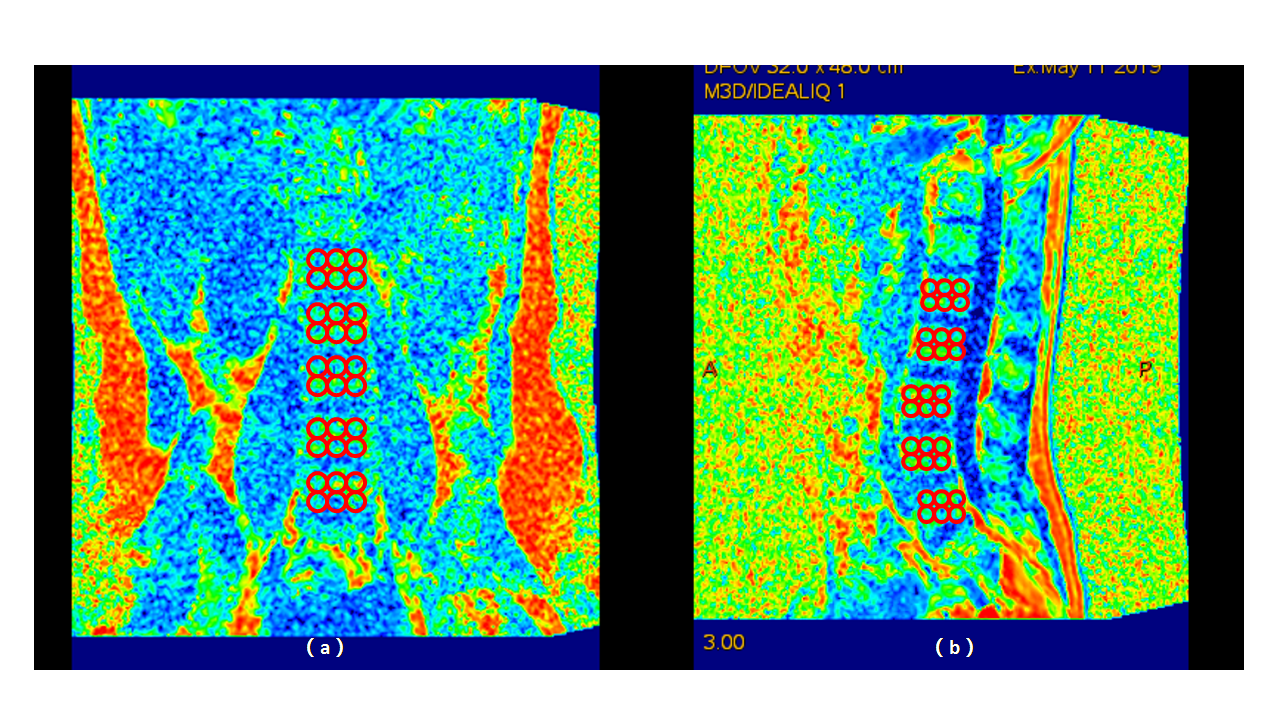
Figure 1
Manually sketch the ROI area in FF image of male (a). in Coronal view; (b). in sagittal view;
the ROIs for each participant were manually drawn with following steps: 1) five middle slices were selected; 2) five L1-L5 vertebral bodies for each slice were selected; 3) six 10 mm × 10 mm ROIs (placed in two rows according to the sagittal front, middle and back, and coronal right, middle and left) for each vertebral body in each slice were delineated, avoiding the area of blood vessels and fat island.Finally, a total of 300 ROIs were selected for each patient.
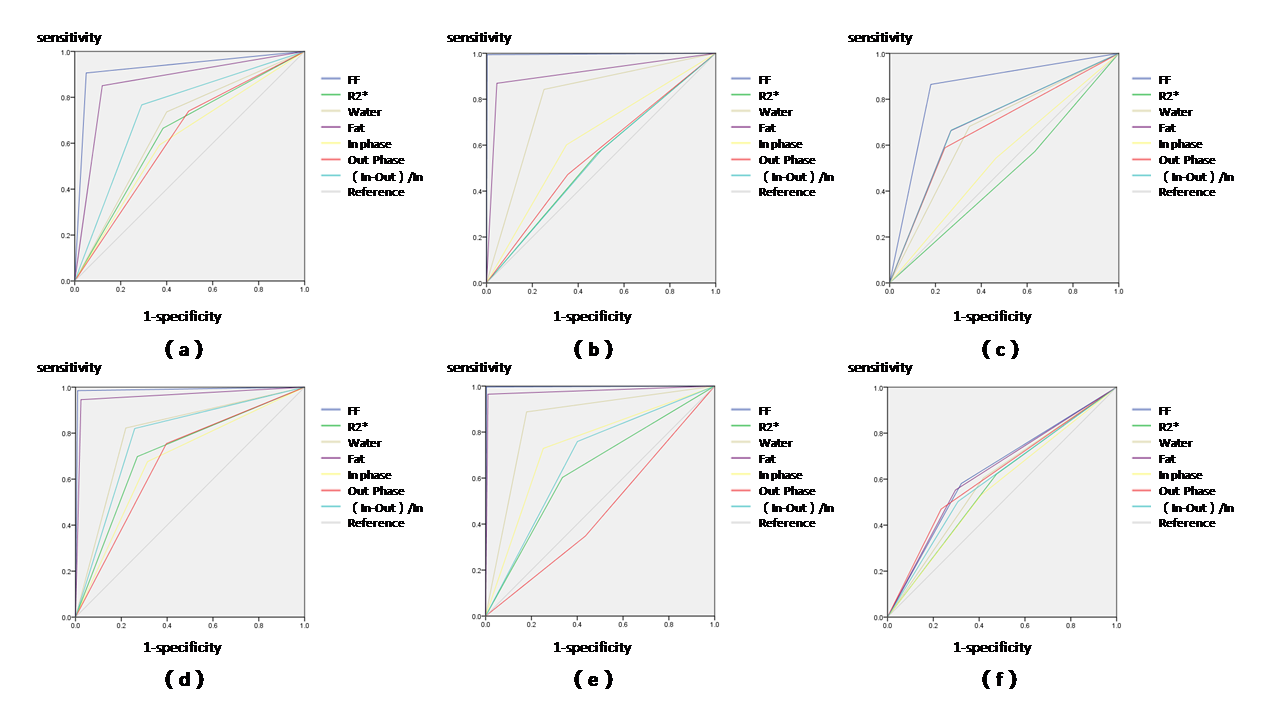
Figure 2
The sensitivity and 1-specificity of ROC curve analysis (a)-(c).male: (a).normal and osteopenia group; (b).normal and osteoporosis group; (c).osteopenia and osteoporosis group; (d)-(f).female: (d).normal and osteopenia group; (e).normal and osteoporosis group; (f).osteopenia and osteoporosis group;