5073
Noise Power Spectrum and Modulation Transfer Function in Deep Learning Based Reconstruction Method
Ryosuke Nasada1, Tatsuhito Yamamoto1, Yoshiyuki Hiramitsu1, Kenji Ugusa1, Kumiko Ando2, and Reiichi Ishikura2
1Radiological Technology, Kobe City Medical Center General Hospital, Kobe, Japan, 2Diagnostic Radiology, Kobe City Medical Center General Hospital, Kobe, Japan
1Radiological Technology, Kobe City Medical Center General Hospital, Kobe, Japan, 2Diagnostic Radiology, Kobe City Medical Center General Hospital, Kobe, Japan
Synopsis
The purpose of this study was to evaluate the effects of Deep Learning (DL) method in MRI using Noise Power Spectrum and Modulation Transfer Function. To evaluate the effect of DL method, we compared the results without DL method and the results with DL method in the NPS and the MTF using phantom MR images. Deep learning Reconstruction method in MRI has the ability to reduce the average NPS value by more than 48.7% in denoising and improve the spatial resolution by 50% at all DL intensities.
Purpose
Deep learning (DL) based reconstruction method in Magnetic resonance imaging (MRI) named of AIRTM Recon DL can improve Signal to Noise Ratio (SNR), improve sharpness, and so reduce truncation artifact simultaneously. However, it has not revealed how AIRTM Recon DL has improve the image quality in frequency domain. The Noise Power Spectrum (NPS) in MRI represents the frequency characteristics of image noise (1), and the Modulation Transfer Function (MTF) in MRI represents quantitative calculations of spatial resolution (2). The purpose of this study was to evaluate the effects of DL method in MRI using NPS and MTF.Methods
We used cylindrical water phantom (120 mm in diameter 270 mm in height, NiSO4 0.014 mol/l, T1/T2:125/102 ms) for NPS analysis. A slit phantom (Polypropylene bowl filled with gelatin, slit: polystyrene resin plate thickness:0.4mm) was made for MTF analysis. A 1.5 T MRI scanner (Explorer, Release Ver.29.1; GE Healthcare, WI, USA) with a head part of Head Neck Spine Array Coil was used for this study. Two-dimensional (2D) Fast Spin Echo (FSE) was performed for each phantom. The acquisition parameters of 2DTSE were as follows: repetition time/echo time (TR/TE) = 3000/95 ms, flip angle =160 degrees, acquisition matrix size = 256 × 256 (with zero-filling interpolation (ZIP): 512), Field of View (FOV) = 140 mm × 140 mm, slice thickness = 4mm, Echo Train Length (ETL) = 16, scan plane = coronal, number of excitations = 1. The reduction factor of parallel imaging (R) was changed in range [1.0, 1.5, 2.0], and reconstructed DL intensities were also converted in range [None, Low, Medium, High]. The NPS measurements were performed as follows: we obtained a subtracted image from two cylindrical water phantom images acquired identical condition. Then we selected the central region (256 × 256) of subtracted image, squared the absolute value of 2D Fourie transform to generate a pre-averaging 2D-NPS, and averaged 5 pre-averaging 2D NPS to calculate a 2D NPS. Finally, the NPS was generated from 2D-NPS averaged along the readout direction (1)(3). The MTF measurements were performed as follows: we obtained a slit phantom image, then cropped the slit image contain the slit, and Line Spread Function (LSF) was obtained from a reversed profile curve of the slit. The LSF curve was normalized, zeroed, and then Fourie transformed to obtain the MTF. The 10% MTF was calculated from the MTF curve (2)(4). The NPS and the MTF were calculated automatically using python software. To evaluate the effect of DL method, we compared the results without DL method and the results with DL method in the NPS and the MTF.Results and Discussion
The noise of the DL-adapted image was clearly lower than that of the non-DL-adapted image (Figure 1). The NPS value were improved uniformly throughout the frequency (Figure 2). The NPS values were improved with DL intensities Low:48.7%, Medium:72.1%, High:91.6%. The 10% MTF values without DL was 1.08 cycles/mm. The 10% MTF values with DL were 1.63 cycles.mm for Low, 1.63 cycles/mm for Medium, 1.64 cycles/mm for High DL intensities, respectively. The spatial resolution was improved by 50% in all DL intensities. From the results of our study, we believed the DL image reconstruction method to be divided into a spatial resolution improvement part and a noise reduction part. The spatial resolution improvement part has a single strength, and the noise reduction part has three different strengths acting on the sharpened image.Conclusion
Deep learning Reconstruction method in MRI has the ability to reduce the average NPS value by [Low:48.7%, Medium:72.1%, High:91.6%] in denoising and improve the spatial resolution by 50% at all DL intensities.Acknowledgements
No acknowledgement found.References
1)Ichinoseki Y, Nagasaka T, Miyamoto K, et al. Noise Power Spectrum in PROPELLER MR Imaging. Magn Reason in Med Sci. 2015;14:235-42 2) Miyati T, Fujita H, Kasuga T, et al. Measurements of MTF and SNR(f) using a subtraction method in MRI. Phys. Med. Biol. 2002;47: 2961–2972 3) Takahashi J, Machida Y, Aoba M, et.al. Noise power spectrum in compressed sensing magnetic resonance imaging. Radiol Phys Technol. 2017;10:161-70 4) Uto T, Yukimura Y, Kouzuki K, et al. Method of Measuring Modulation Transfer Function in Computed Tomography Using Slit Method with Air Gap Phantom. JJRT. 2012;68(3):240-246Figures
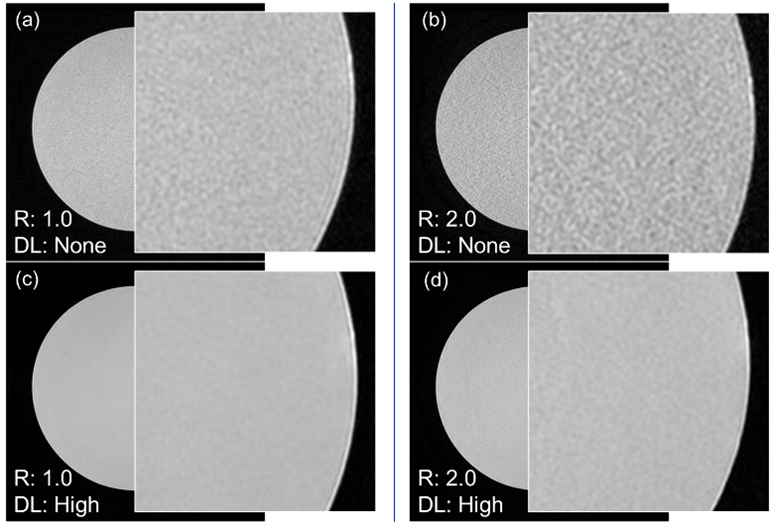
Figure.1 Examples of cylindrical water phantom images.
(a) R:1.0, DL intensities:
None, (b)R:2.0, DL intensities: None, (c) R:1.0, DL intensities: High,
(d)R:2.0, DL intensities: High.
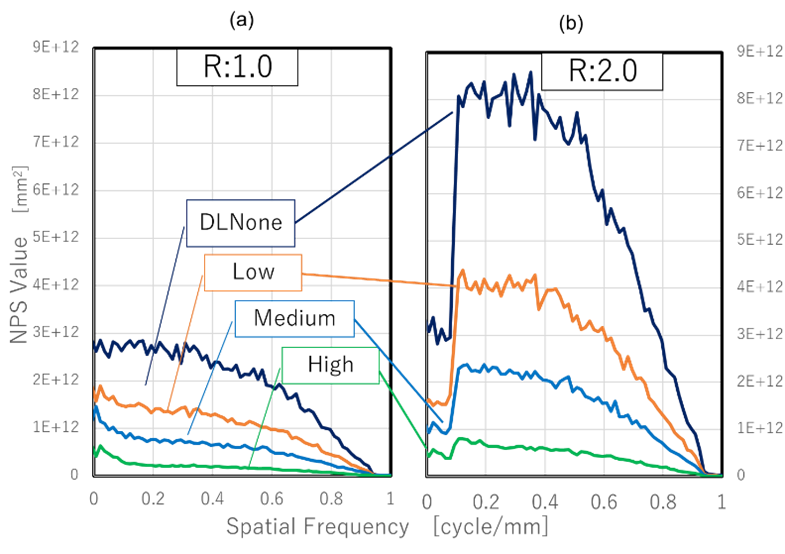
Figure.2 NPS graphs obtained with various DL intensities at (a) R:1.0
and (b) R:2.0.
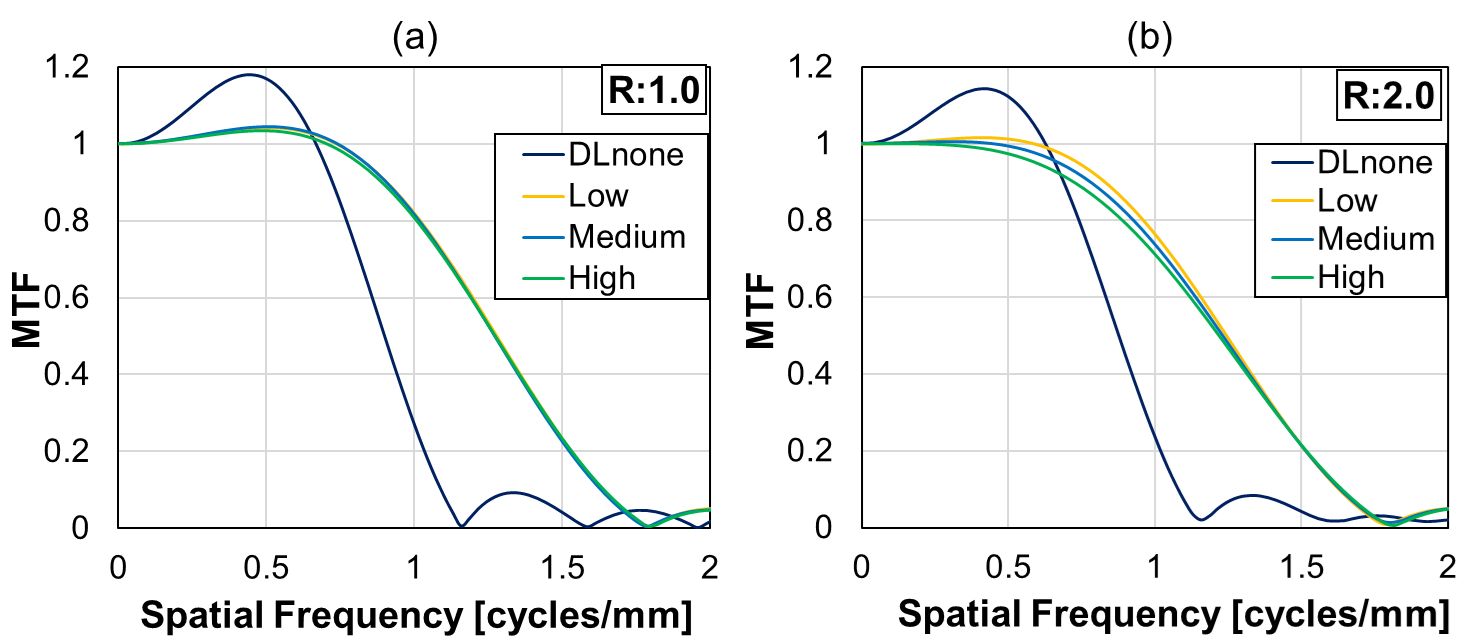
Figure3. MTF graphs obtained with various DL intensities at (a) R:1.0
and (b) R:2.0.
DOI: https://doi.org/10.58530/2022/5073