5055
Chemical Shift Proton Density Fat Fraction Imaging: End-user perspectives on liver fat assessment
Jennifer D Wagner1, Chikara Noda2, Jason Ortman2, Yoshimori Kassai3, Joao Lima2, and Chia Liu1
1Canon Medical Research USA, Mayfield Village, OH, United States, 2Cardiology, Johns Hopkins University, Baltimore, MD, United States, 3Canon Medical Systems Corporation, Tochigi, Japan
1Canon Medical Research USA, Mayfield Village, OH, United States, 2Cardiology, Johns Hopkins University, Baltimore, MD, United States, 3Canon Medical Systems Corporation, Tochigi, Japan
Synopsis
CS-PDFF is an indispensable method of assessing steatosis. However, each site must make informed decisions when selecting assessment methodology, as both ROI style and location can impact measurements. This abstract discusses how well ROIs of various styles characterize average PDFF and, additionally, how each ROI style tolerates the influence of various confounding factors (e.g.: artifacts and elevated noise). We also explore potential contributing factors to localized variations in hepatic PDFF, as well as their relative importance. Finally, select normative values from our cohort are reported, with a focus on observed differences as related to ROI placement and size.
Background
Chemical-shift-based proton density fat fraction (CS-PDFF) maps have become a staple for evaluation of liver fat content given their ability to survey the entire organ, thus allowing for not only characterization of overall fat content, but also the recognition of any localized increases in fat fraction. However, along with these benefits, CS-PDFF also presents challenges related to how to optimize ROI-based assessments. This article summarizes the considerations that our facility faced when performing PDFF assessments while using a 3D Gradient Echo Fat-Fraction Quantification technique. Data was acquired on a 3T Canon Vantage Galan MR system (Canon Medical Systems, Japan) and collected from a cohort of 51 subjects who were free from liver disease or complications (26 men, age 47±14 years, BMI 27±6 kg/m2) .Teaching Points
ROI styleCommon approaches when measuring PDFF include drawing ROIs of small area (~2cm2), large area (~4cm2), and best fit per Couinaud segment, as well tracing the footprint of the entire liver or target lobe (“contour”). The topic of optimal ROI size as it relates to accuracy, reproducibility, and workflow is still being examined in our community 1,2. In our local cohort, there was minimal difference when comparing measurements from multiple small or large ROIs (Figure 1), assuming that these ROIs were placed by the same skilled reviewer and in similar hepatic segments.
However, optimal ROI style must take into consideration staff experience and ability to avoid confounding factors such as:
- Replication
- Unfolding errors
- Partial volume averaging
- Noise
Note that Water-fat “swaps”, while not listed among the above factors, will completely invalidate (i.e.: not simply “invert”) measurements due to failed modeling of the lipid peak. As such, measurement of swapped tissue must be avoided at all costs. Luckily, swaps in the liver are rare and were unobserved in our cohort.
Impact of ROI location
Measurements from the most caudal and cranial sections of the liver may overestimate PDFF1,2. It has been suggested that this is a result of partial volume averaging2 or inadequate shimming (especially in the dome, which neighbors the lung-fields)1. However, when we assessed the dome on a volunteer after no shimming, bad shimming, and optimal shimming, no significant difference was seen in resulting PDFF (Figure 3). Of additional note, while elevated PDFF in cranial slices was substantiated by our local cohort, there was <1% difference when compared with measurements from the right lobe (Figure 3).
Documented differences between the right (RLL) and left liver lobes (LLL) 3, 4 were also supported by analysis of our cohort (Figure 4). We hypothesized that these differences might be exaggerated due to intra-voxel dephasing caused by cardiac motion or dielectric effect. To test the first hypothesis, we compared LLL measurements between inspiration and expiration, but found that the additional space that inspiration places between heart and liver did not lead to increased PDFF values (Figure 4). In a second experiment, we compared PDFF measurements acquired in both supine and decubitus positions. Since dielectric effect manifests based on tissue geometry, we expected to see variations in measurements if this phenomenon were in effect; surprisingly, average measurements from the decubitus position did increase, suggesting that the impact of dielectric effect on LLL measurements should be further explored.
Capturing Heterogeneity
Hepatic steatosis is typically diffuse in nature, but heterogenous manifestations are not uncommon4, with an incidence of approximately 14% noted in our cohort (Figure 5). These cases present a challenge, as ROIs that are carelessly placed, or too few in number, may underestimate maximum PDFF. Since disease modeling has shown that heterogenic manifestations of steatosis correlate with progression to severe NAFLD5, recognizing patterns of spatially elevated fat content may be critical in reversing early-stage disease. Additionally, heterogeneity is important during longitudinal assessment, in which alterations of PDFF are often noted in some segments but not others6.
Heterogeneity is not always obvious to all staff on standard output images and preliminary experiments at our facility showed that higher PDFF values were captured when referencing color maps (Figure 5). This is in-line with color-map experiments applied to standard signal intensity techniques in the past7.
Conclusion
CS-PDFF is an indispensable method of assessing steatosis. However, each site must make informed decisions regarding how to characterize PDFF within their clinical population. Taken out of context, measurements targeted to certain areas of the liver may misestimate average PDFF. Confounding factors can also impact measurements, especially with small ROIs.Experiments at our facility suggest an ROI ≥ 4cm2 placed near the center of the RLL is useful for characterizing average hepatic PDFF, without excessive influence from confounding factors, and without introducing measurements from regions prone to aberrant values. ROI’s of ~13cm2 were specifically closest to known mean and had the lowest standard deviation. If characterization of maximum PDFF is considered important, referencing color maps may provide additional utility.
Acknowledgements
The authors would like to acknowledge Yurian Falls, CMSC, for his invaluable help with the figures in this abstract.References
- Campo, C. A., Hernando, D., Schubert, T., Bookwalter, C. A., Pay, A., & Reeder, S. B. (2017). Standardized Approach for ROI-Based Measurements of Proton Density Fat Fraction and R2* in the Liver. AJR. American journal of roentgenology, 209(3), 592–603. https://doi.org/10.2214/AJR.17.1781
- Procter, A. J., Sun, J. Y., Malcolm, P. N., & Toms, A. P. (2019). Measuring liver fat fraction with complex-based chemical shift MRI: the effect of simplified sampling protocols on accuracy. BMC medical imaging, 19(1), 14. https://doi.org/10.1186/s12880-019-0311-y
- Idilman, I. S., Tuzun, A., Savas, B., Elhan, A. H., Celik, A., Idilman, R., & Karcaaltincaba, M. (2015). Quantification of liver, pancreas, kidney, and vertebral body MRI-PDFF in non-alcoholic fatty liver disease. Abdominal imaging, 40(6), 1512–1519. https://doi.org/10.1007/s00261-015-0385-0
- Okka W. Hamer, Diego A. Aguirre, Giovanna Casola, Joel E. Lavine, Matthias Woenckhaus, and Claude B. Sirlin (2006) Fatty Liver: Imaging Patterns and Pitfalls. RadioGraphics 26:6, 1637-1653
- Holzhütter, H. G., & Berndt, N. (2021). Computational Hypothesis: How Intra-Hepatic Functional Heterogeneity May Influence the Cascading Progression of Free Fatty Acid-Induced Non-Alcoholic Fatty Liver Disease (NAFLD). Cells, 10(3), 578. https://doi.org/10.3390/cells10030578
- Syväri, J., Junker, D., Patzelt, L., Kappo, K., Al Sadat, L., Erfanian, S., Makowski, M. R., Hauner, H., & Karampinos, D. C. (2021). Longitudinal changes on liver proton density fat fraction differ between liver segments. Quantitative imaging in medicine and surgery, 11(5), 1701–1709. https://doi.org/10.21037/qims-20-873
- Qayyum, A., Nystrom, M., Noworolski, S. M., Chu, P., Mohanty, A., & Merriman, R. (2012). MRI steatosis grading: development and initial validation of a color mapping system. AJR. American journal of roentgenology, 198(3), 582–588. https://doi.org/10.2214/AJR.11.6729
Figures
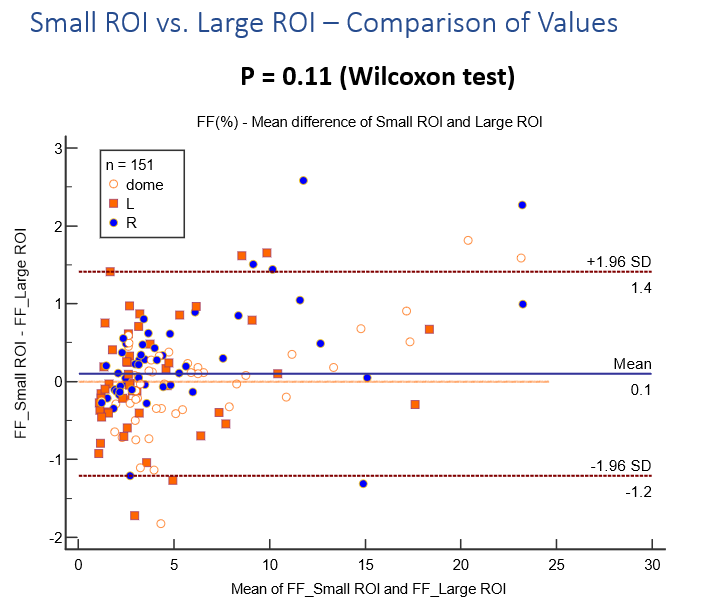
After assessing PDFF with a combination of small and large ROIs in a cohort of 51 subjects, the mean
difference of the available 151 measurements was shown to be insignificant. Note that not all locations could be measured on two of the subjects due to slice cut off and/or artifact.
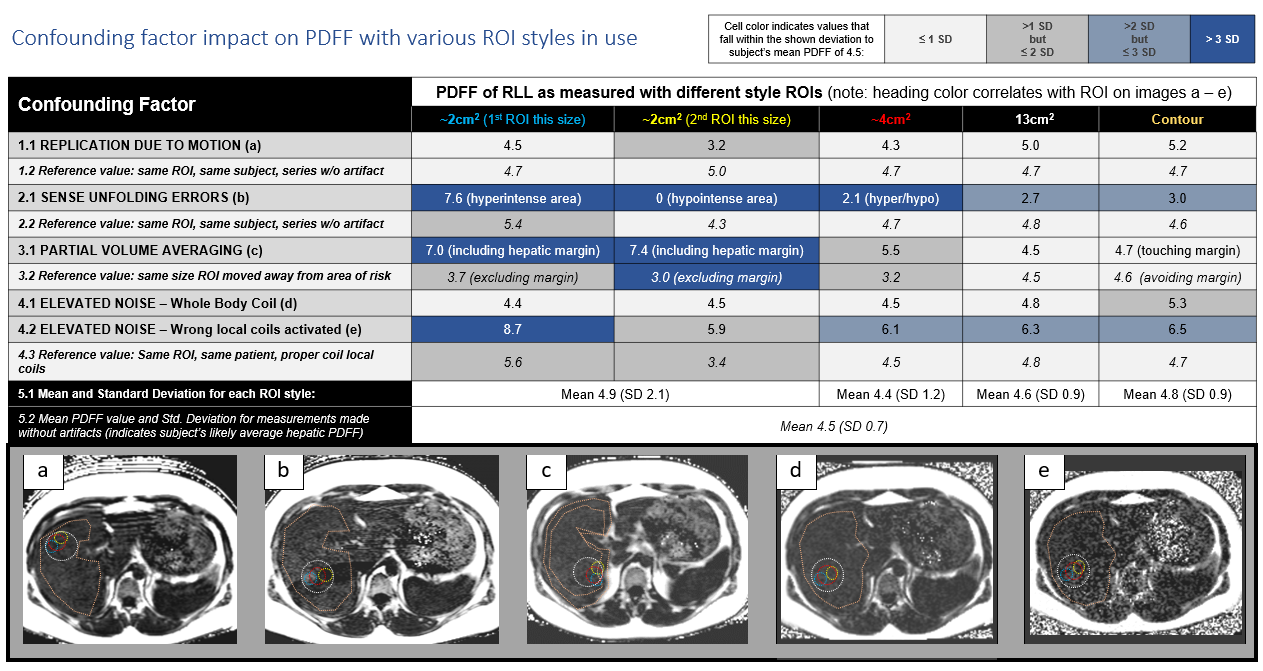
Table:
Overview
of impact of different confounding factors when sampled by various ROI sizes in
comparison to similar ROIs taken from artifact-free imaging on same subject.
Cells are color-coded to demonstrate how closely each
value approximates the mean PDFF value taken from
artifact-free imaging on the same subject.
Images: Images demonstrating the appearance of the various confounding factors as delineated by the table. Actual ROI location from each measurement on the chart above is also indicated on each image.
Images: Images demonstrating the appearance of the various confounding factors as delineated by the table. Actual ROI location from each measurement on the chart above is also indicated on each image.
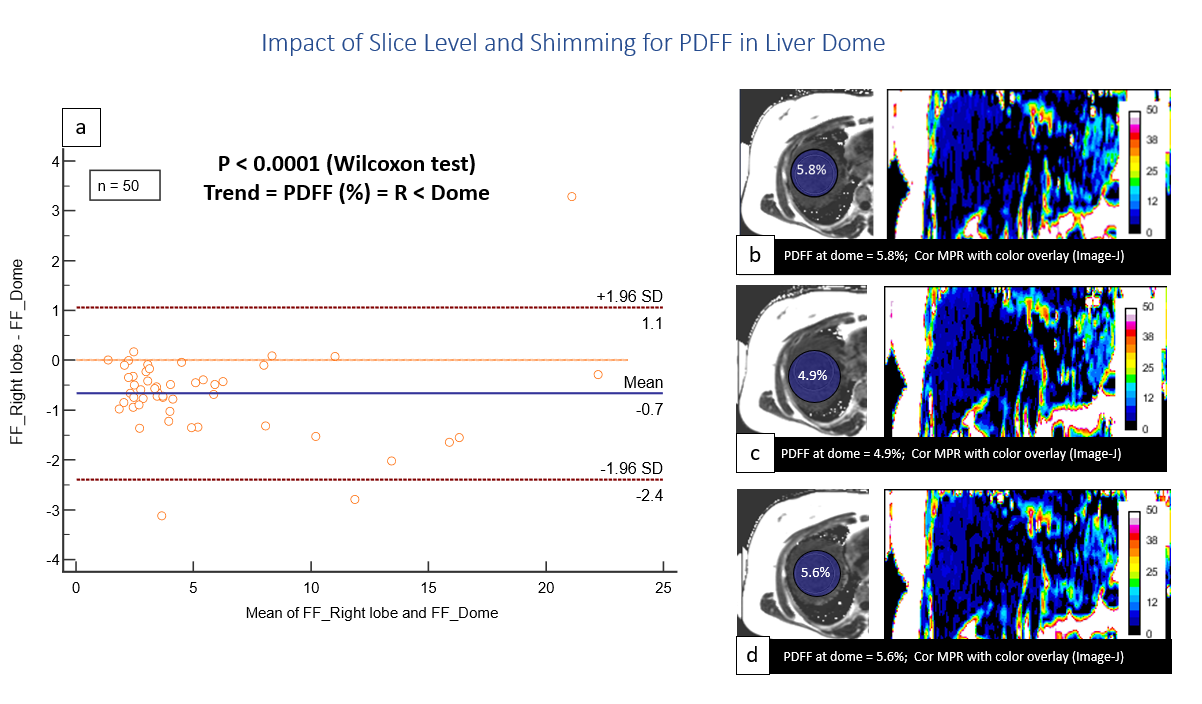
(a) Comparison of PDFF values from liver dome
versus right lobe in clinical cohort shows statistically
significant, though arguably clinically irrelevant, elevation of PDFF
measurements obtained from the top three slices of the liver.
Comparison of PDFF values and color maps obtained on a volunteer without patient specific shimming (b), with poor local shimming (c), and with optimized local shimming (d) shows minimal difference and no logical trend, suggesting that shim optimization is not effective for counteracting the elevated measurements in this specific region of the organ.
Comparison of PDFF values and color maps obtained on a volunteer without patient specific shimming (b), with poor local shimming (c), and with optimized local shimming (d) shows minimal difference and no logical trend, suggesting that shim optimization is not effective for counteracting the elevated measurements in this specific region of the organ.
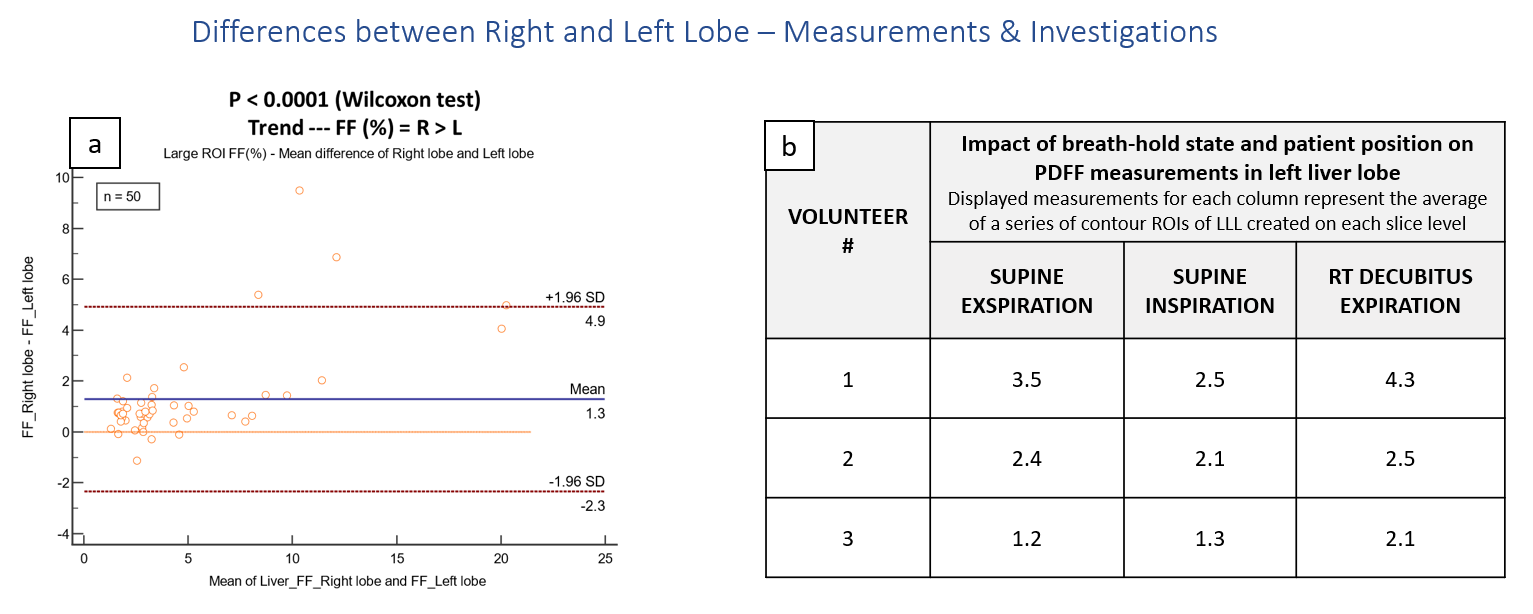
(a) Comparison of PDFF from clinical cohort substantiates the recognized trend of PDFF measurements that are elevated in
the RLL in comparison to LLL.
(b) Overview of PDFF measurements of the LLL obtained on volunteers with three separate scan conditions (i.e.: Columns 1, 2, & 3). Note that since direct comparison between focal ROIs was hindered given the variation in organ geometry that resulted from each experiment, a contour ROI of each slice level of the entire left lobe was created.
(b) Overview of PDFF measurements of the LLL obtained on volunteers with three separate scan conditions (i.e.: Columns 1, 2, & 3). Note that since direct comparison between focal ROIs was hindered given the variation in organ geometry that resulted from each experiment, a contour ROI of each slice level of the entire left lobe was created.
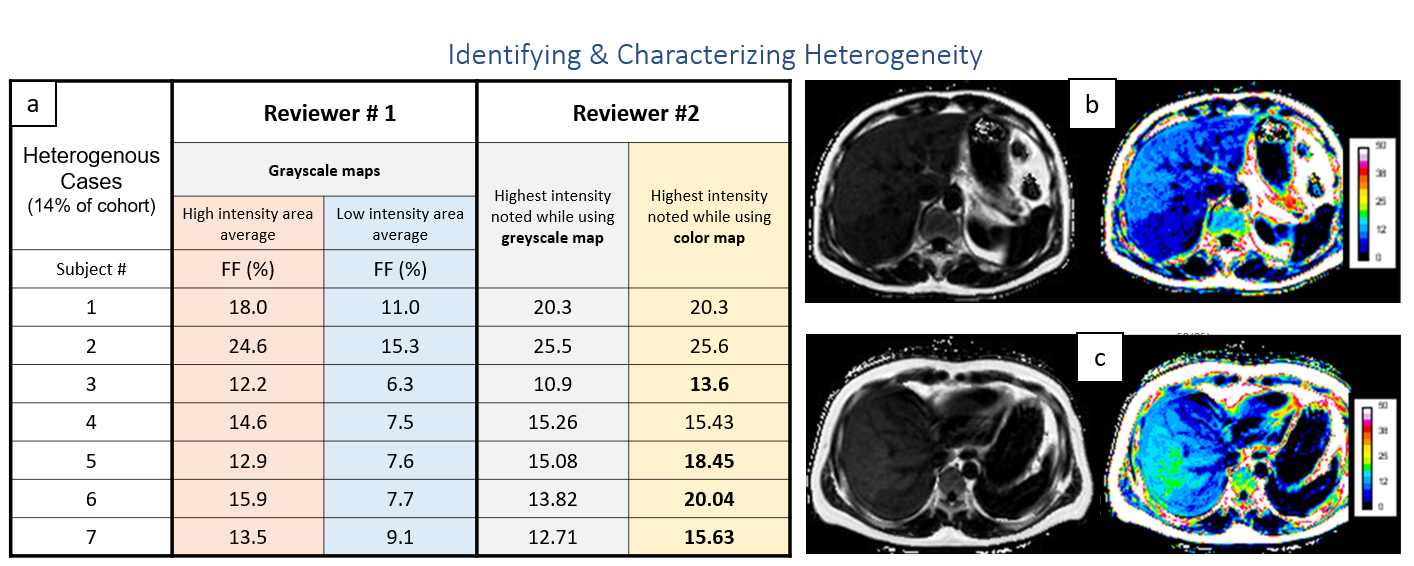
(a) Comparison of high and low PDFF
values, as identified by Reviewer #1, when utilizing several small ROIs to target areas of highest and lowest
intensity as perceived on grayscale images versus the maximum PDFF values obtained by
a second reviewer who used color maps to target maximum PDFF with a
single, small ROI.
(b & c) Example images from heterogenous cohort with default WW/WL on the grayscale image compared to standard color map (map created by Image-J). When referencing the color maps, the increased conspicuity of high PDFF concentrations is striking.
(b & c) Example images from heterogenous cohort with default WW/WL on the grayscale image compared to standard color map (map created by Image-J). When referencing the color maps, the increased conspicuity of high PDFF concentrations is striking.
DOI: https://doi.org/10.58530/2022/5055