5068
Influence of arm position on proton density fat fraction in vertebral bone marrow using chemical shift-encoded magnetic resonance imaging
Tatsuya Hayashi1, Shimpei Yano2, Shuhei Shibukawa3, Toshimune Ito1, and Shinya Kojima1
1Graduate School of Medical Technology, Teikyo University, Tokyo, Japan, 2Central of Radiology, Teikyo University Hospital, Tokyo, Japan, 3Department of Radiological Technology, Juntendo University, Tokyo, Japan
1Graduate School of Medical Technology, Teikyo University, Tokyo, Japan, 2Central of Radiology, Teikyo University Hospital, Tokyo, Japan, 3Department of Radiological Technology, Juntendo University, Tokyo, Japan
Synopsis
Reports have shown radio frequency magnetic field (B1) inhomogeneity during spine imaging. Proton density fat fraction (PDFF) measurement using chemical shift-encoded magnetic resonance imaging has been performed using a low flip angle to avoid T1 bias. However, differences in arm positions during MRI can cause changes in B1 heterogeneity. This study evaluated the influence of arm position (side and elevated arm positions) on the PDFF obtained from the lumbar spine, where B1 heterogeneity tends to occur. The PDFF was slightly but significantly higher in the elevated arm position than in the side arm position.
Introduction
Chemical shift-encoded magnetic resonance imaging (CSE-MRI) is a useful method for evaluating proton density fat fraction (PDFF) across various organs, such as the liver and vertebral bone. This method utilizes a low-flip angle to minimize T1 bias (i.e., differences in T1 values between water and fat), which affects the PDFF. Different arm positions during MRI scan can significantly affect the radio frequency magnetic field (B1) distribution, which caused variability in the flip angle and PDFF.1 Although simply changing the arm position during spine imaging can improve B1 heterogeneity,2 its effects on the PDFF of vertebral bone marrow are yet to be determined; therefore, this study sought to evaluate the influence of arm position on the PDFF in vertebral bone marrow using CSE-MRI.Methods
This study was approved by the Institutional Review Board, and written informed consent was obtained from all study participants. All scans were performed using a 3-T MRI scanner (Skyra; Siemens Healthcare, Erlangen, Germany). This study enrolled 15 volunteers (12 men and 3 women; average age, 39.6 years [22–58 years]) who underwent lumbar spine scan using CSE-MRI with different arm positions (elevated and side arm positions). Scans were performed twice in each position (Fig. 1). The scan parameters were as follows: TR, 9.0 ms; first TE and delta TE, 1.18 ms; number of echoes, 6; flip angle, 4 degrees; field of view, 300 mm × 300 mm; matrix, 160 × 160; slice thickness 4 mm; parallel imaging, CAIPIRINHA; parallel imaging factor, 2 × 2; and scan time, 22 s. Participants were instructed to hold their breath with each inhalation for each scan. Regions of interest were established on each lumbar vertebra (L1–L5) in the central slice of the PDFF map. To determine whether the variability in the observed PDFF was due to arm position, the variability of the CSE-MRI sequence itself needed to be evaluated; thus, the PDFFs of two consecutive scans in each arm position were initially compared to evaluate the within-examination variability using the Bland–Altman plot and Wilcoxon test. Thereafter, the PDFFs in the side arm and elevated arm positions were also compared. A P value of ≤ 0.05 indicated statistical significance.Results and Discussion
Variability in the PDFF between two sequential scans in different arm positions is shown in the Bland–Altman plot (Fig. 2). The mean difference was 0.07% (95% confidence interval: −0.09%–0.22%), whereas the limit of agreement (the mean difference ± 1.96 standard deviations) was −1.85%–1.99%. PDFFs at all lumbar vertebrae (L1–L5) did not significantly differ between scans (all P > 0.05) (Table 1). The Bland–Altman plots that compared the PDFF between different arm positions are shown in Fig. 3. The mean difference was 0.77% (95% confidence interval: 0.50%–1.04%), whereas the limit of agreement was −1.50%–3.05%. PDFFs at all lumbar vertebrae (L1–L5) were slightly but significantly larger in the elevated arm position than in the side arm position (all P < 0.05) (Table 2). The aforementioned results suggested that PDFF variability between different arm positions exceeds the variability of the PDFF sequence itself within two consecutive scans.Conclusion
Although arm position significantly affects the PDFF in vertebral marrow during MRI, the change was exceptionally small. This suggests that PDFF measurements using CSE-MRI in the lumbar spine are not affected by clinically problematic PDFF variability caused by B1 heterogeneity with different arm positions.Acknowledgements
No acknowledgement found.References
1. Watanabe S, et al. Magn Reson Imaging. 2021;83:133-138.
2. Ishizaka K, et al. J Magn Reson Imaging. 2018;47:123-130.
Figures
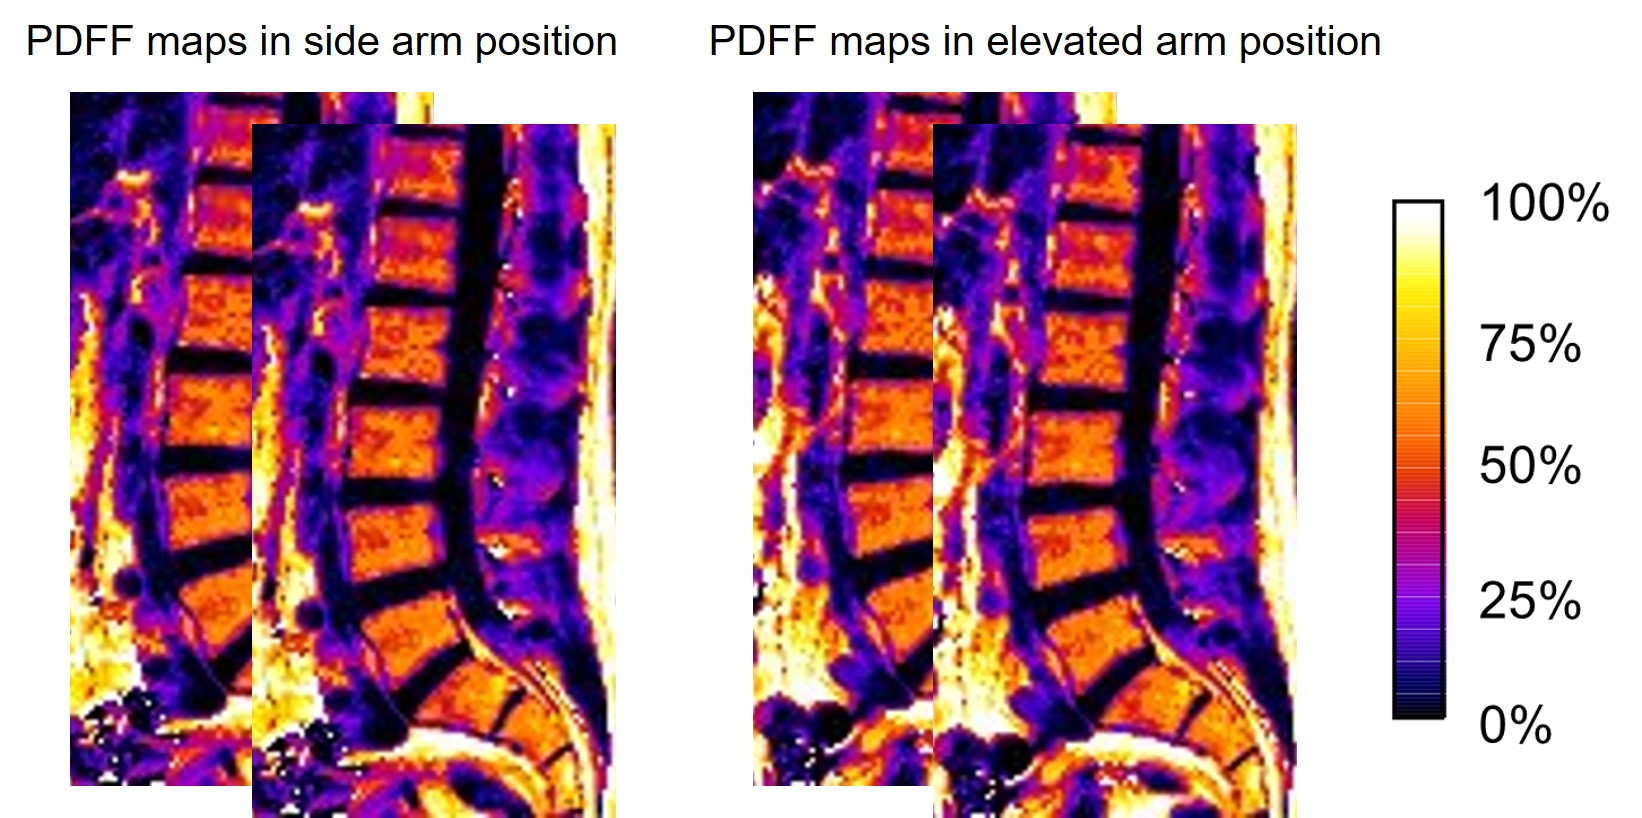
Fig.
1. Proton density fat fraction maps acquired from different
arm
positions
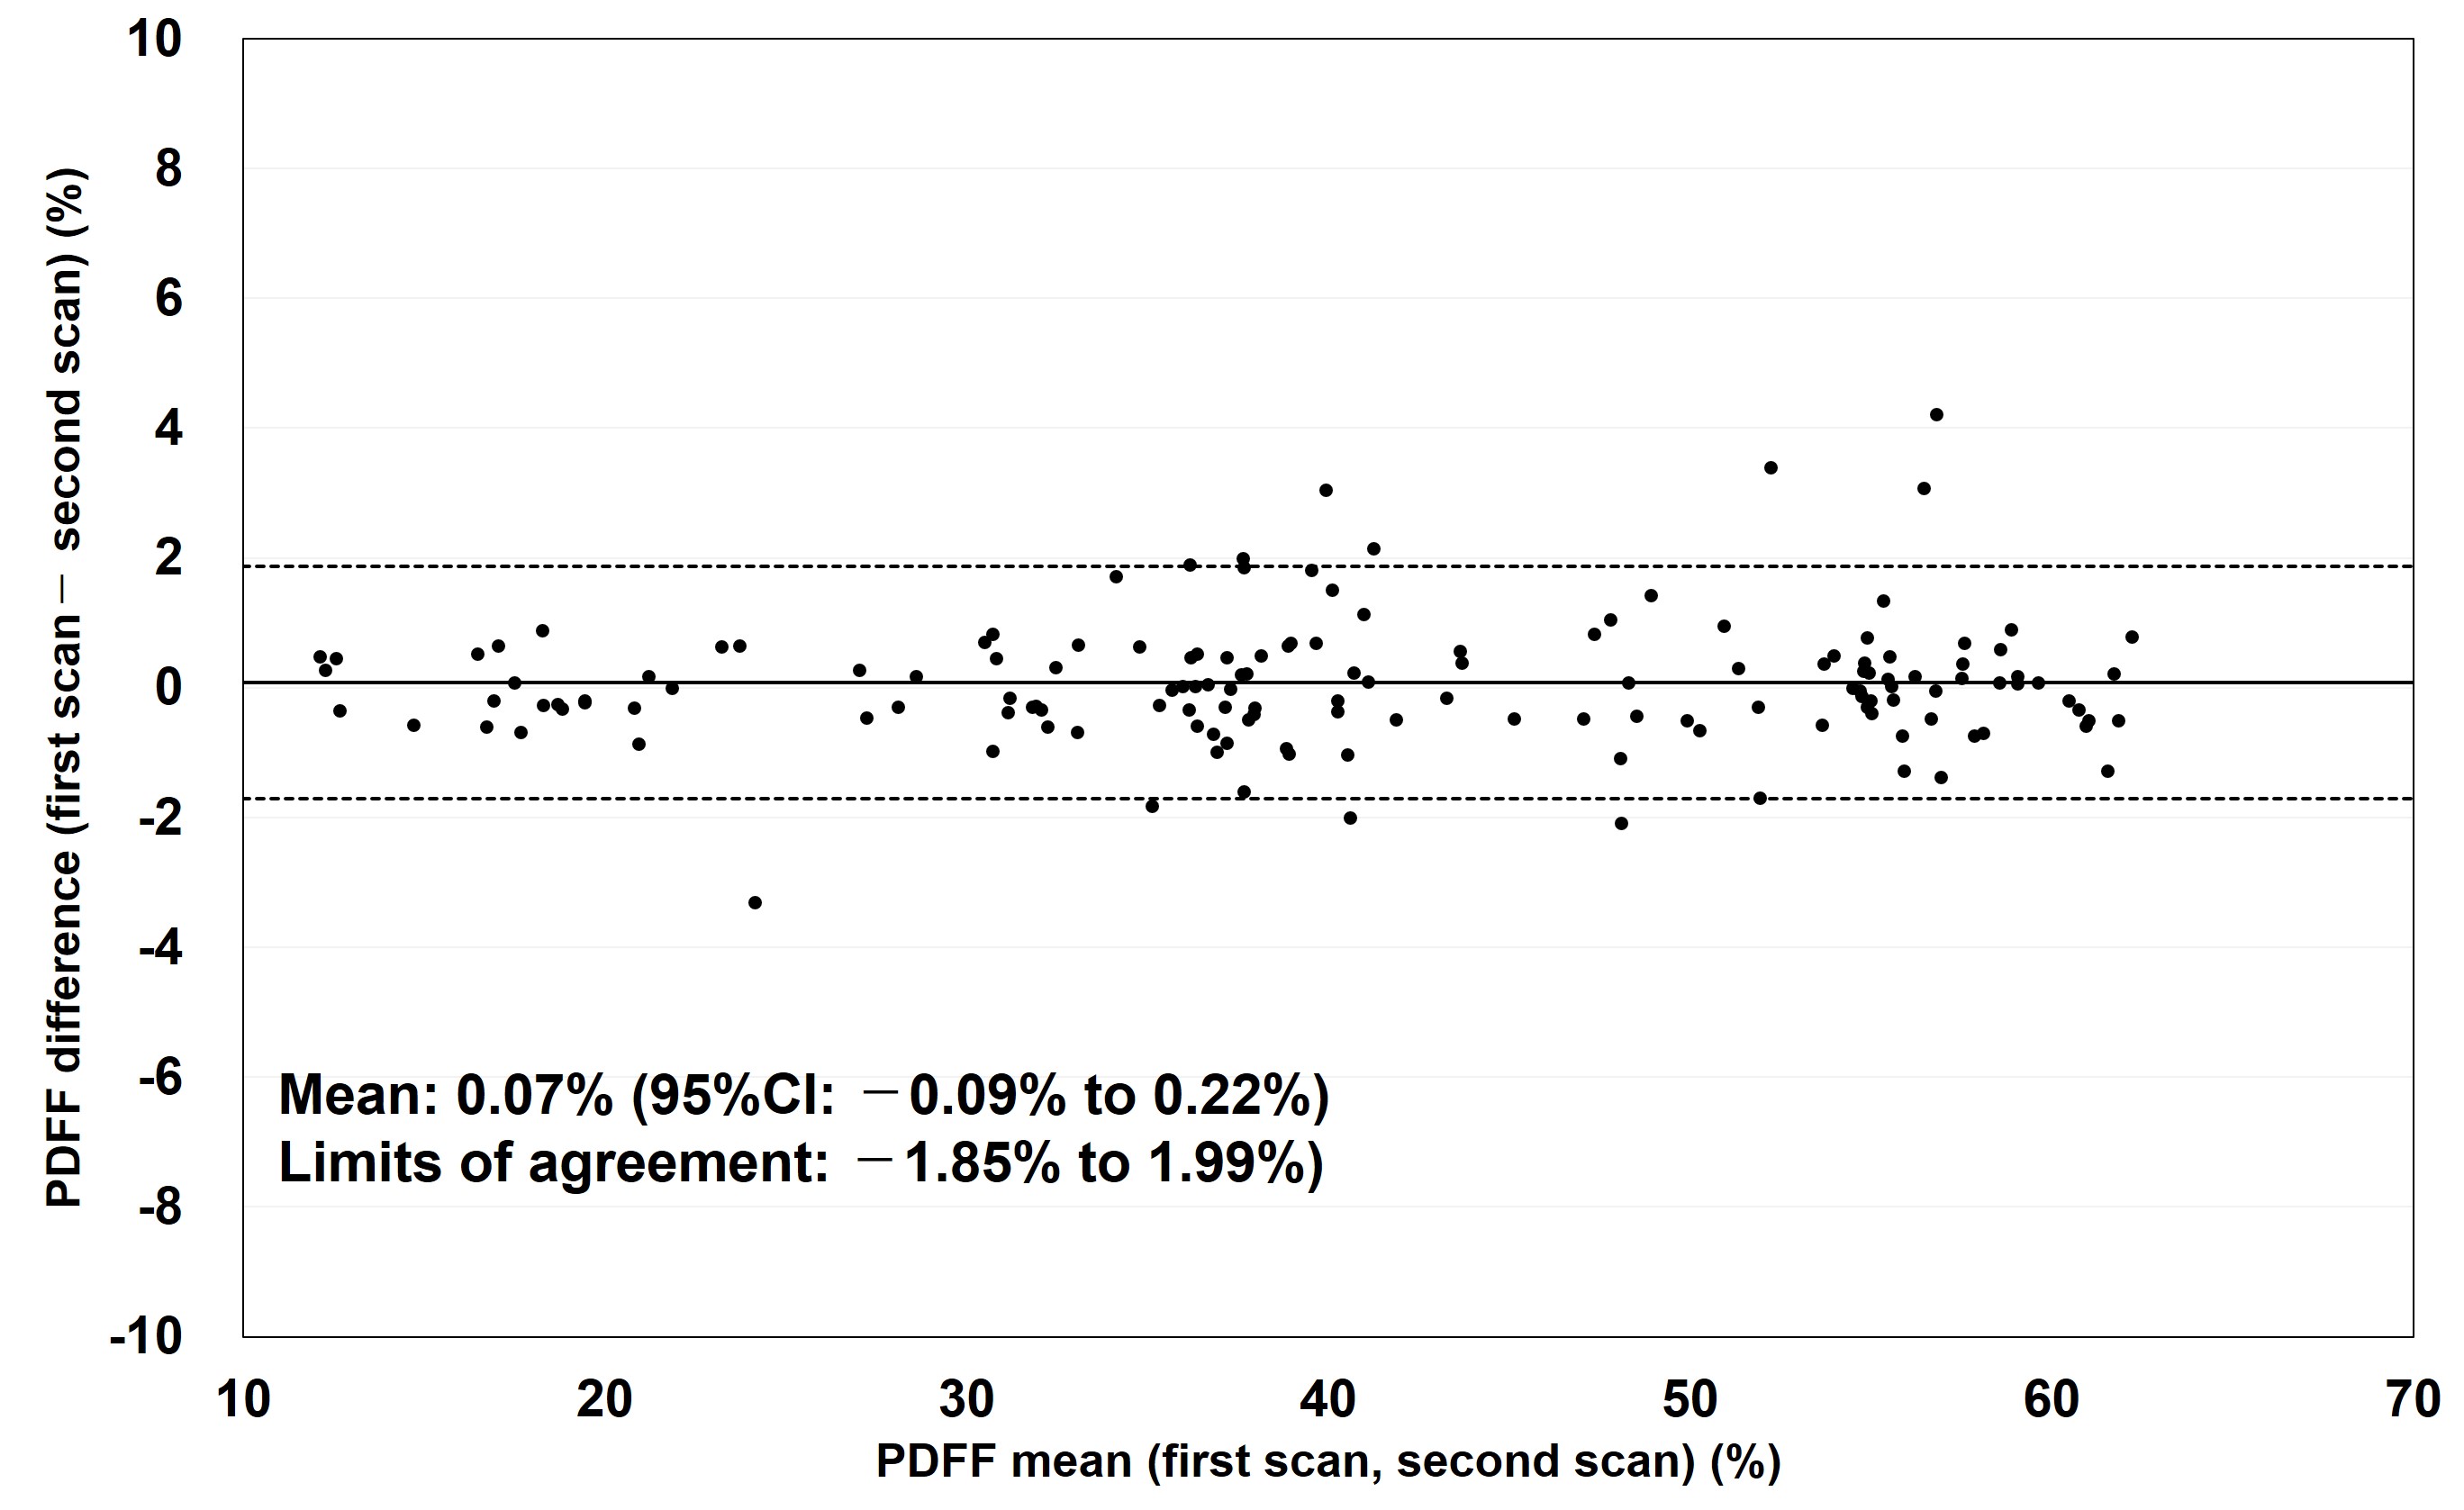
Fig.
2. Comparison of Bland–Altman plots of proton density fat fraction between the first
and second scans. Solid lines represent the mean difference, whereas dotted
lines represent 1.96 × the standard deviation (limits of agreement)
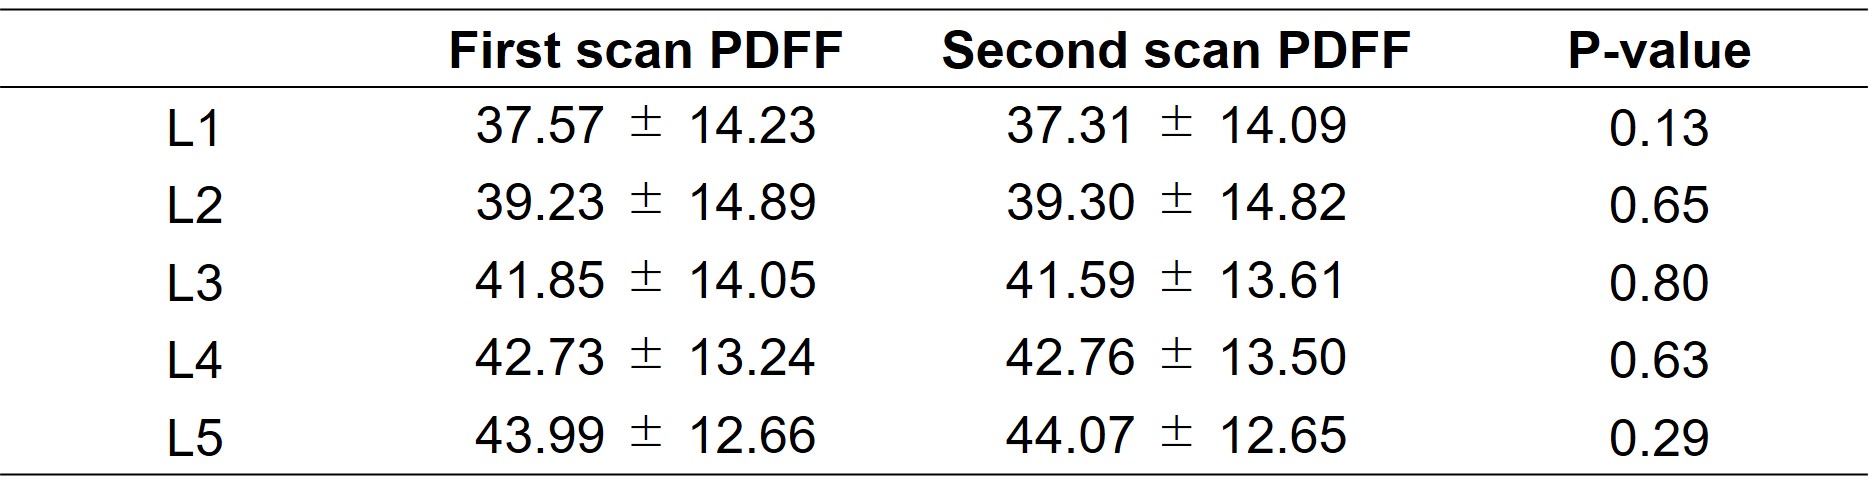
Table 1. Comparison
of proton density fat fraction of each vertebra (L1–L5) obtained from first and
second scans
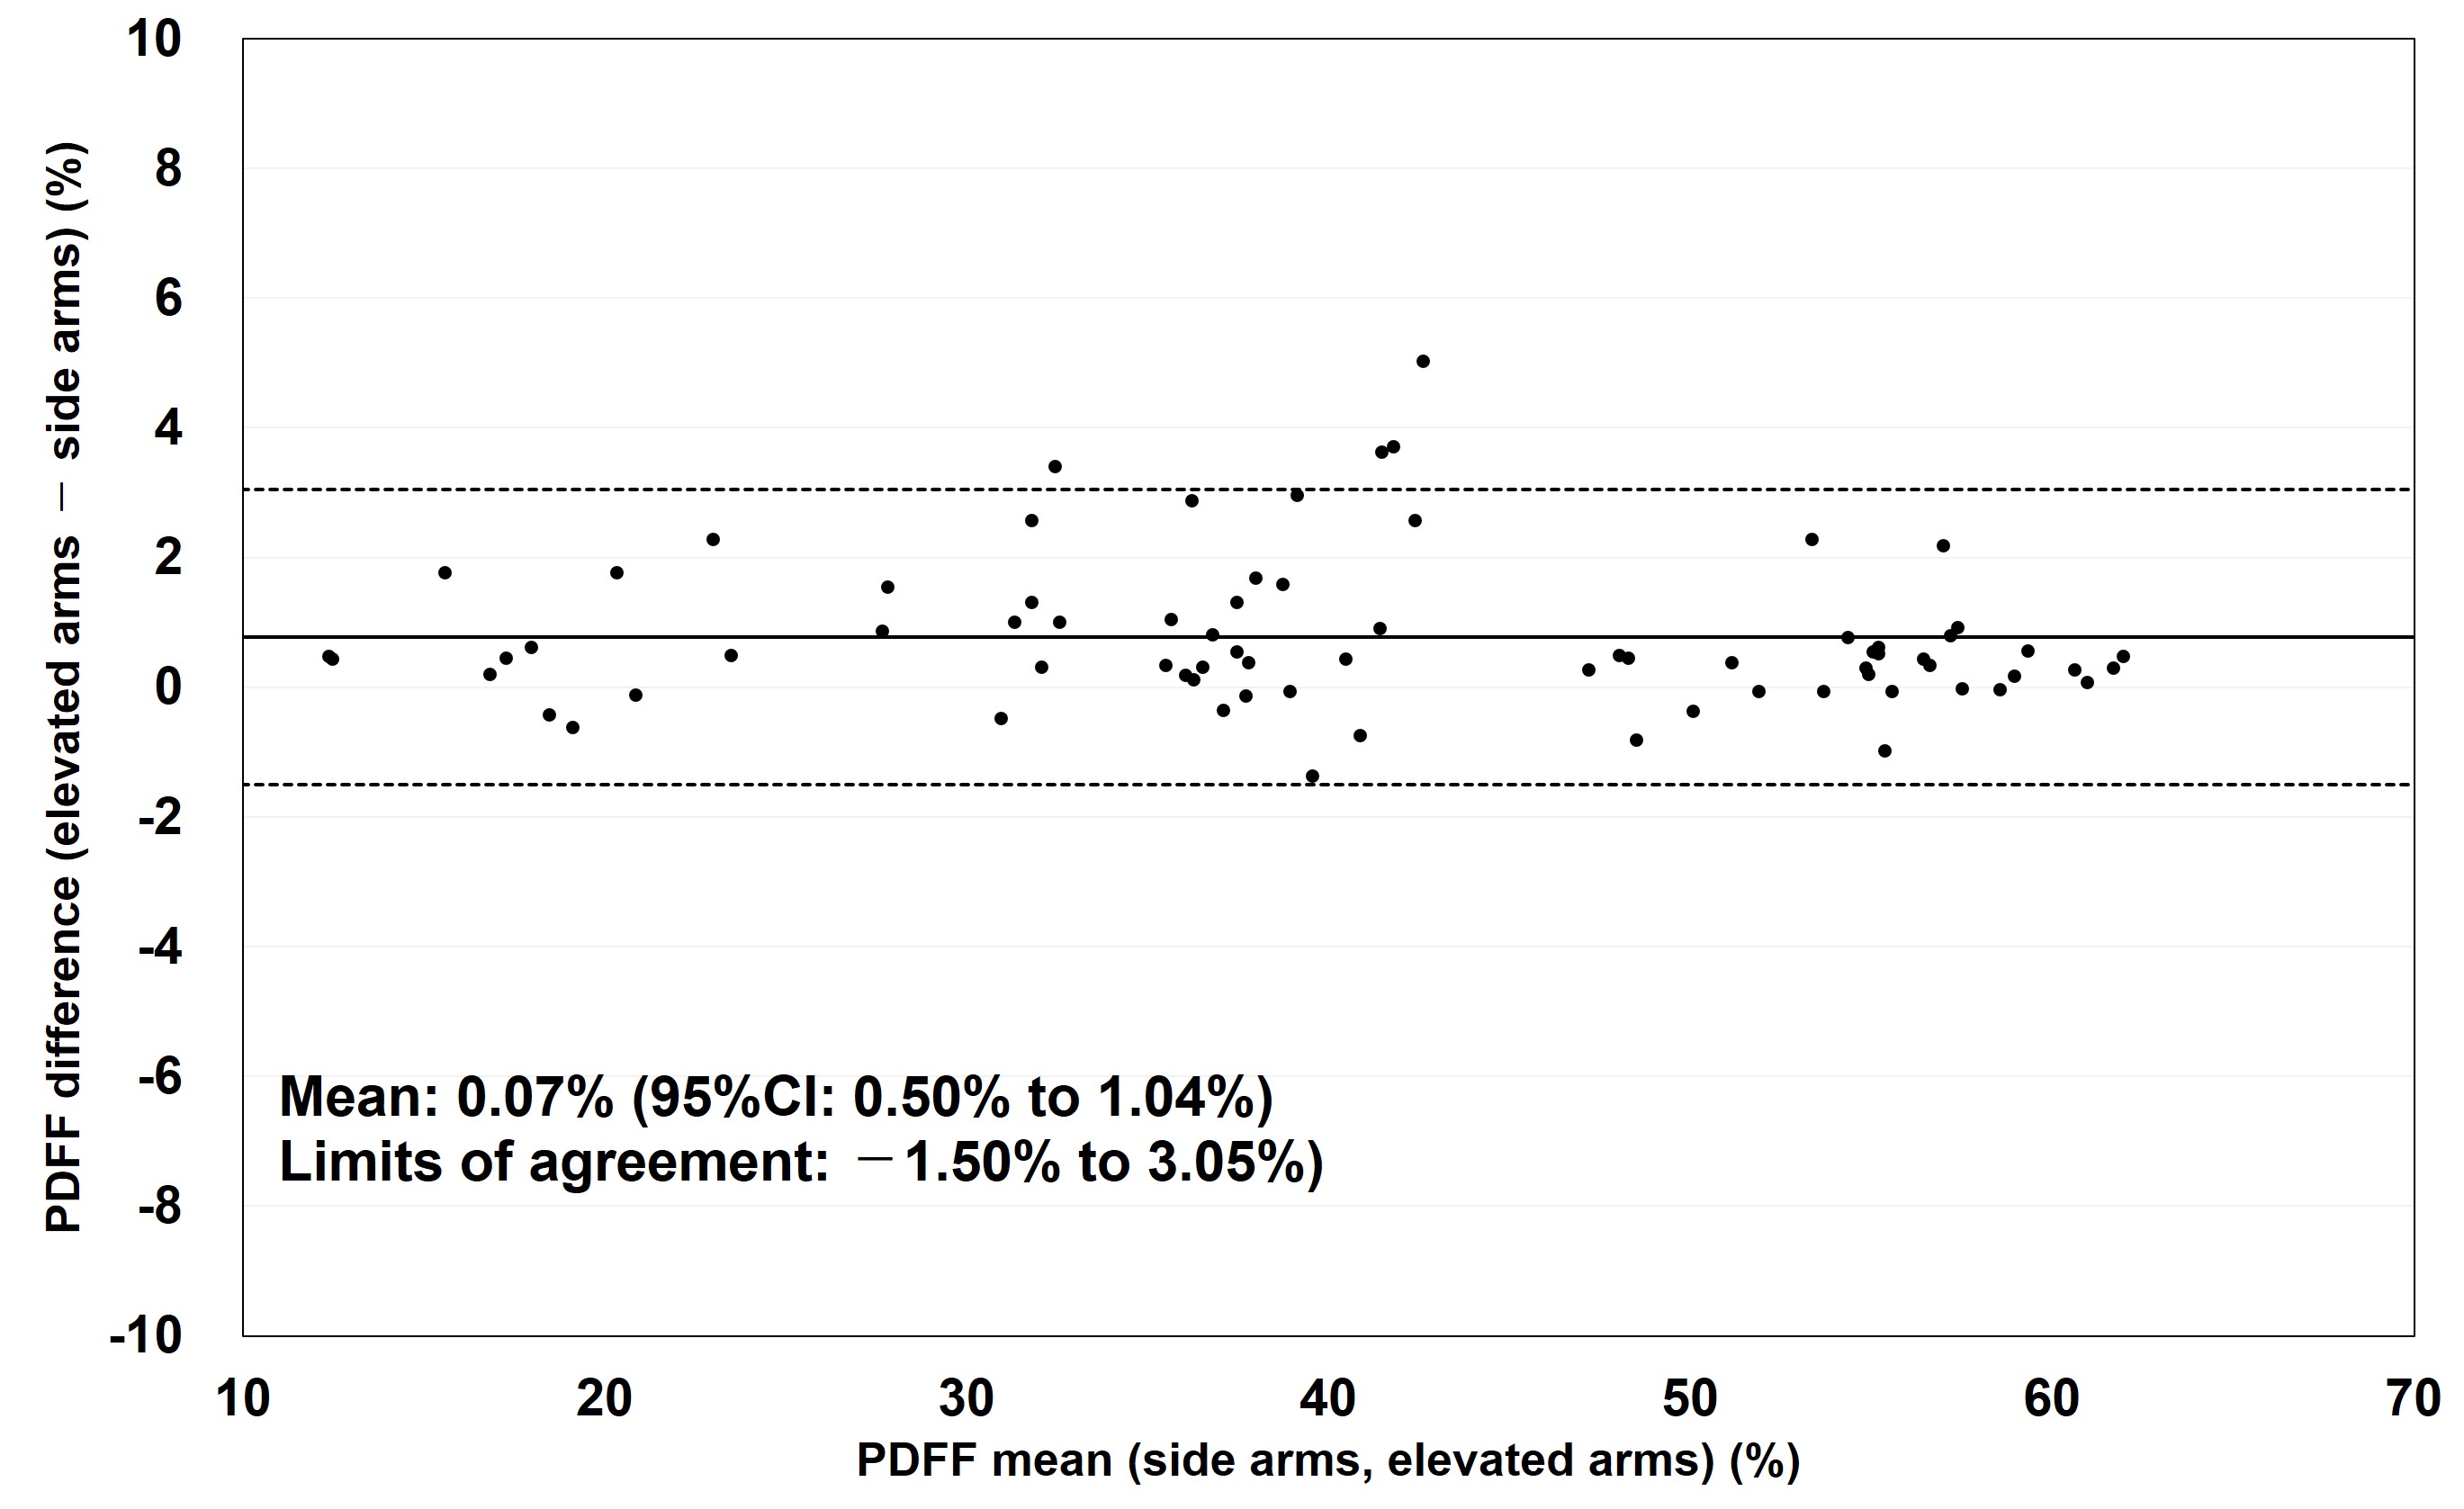
Fig.
3. Bland–Altman plots of proton density fat fraction between the side and elevated
arm position. Solid lines represent the mean difference, whereas dotted lines
represent 1.96 × the standard deviation (limits of agreement)
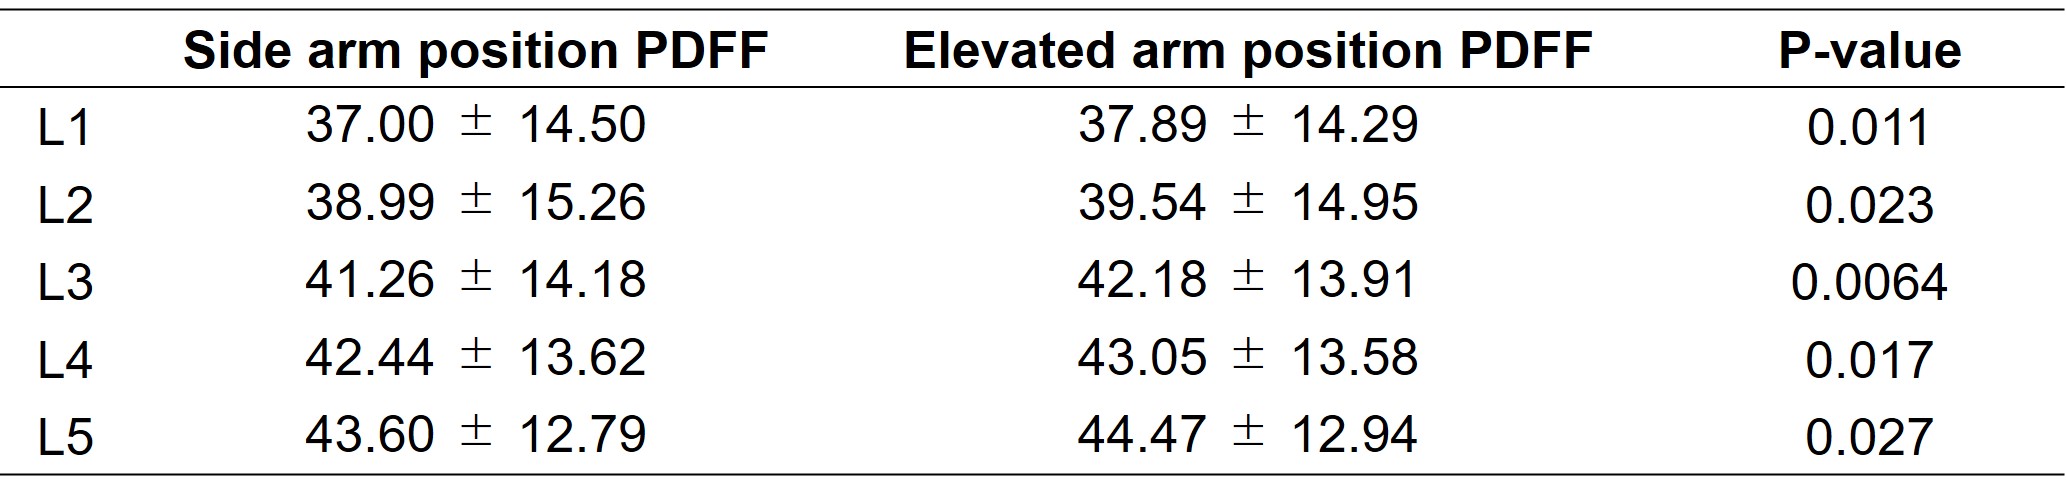
able 2. Comparison
of proton density fat fraction of each vertebra (L1–L5) between the side and elevated
arm positions
DOI: https://doi.org/10.58530/2022/5068