UTE/ZTE for Musculoskeletal Imaging: Technical Considerations
1University of California, San Diego, United States
Synopsis
This lecture talks about technical considerations in ultrashort echo time (UTE) and zero echo time (ZTE) magnetic resonance imaging of short T2 tissues in the musculoskeletal (MSK) system. Technical considerations, challenges, and potential solutions in morphological and quantitative imaging of short T2 tissues or tissue components in the MSK system are discussed in detail.
Introduction
The musculoskeletal system has many connective tissues which have short or ultrashort T2/T2* relaxation times, such as the menisci, ligaments, tendons, bone, and osteochondral junction (1-11). The capability of direct ultrashort echo time (UTE) or zero echo time (ZTE) imaging of these short-T2 tissues may significantly change the way in which musculoskeletal diseases such as osteoarthritis (OA), osteoporosis (OP), and spine degeneration are diagnosed. For example, OA has been historically considered a disease of cartilage, now a shift to a “whole joint organ” disease (12-14). This includes damage to menisci, ligaments, tendons, subchondral bone-cartilage interface (or osteochondral junction, OCJ), and subchondral bone, any of which can have effects on both the initiation and the progression of cartilage damage. When one tissue begins to deteriorate, it is likely to affect the structural integrity of other tissues and contribute to the failure of the joint as a whole. The same rationale applies to spine degeneration and back pain. There are multiple sources of back pain, which can be caused by degeneration or injury in the many different components of the spine, including the intervertebral discs (IVD) (e.g., peripheral annular tear and disc herniation), the cartilaginous endplate (CEP) (e.g., avulsion), the vertebral body (VB) (e.g., bony fracture), nerves (e.g., compression), and other soft tissues (e.g., ligament sprains, muscle strains). The precise relationship between changes in various spine components and their impact on back pain is still unclear but including all of the components is crucial for understanding spine health from a “whole-organ” point of view. While excellent preliminary results have been reported in many areas, clinical applications are still limited largely due to several technical challenges to be resolved yet.Technical Challenges
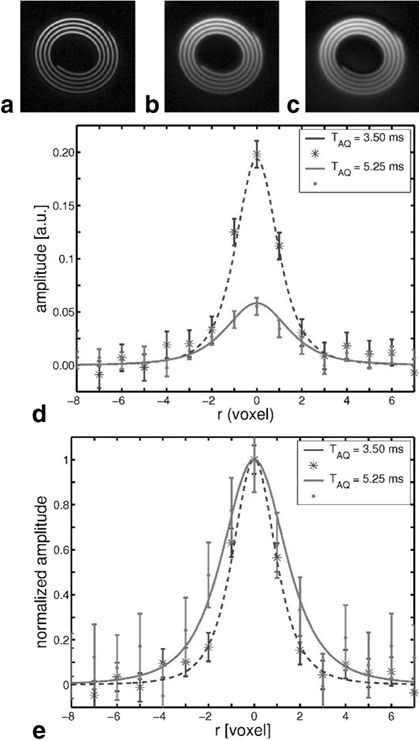
The major challenges in UTE/ZTE MRI lie in the following five areas.First, short-T2 tissues typically have low proton densities (e.g., bone has ~20% water), and fast signal decay, therefore requiring a special group of sequences including UTE and ZTE (1-11). Furthermore, direct imaging of short-T2 tissues is typically associated with low SNR and strong spatial blurring. A short sampling window is required to minimize spatial blurring, and this limits spatial resolution (10). Figure 1 shows images of the short-T2 phantom acquired using different sampling windows, which clearly shows the spatial blurring associated with longer sampling windows. An effective strategy is to develop stronger gradient and RF systems (15). A shorter pulse with a higher power helps to minimize signal loss during RF excitation.
Second, eddy currents are major factors limiting the clinical applications of UTE-type sequences (16). UTE sequences based on non-Cartesian sampling are typically more sensitive to eddy current effects than conventional clinical sequences based on Cartesian sampling. 2D UTE sequences are especially sensitive to eddy currents due to the use of half-pulse excitation, where eddy currents may shift or distort the k-space trajectories and lead to out-of-slice excitation. Figure 2 shows 2D UTE imaging of an object consisting of a phantom with several short T2 components, a cylinder, and a ball phantom. Regular full RF pulse excitation, non-compensated half RF pulse excitation, linear eddy compensated RF excitation, RF excitation with both linear and B0 eddy current compensated were compared. The last approach provided much improved slice-selective, and better T2* quantification. Eddy currents compensation and k-space trajectory measurement are helpful for more reliable UTE imaging. In comparison, ZTE is insensitive to eddy currents as k-space data is sampled after gradient ramp-up (11).
Third, UTE/ZTE imaging is also subject to errors associated with long-T2 water and fat signal contamination, leading to inaccurate morphological and especially quantitative imaging of short-T2 tissues such as the OCJ and CEP (7-9). Long-T2 tissues typically have higher proton densities. Long-T2 signal contamination has a significant impact on short-T2 imaging and quantification, especially for thin structures such as the OCJ and CEP. For example, the OCJ is a very thin and curved structure (17). Regular UTE with variable echo times can be used for T2* mapping, but likely the values are subject to significant errors due to partial volume effects (18). Figure 3 shows dual adiabatic inversion recovery prepared UTE (DIR-UTE) imaging of the OCJ and T2* quantification. Efficient long-T2 suppression based on adiabatic inversion recovery UTE sequences is very important for accurate T2* mapping (19). The cartilaginous endplate is another case, where efficient long-T2 suppression is likely to improve the depiction and quantification of its properties such as T1, T2*, and proton density.
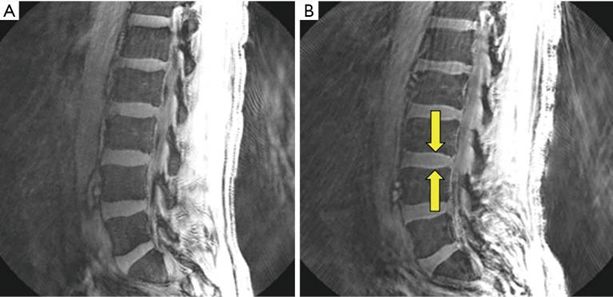
Fourth, fat contamination and related off-resonance artifacts are other potential sources of errors with UTE/ZTE imaging (20). Fat signal contamination can significantly affect the quantification of short-T2 tissues, including MR relaxation times (e.g., T1, T2, T2*, T1r) and tissue properties (e.g., water content, macromolecular proton fraction, susceptibility, perfusion, diffusion). Furthermore, UTE sequences based on center-out radial or spiral mapping of k-space are subject to off-resonance artifacts (i.e., spatial blurring due to the ring-shaped point spread function) which are very different from those seen with a Cartesian sampling of k-space (20). For example, displacement of fat signal from red bone marrow in the lumbar spine to the intervertebral discs can simulate their cartilaginous endplates, as shown in Figure 4 (20). It is important to recognize and minimize chemical shift-based artifacts in UTE imaging.
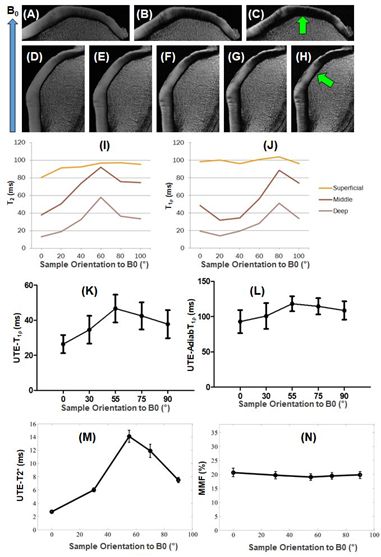
Fifth, the magic angle effect is a major source of error in quantitative UTE/ZTE imaging (21). Both T2 and T1r are sensitive to the magic angle effect as the highly ordered collagen fibers in the short-T2 tissues are subject to strong dipole-dipole interactions. Previous studies have shown that T1r values can increase more than 200% in the middle and deep zones of articular cartilage, and 300% in ligaments when reoriented from 0° to 54° (21). Changes in T1r, T2, or T2* caused by the magic angle effect can be significantly higher than changes caused by degeneration, which are typically in the range of 10-30% in osteoarthritis-related changes (22), thereby complicating clinical diagnosis and treatment monitoring. Therefore, magic angle-insensitive techniques, such as UTE-AdiabT1rho (23) and UTE-MT modeling (24), as shown in Figure 5, are of particular interest for robust assessment of both short- and long-T2 tissue degeneration.
Conclusion
Technical challenges and potential solutions have to be considered for morphological and quantitative UTE/ZTE imaging of short T2 tissues or tissue components in the MSK system (25).Acknowledgements
The authors acknowledge grant support from the National Institutes of Health (R01AR062581, R01AR068987, R01AR075825, R01AR078877, and R21AR075851), the VA Clinical Science Research & Development Service (I01CX002211, and I01CX001388), and GE Healthcare.References
1. Robson MD, Gatehouse PD, Bydder M, Bydder GM. Magnetic Resonance: An Introduction to Ultrashort TE (UTE) Imaging. J Comput Assist Tomogr. 2003;27(6):825-846.
2. Larson PE, Conolly SM, Pauly JM, Nishimura DG. Using adiabatic inversion pulses for long-T2 suppression in ultrashort echo time (UTE) imaging. Magn Reson Med 2007;58:952–961.
3. Techawiboonwong A, Song HK, Leonard MB, Wehrli FW. Cortical Bone Water : In VivoQuantification with Ultrashort Cortical Bone Water: In Vivo Quantification with Ultrashort Echo-Time MR Imaging. Radiology. 2008;248(3):824-833.
4. Du J, Carl M, Bydder M, Takahashi A, Chung CB, Bydder GM. Qualitative and quantitative ultrashort echo time (UTE) imaging of cortical bone. J Magn Reson. 2010;207(2):304-311.
5. Manhard MK, Horch RA, Gochberg DF, Nyman JS, Does MD. In Vivo Quantitative MR Imaging of Bound and Pore Water in cortical bone. Radiology. 2015;277(1):221-230.
6. Carl M, Bydder GM, Du J. UTE imaging with simultaneous water and fat signal suppression using a time-efficient multispoke inversion recovery pulse sequence. Magn Reson Med 2016; 76:577–582.
7. Du J, Takahashi AM, Bae WC, Chung CB, Bydder GM. Dual inversion recovery, ultrashort echo time (DIR UTE) imaging: Creating high contrast for short-T2species. Magn Reson Med. 2010;63(2):447-455.
8. Ma Y, Zhu Y, Lu X, Carl M, Chang EY, Du J. Short T2 imaging using a 3D double adiabatic inversion recovery prepared ultrashort echo time cones (3D DIR-UTE-Cones) sequence”. Magn Reson Med 2018; 79:2555-2563.
9. Ma Y, Jerban S, Carl M, Wan L, Guo T, Jang H, Bydder GM, Chang EY, Du J. Imaging of the region of the osteochondral junction (OCJ) using a 3D adiabatic inversion recovery prepared ultrashort echo time Cones (3D IR-UTE Cones) sequence at 3T. NMR Biomedicine 2019; 32(5):e4080.
10. Rahmer J, Bornert P, Groen J, Bos C. Three-dimensional radial ultrashort echo-time imaging with T2 adapted sampling. Magn Reson Med 2006; 55:1075-1082.
11. Weiger M, Pruessmann KP, Hennel F. MRI with zero echo time: hard versus sweep pulse excitation. Magn Reson Med 2011; 66: 379–389.
12. Hunter DJ, Zhang YQ, Niu JB, Tu X, Amin S, Clancy M, Guermazi A, Grigorian M, Gale D, Felson DT. The association of meniscal pathologic changes with cartilage loss in symptomatic knee osteoarthritis. Arthritis Rheum 2006; 54:795-801.
13. Tan AL, Toumi H, Benjamin M, Grainger AJ, Tanner SF, Emery P, McGonagle D. Combined high-resolution magnetic resonance imaging and histological examination to explore the role of ligaments and tendons in the phenotypic expression of early hand osteoarthritis. Ann Rheum Dis 2006; 65:1267-1272.
14. Brandt KD, Radin EL, Dieppe PA, Putte L. Yet more evidence that osteoarthritis is not a cartilage disease (Editorial). Ann Rheum Dis 2006; 65:1261-1264.
15. Weiger M, Froidevaus R, Baadsvik EL, Brunner DO, Rosler MB, Pruessmann KP. Advances in MRI of the myelin bilayer. NeuroImage 2020; 217:116888.
16. Lu A, Daniel BL, Pauly JM, Pauly KB. Improved slice selection for R2* mapping during cryoablation with eddy current compensation. J Magn Reson Imaging 2008; 28:190-198.
17. Lane LB, Bullough PG. Age-related changes in the thickness of the calcified zone and the number of tidemarks in adult human articular cartilage. J Bone Joint Surg Br 1980; 62:372-375.
18.Foreman SC, Ashmeik W, Baal JD, Han M, Bahroos E, von Schacky CE, Carl M, Krug R, Joseph GB, Link TM. Patients with type 2 diabetes exhibit a more mineralized deep cartilage layer compared with nondiabetic controls: a pilot study. Cartilage 2019. DOI: 10.1177/1947603519870853.
19. Du J, Carl M, Bae WC, Statum S, Chang EY, Bydder GM, Chung CB. Dual inversion recovery ultrashort echo time (DIR-UTE) imaging and quantification of the zone of calcified cartilage (ZCC). Osteoarthritis Cartilage 2013; 21:77-85.
20. Bydder M, Carl M, Bydder GM, Du J. MRI Chemical Shift Artifact Produced by Center-Out Radial Sampling of k-Space: A Potential Pitfall in Clinical Diagnosis. Quant Imaging Med Surg 2021; 11:3677-3683.
21. Shao H, Pauli C, Li S, Ma Y, Tadros AS, Kavanaugh A, et al. Magic angle effect plays a major role in both T1rho and T2 relaxation in articular cartilage. Osteoarthritis Cartilage 2017; 25:2022-2030.
22. Mosher TJ, Zhang Z, Reddy R, Boudhar S, Milestone BN, Morrison WB, et al. Knee articular cartilage damage in osteoarthritis: analysis of MR image biomarker reproducibility in ACRIN-PA 4001 multicenter trial. Radiology 2011; 258:832-42.
23. Wu M, Ma Y, Kasibhatla A, et al. Convincing evidence for magic angle less-sensitive quantitative T1ρ imaging of articular cartilage using the 3D ultrashort echo time cones adiabatic T1ρ (3D UTE Cones-AdiabT1ρ) Sequence. Magn Reson Med 2020; 84:2551-2560.
24. Ma Y, Shao H, Chang EY, Du J. UTE magnetization transfer (UTE-MT) imaging and modeling: magic angle independent biomarkers of tissue properties. NMR Biomed 2016; 29:1546-1552.
25. Masoud-Afsahi A, Ma Y, Jang H, Jerban S, Chung C, Chang EY, Du J. Ultrashort Echo Time (UTE) MRI Techniques: Met and Unmet Needs in Musculoskeletal Imaging. J Magn Reson Imaging 2021, Dec 28. (Online ahead of print).
Figures