Preclinical MRS: Advances, Challenges & Strategies
Cristina Cudalbu1
1CIBM MRI EPFL AIT, Switzerland
1CIBM MRI EPFL AIT, Switzerland
Synopsis
Preclinical in vivo MRS has undergone an enormous evolution from the first unlocalized experiments to the robust technique which is today: advancements in localization, spectral resolution, water and outer volume suppression, minimization of the static B0 magnetic field variations, artifact suppression, spectral editing, number of detected metabolites, spectral fitting and quantification precision. SVS 1H MRS in nowadays widely used while MRSI, X-nuclei MRS and diffusion weighted MRS are more complex MRS techniques with several challenges.
Preclinical MRS advancements
Magnetic Resonance Spectroscopy (MRS) is the main technique allowing to measure simultaneously a high number of metabolites in vivo non-invasively. In parallel, it allows to measure metabolite concentrations and different biochemical processes (e.g., metabolite fluxes) in different organs in normal or pathological conditions1. These unique advantages enable the longitudinal monitoring of disease progression and/or effect of treatment thus making a bridge between basics research and clinical diagnosis.In this context, the use of different rodent models mimicking multiple aspects of the human disease is extremely useful2. While different cell cultures can be used for answering basic cellular/metabolic questions, in vivo rodent models are needed for more complex questions related to the living organism2.
In vivo MRS studies can be performed using different nuclei (1H, 31P, 13C, 15N,17O) and can be more or less complex depending on the nuclei under investigation3. Often complementary information on the same metabolites can be measured when combining different nuclei: phosphocreatine in 1H and 31P spectra; glutamate and glutamine in 1H and 13C spectra or 15N spectra.
1H MRS allows the detection of 19 metabolites involved in: osmoregulation (taurine (Tau), inositol (Ins), creatine (Cr)), myelination/cell proliferation (phosphocholine (PCho), glycerophosphocholine (GPC), phosphoethanolamine (PE), N-acetylaspartate (NAA), N-acetylaspartylglutamate (NAAG)), energy metabolism (lactate (Lac), glucose (Glc), alanine (Ala), phosphocreatine (PCr), Cr), and neurotransmitters and metabolites involved in neurotransmission (glutamate (Glu), glutamine (Gln), aspartate (Asp), glycine (Gly), γ-aminobutyrate (GABA)), antioxidants (glutathione (GSH) and ascorbate (Asc)).
31P MRS provides complementary information on the three phosphates of adenosine triphosphate (ɣ,β,α-ATP), PCr and inorganic phosphate (Pi) and chemical reaction rates between them (i.e. creatine kinase and ATP synthase). Cell membrane precursors and degradation products (phosphomonoesters (PCho, PE); diesters (GPC, glycerol-phosphoethanolamine), the resonance of nicotinamide adenine dinucleotide (NAD+), nicotinamide adenine dinucleotide phosphate (NADP) and NAD+/NADH redox state can be measured.
13C or 15N MRS with infusions of isotopically labeled substrates are used to monitor the flow of the isotope of interest into different metabolic intermediates. 13C MRS enables the determination of biochemical fluxes like glycolytic rate, tricarboxylic cycle flux, exchange of Glu and Gln through neurotransmission processes. 15N MRS is an alternative approach to study glutamate-glutamine metabolism while 17O MRS is also used to measure energy metabolism.
Preclinical in vivo MRS has undergone an enormous evolution from the first unlocalized experiments to the robust technique which is today: advancements in localization, spectral resolution, water and outer volume suppression, minimization of the static B0 magnetic field variations, artifact suppression, spectral editing, number of detected metabolites, spectral fitting and quantification precision2–11.
The tendency is to perform acquisitions at ultra-high magnetic field strengths (UHF, B0≥7T) leading to the following benefits:
· increased intrinsic signal-to-noise ratio (SNR) (i.e. sensitivity)
· increased chemical shift dispersion (i.e. spectral resolution)
· decreased strong J-coupling effects
These benefits combined with the usage of ultra-short echo times:
· are useful for low concentrated and/or strongly overlapped metabolites and for metabolites having complex J-coupled spectral patterns
· led to an enormous increase in the number of detectable metabolites increasing thus the amount of biochemical information
· led to improved quantification precision and accuracy
Preclinical MRS challenges and strategies
Single voxel MRS (SVS) is measuring metabolites in one single preselected volume (VOI of mm size). The most used SVS sequences are STEAM, PRESS, SPECIAL, LASER and they all lead to high spectral quality (e.g. good localization with low chemical shift displacement error, outer volume and water suppression)2. However, only one single spectrum per VOI is usually acquired.In contrast, Magnetic Resonance Spectroscopic Imaging (MRSI) is a powerful non-invasive imaging tool to map simultaneously the brain regional distribution of multiple metabolites offering a characterization of the regional differences in the studies organ. The current drawback of MRSI is the long measurement time, while fast MRSI in preclinical settings has not been used very often mainly due to the complexity of the technique. To the best of our knowledge, preclinical high resolution 1H-MRSI data are still acquired using traditional phase encoded MRSI12–16. Fast MRSI has been implemented for dynamic nuclear polarization with lower spatial resolution, higher SNR, few metabolites investigated with almost no spectral overlap17.
SVS 1H MRS in nowadays widely used while MRSI, X-nuclei MRS2,3 and diffusion weighted MRS18 are more complex MRS techniques with several challenges:
· long measurement times
· low concentrated metabolites and SNR
· hardware limitations (B0 and gradient strength, RF coils, B0 inhomogeneities)
· requirement for advanced in-house developed pulse sequences and post-processing methods
· quality assessment of a huge number of spectra
· estimation of the precision and reliability of derived metabolite maps or modelling approaches.
Several strategies are worth to be mentioned to overcome these challenges:
· Specific technical recommendations for preclinical MRS have been provided in the consensus manuscript on preclinical MRS2
· FID-MRSI is particularly suited for brain metabolites mapping due to negligible J-coupling and T2 related signal loss, resulting in better suitability for fast MRSI at UHF in preclinical settings19–23
· Post-processing methods aiming at minimizing the variance of the MRS signals are needed24–28. · The MRSHub (https://www.mrshub.org) should be used for harmonization of preclinical MRS acquisitions, processing and data sharing.
Acknowledgements
Supported by the SNSF projects no 310030_173222 and 310030_201218. We acknowledge access to the facilities and expertise of the CIBM Center for Biomedical Imaging founded and supported by Lausanne University Hospital (CHUV), University of Lausanne (UNIL), Écôle polytechnique fédérale de Lausanne (EPFL), University of Geneva (UNIGE) and Geneva University Hospitals (HUG).References
1. Cudalbu, C. & Lanz, B. Methods | Magnetic Resonance Spectroscopy for the Measurement of In Vivo Brain Metabolism. in Encyclopedia of Biological Chemistry III 701–711 (Elsevier, 2021). doi:10.1016/B978-0-12-819460-7.00295-4 2. Lanz, B. et al. Magnetic resonance spectroscopy in the rodent brain: Experts’ consensus recommendations. NMR Biomed. 34, (2021). 3. Lanz, B., Rackayova, V., Braissant, O. & Cudalbu, C. MRS studies of neuroenergetics and glutamate/glutamine exchange in rats: Extensions to hyperammonemic models. Anal. Biochem. 529, 245–269 (2017). 4. Kreis, R. et al. Terminology and concepts for the characterization of in vivo MR spectroscopy methods and MR spectra: Background and experts’ consensus recommendations. NMR Biomed. 34, (2021). 5. Near, J. et al. Preprocessing, analysis and quantification in single‐voxel magnetic resonance spectroscopy: experts’ consensus recommendations. NMR Biomed. 34, (2021). 6. Juchem, C. et al. B 0 shimming for in vivo magnetic resonance spectroscopy: Experts’ consensus recommendations. NMR Biomed 34, (2021). 7. Cudalbu, C. et al. Contribution of macromolecules to brain 1 H MR spectra: Experts’ consensus recommendations. NMR Biomed. 34, (2021). 8. Pfeuffer, J., Tkac, I., Provencher, S. W. & Gruetter, R. Towards an In Vivo Neurochemical Profile : Quantification of 18 Metabolites in Short-Echo-Time 1H NMR Spectra of the Rat Brain. J. Magn. Reson. 141, 104–120 (1999). 9. Gruetter, R. & Tkac, I. Field mapping without reference scan using asymmetric echo-planar techniques. Magn Reson Med 43, 319–323 (2000). 10. Tkáč, I. & Gruetter, R. In vivo1H NMR spectroscopy and neurochemistry. Quantification matters. Magn. Reson. Med. 54, 1048–1049 (2005). 11. Tkáč, I. et al. Water and lipid suppression techniques for advanced 1H MRS and MRSI of the human brain: Experts’ consensus recommendations. NMR in Biomedicine (2021). doi:10.1002/nbm.4459 12. Mlynárik, V. et al. Quantitative proton spectroscopic imaging of the neurochemical profile in rat brain with microliter resolution at ultra-short echo times. Magn. Reson. Med. 59, 52–58 (2008). 13. Braissant, O., McLin, V. A. V. A. & Cudalbu, C. Ammonia toxicity to the brain. J. Inherit. Metab. Dis. 36, 595–612 (2013). 14. Cudalbu, C. In vivo studies of brain metabolism in animal models of Hepatic Encephalopathy using 1H Magnetic Resonance Spectroscopy. Metab. Brain Dis. 28, 167–174 (2013). 15. Cudalbu, C. et al. Imaging glutamine synthesis rates in the hyperammonemic rat brain. in ISMRM 3324 (2010). 16. Simões, R. V., Delgado-Goñi, T., Lope-Piedrafita, S. & Arús, C. 1H-MRSI pattern perturbation in a mouse glioma: The effects of acute hyperglycemia and moderate hypothermia. NMR Biomed. 23, 23–33 (2010). 17. Topping, G. J. et al. Acquisition strategies for spatially resolved magnetic resonance detection of hyperpolarized nuclei. Magn. Reson. Mater. Physics, Biol. Med. 33, 221–256 (2020). 18. Palombo, M., Shemesh, N., Ronen, I. & Valette, J. Insights into brain microstructure from in vivo DW-MRS. Neuroimage 182, 97–116 (2018). 19. Bogner, W., Gruber, S., Trattnig, S. & Chmelik, M. High-resolution mapping of human brain metabolites by free induction decay 1H MRSI at 7T. NMR Biomed. 25, 873–882 (2012). 20. Henning, A., Fuchs, A., Murdoch, J. B. & Boesiger, P. Slice-selective FID acquisition, localized by outer volume suppression (FIDLOVS) for 1H-MRSI of the human brain at 7 T with minimal signal loss. NMR Biomed. 22, 683–696 (2009). 21. Hangel, G. et al. Ultra-high resolution brain metabolite mapping at 7 T by short-TR Hadamard-encoded FID-MRSI. Neuroimage 168, (2016). 22. Hingerl, L. et al. Density-weighted concentric circle trajectories for high resolution brain magnetic resonance spectroscopic imaging at 7T. Magn. Reson. Med. 79, (2018). 23. Strasser, B. et al. Coil combination of multichannel MRSI data at 7 T: MUSICAL. NMR Biomed. 26, 1796–1805 (2013). 24. Ebel, A., Dreher, W. & Leibfritz, D. Effects of zero-filling and apodization on spectral integrals in discrete Fourier-transform spectroscopy of noisy data. J. Magn. Reson. 182, 330–338 (2006). 25. Brender, J. R. et al. Dynamic Imaging of Glucose and Lactate Metabolism by 13 C-MRS without Hyperpolarization. Sci. Rep. 9, 3410 (2019). 26. Ahmed, O. A. New denoising scheme for magnetic resonance spectroscopy signals. IEEE Trans. Med. Imaging 24, 809–816 (2005). 27. Goryawala, M., Sullivan, M. & Maudsley, A. A. Effects of apodization smoothing and denoising on spectral fitting. Magn. Reson. Imaging 70, 108–114 (2020). 28. Jelescu, I., Veraart, J. & Cudalbu, C. MP-PCA denoising dramatically improves SNR in large-sized MRS data: an illustration in diffusion-weighted MRS. in ISMRM (2020).Figures
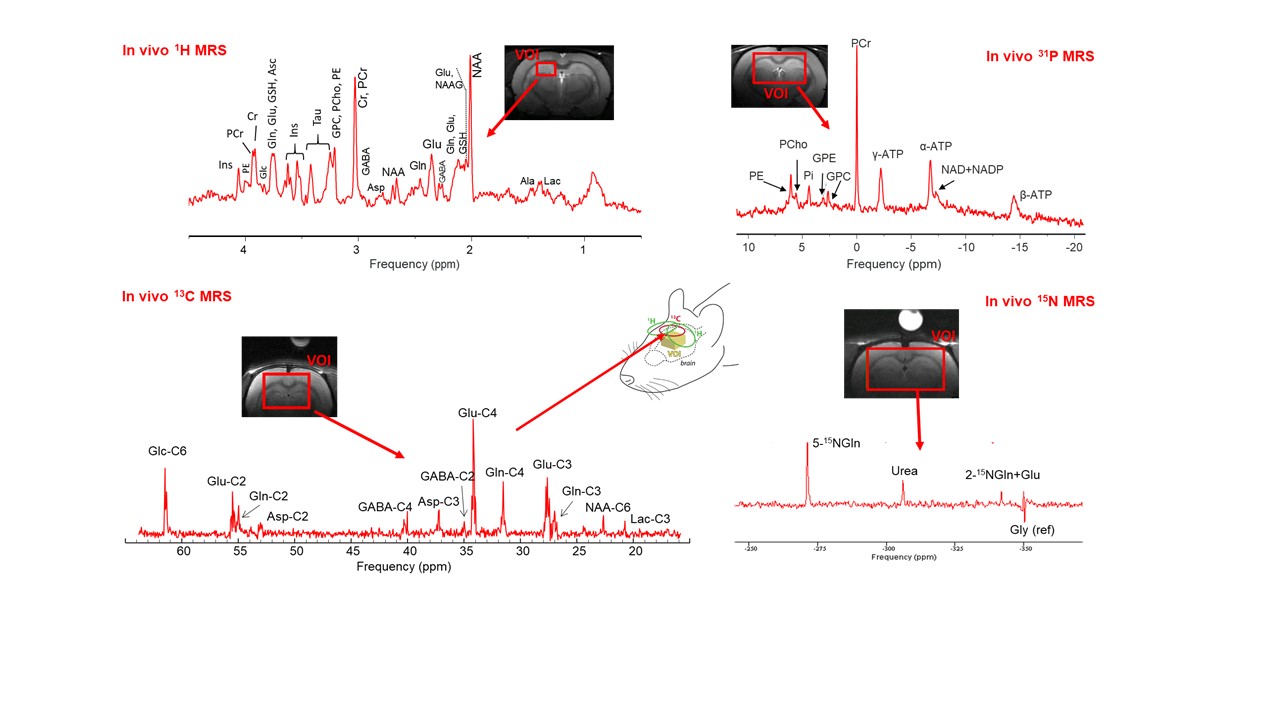
MR spectra acquired in vivo in the rat brain
at 9.4T
using 1H, 31P, 13C and 15N MRS
with the corresponding VOIs. 1H MR
spectra acquired in the hippocampus (SPECIAL sequence, TE=2.8 ms, TR=
4 s). 31P MR spectra acquired using
a
combination between ISIS and OVS as localization. 13C MR
spectra acquired under
[1,6-13C] Glc infusion using
the ISIS-DEPT sequence with OVS (TR = 2.5s, the data was acquired during 1h, starting
5h after the onset of glucose infusion at 9.4T). 15N MR
spectra acquired using
an
improved version of the SIRENE sequence.
Figure adapted
from references
1 and 3