Body MRS-II: MR Spectroscopic Imaging (MRSI) of Prostate Cancer
Naranamangalam R Jagannathan1,2
1Department of Radiology, Chettinad Hospital & Research Institute, Kelambakkam, India, 2Department of Electrical Engineering, Indian Institute of Technology, Chennai, India
1Department of Radiology, Chettinad Hospital & Research Institute, Kelambakkam, India, 2Department of Electrical Engineering, Indian Institute of Technology, Chennai, India
Synopsis
Early diagnosis of prostate cancer is essential and MRI and MR spectroscopic imaging (MRSI) together with scoring by Prostate Imaging Reporting and Data System is used for diagnosis. Both 1.5- and 3-Tesla are widely used. MEGA pulse for simultaneous suppression of lipid and water is incorporated into PRESS localization sequence along with outer volume suppression for obtaining MRSI. It gives spectra from voxels covering whole prostate enabling assessment of tissue heterogeneity. MRSI is used for detection, localization, staging, risk stratification and surveillance and direct targeting biopsies. This talk would cover the MRSI methodology along with the challenges and the solutions.
MR Spectroscopic Imaging (MRSI) of Prostate Cancer
Introduction:Prostate cancer (PCa) is a common non-cutaneous cancer affecting men worldwide. Screening is by digital rectal examination, measurement of serum prostate specific antigen level and confirmation by transrectal ultrasound biopsies. Both MRI and MR spectroscopic imaging (MRSI) together with scoring by Prostate Imaging Reporting and Data System is now widely used for diagnosis. This talk would cover the MRSI methodology along with the challenges and the solutions.
Acquisition:
MR images are necessary to guide placement of volume of interest (VOI) for MRSI. Both 1.5- and 3-Tesla are used for prostate imaging while studies at 7T has also been reported [1]. A pelvic phased-array coil is used at 1.5T with a endorectal coil to improve SNR. Balloon of endorectal coil is filled with 40–60cc of air for proper signal reception and position of probe, which is checked on sagittal images. At 3T, the balloon is filled with a perfluorocarbon fluid or barium sulfate to match the susceptibilities between the balloon and adjacent tissue [2,3]. MRSI spectral quality at 1.5T with endorectal coil is comparable to that at 3T without endorectal coil. At 7T due to lack an integrated body coil, local coils are required for transmission and to receive signals [1]. T2W images in transverse, sagittal and coronal planes are obtained along with T2W images in transverse plane with fat saturation. T1W images are also acquired in transverse and coronal planes.
Localization:
Spectra from either single-voxel (SV) or from multiple-voxels [chemical shift imaging or MRSI] are obtained. Advantages of MRSI over SV include localized spectra from many locations with small ROIs are acquired simultaneously. In MRSI, the pixel intensity is proportional to the relative concentrations of the metabolites which can be spatially distributed as metabolic imaging. 3D MRSI dataset contains spectra from voxels covering whole prostate enabling assessment of tissue heterogeneity and comparison of normal appearing tissue with reference to the pathological tissue. Data are collected in the absence of a readout gradient to preserve the chemical shift information and is combined with PRESS or STEAM sequences. For a given FOV, voxel size depends on the number of phase encoding steps along each of the spatial directions. Use of echo planar readout, spiral readout or parallel imaging techniques will reduce the total acquisition time of 3D MRSI [4-9] . Adiabatic pulses for localization by adiabatic selective refocusing (LASER) is used [10,11] for reducing outer volume signal contamination and for diminishing chemical shift displacement artifacts. Also, semi-LASER with GOIA pulses reduce acquisition to 5 min without an endorectal coil [12].
Technical challenges:
Firstly, spectrum of each voxel may be contaminated by neighboring voxels, hence an appropriate filter is need to minimize it. Second, shimming to be carried out over the entire VOI, therefore the homogeneity of an individual SV may not be good. Third, though acquisition of spectra from voxels of smaller size compared to SVS is possible in MRSI but it requires longer acquisition times and increased technical skills. Finally, the post-processing and analysis of MRSI data is time-consuming.
Suppression of water and lipid signals:
Efficient water suppression is necessary since tissue water concentration are 103-104 times higher compared to other metabolites present. This is achieved by frequency selective saturation, T1 relaxation or spectral editing methods. Mostly used method is based on frequency selective (or chemical shift selective) saturation (CHESS) [13]. Variable pulse power and optimized relaxation (VAPOR) is another method that use seven CHESS elements with optimized interpulse delays [14] and is insensitive to T1 effects and achieves excellent water suppression compared to CHESS. Other methods include water suppression by gradient tailored excitation (WATERGATE) [15], excitation sculpting [16], band-selective inversion with gradient dephasing (BASING) [17], and Mescher-Garwood (MEGA) [18,19]. MEGA and BASING can be integrated into the localization sequences for longer TE acquisitions. Selective suppression is possible with MEGA and also allows simultaneous suppression of lipids with water [18,20] (see Figure 1).
Outer volume suppression (OVS):
Another challenge is OVS of the signals originating from outside of prostate, mainly peri-prostatic fat that contaminate the spectra. A frequency selective RF pulse with a gradient is applied to spoil the magnetization outside the selected VOI before acquisition of MRSI [21,22]. Thickness, position, and orientation of individual OVS slices are adjusted to achieve optimum signal (see Figure 2).
Prostate metabolites in proton MRSI:
Typical metabolites seen are choline (3.22ppm), spermine (3.1ppm), creatine (3.02ppm), and citrate (2.66ppm). At 1.5T, the Cit appear as a single peak or as a doublet and at 3.0T it appears as a triplet or quadruplet-like peak (see Figure 3) [23,24]. Levels of Cit and spermine are higher in normal prostate while it is decreased in PCa. Changes in Cit and Cho are quantified by ratios of metabolites like Cit/Cho, [Cit/(Cho+Cr)] or [(Cho+Cr)/Cit]. Recently, water-unsuppressed MRSI was used for spectral quality improvement and for determining absolute tissue levels of choline [25].
Conclusions:
MRSI is used for detection, localization, staging, risk stratification and surveillance of untreated prostate cancer and direct targeting biopsies [26]. Recently, MRSI using a sLASER with gradient offset independent adiabaticity pulses with routine mpMRI was used for transition zone prostate cancer detection, localization and grading [27].
Acknowledgements
Author thanks his students and collaborators for their help and support. The Science and Engineering Research Board, Department of Science and Technology, Government of India is thanked for the award of J. C. Bose Fellowship.References
REFERENCES 1. E.K. Vos et. al. Eur. Radiol. 24 (2014) 1950-1958. 2. J.J. Futterer et al. Invest. Radiol. 39 (2004) 671-680. 3. J. Gawlitza et al., Sci. Rep. 7 (2017) 40640. 4. P. Mansfield, Magn. Reson. Med. 1 (1984) 370-386. 5. E. Adalsteinsson et al. Magn. Reson. Med. 39 (1998) 889-898. 6. S.Y. Tsai et al. Magn. Reson. Med. 59 (2008) 989-998. 7. R. Otazo et al. Magn. Reson. Med. 56 (2006) 1200-1210. 8. U. Dydak et al. Magn. Reson. Med. 50 (2003) 196-200. 9. F.H. Lin et al. Magn. Reson. Med. 57 (2007) 249-257. 10. J. Near et al. J. Magn. Reson Imaging 30 (2009) 335e343. 11. B. van den Bergen et al. NMR Biomed. 24 (2011) 358e365. 12. I.K. Steinseifer et al. Magn. Reson Med. 74 (2015) 915e924. 13. J. Haase et al. Phys. Med. Biol. 30 (1985) 341. 14. I. Tkáč et al. Magn. Reson. Med. 41 (1999) 649-656. 15. M. Piotto et al. J. Biomol. NMR 2 (1992) 661-665. 16. T.-L. Hwang and A. Shaka, J. Magn. Reson. A 112 (1995) 275-279. 17. J. Star-Lack et al. Magn. Reson. Med. 38 (1997) 311-321. 18. M. Mescher et al., J. Magn. Reson. A 123 (1996) 226-229. 19. M. Mescher et al. NMR Biomed. 11 (1998) 266-272. 20. V. Kumar and N.R. Jagannathan. MR spectroscopy (MRS) of the prostate.. In: Comprehensive Biomedical Physics, Elsevier, 2014, Editor-in-Chief: Anders Brahme, Vol. 3; p 287-297. 21. T.K. Tran et al. Magn. Reson. Med. 43 (2000) 23-33. 22. A. Connelly et al. J. Magn. Reson. 78 (1969) 519-525. 23. V. Kumar et al. Prog. NMR Spectros. 105, (2018) 23–40. 24. M.A. McLean et al. Magn. Reson. Med. 65 (2011) 914-919. 25. Nassim Tayari et al. Magn. Reson. Med, 87 (2022) 561-573. 26. Yousef Mazaheri et al. Magn Reson Imaging. 55 (2019) 93–102. 27. Nassim Tayari et al. Thiele Kobus. Analytical Biochemistry 529 (2017) 158e170.Figures
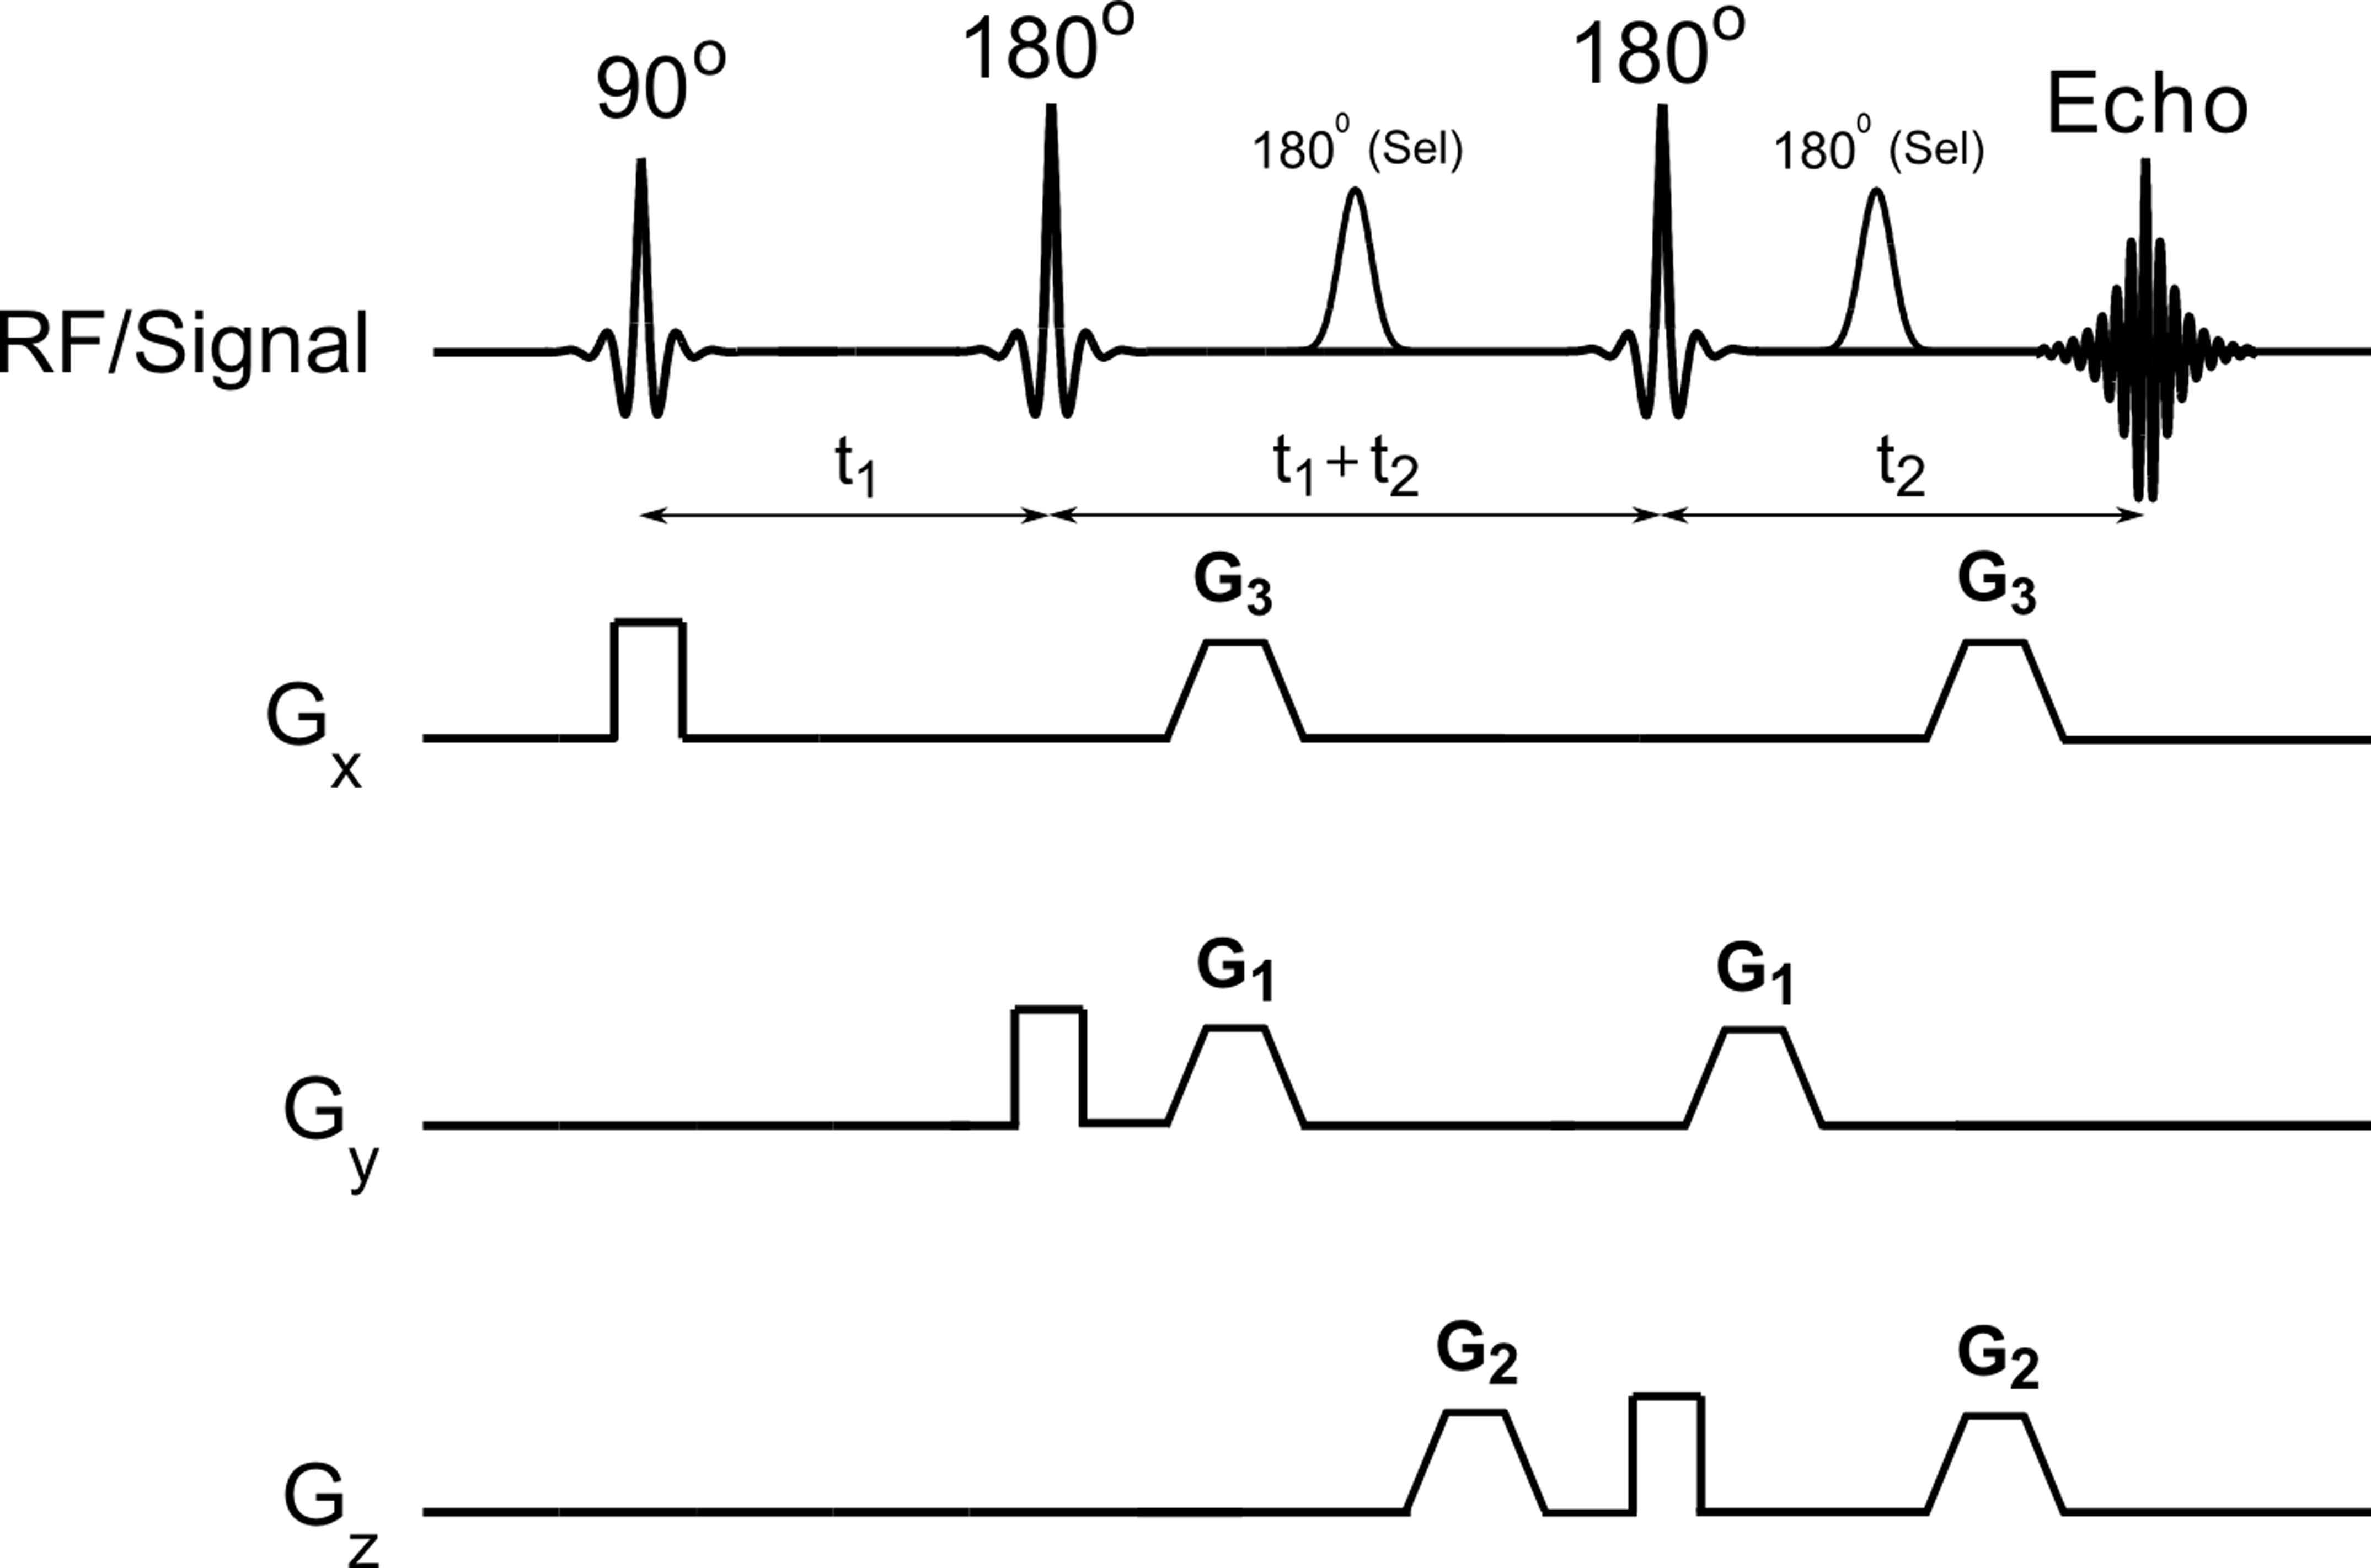
Figure 1. Incorporation of MEGA pulses for
simultaneous suppression of lipid and water incorporated into point resolved
spectroscopy radiofrequency (RF) pulse sequence. G1, G2, and G3 are the
gradients used for MEGA pulse (reprinted with permission from Elsevier from
reference # 20).
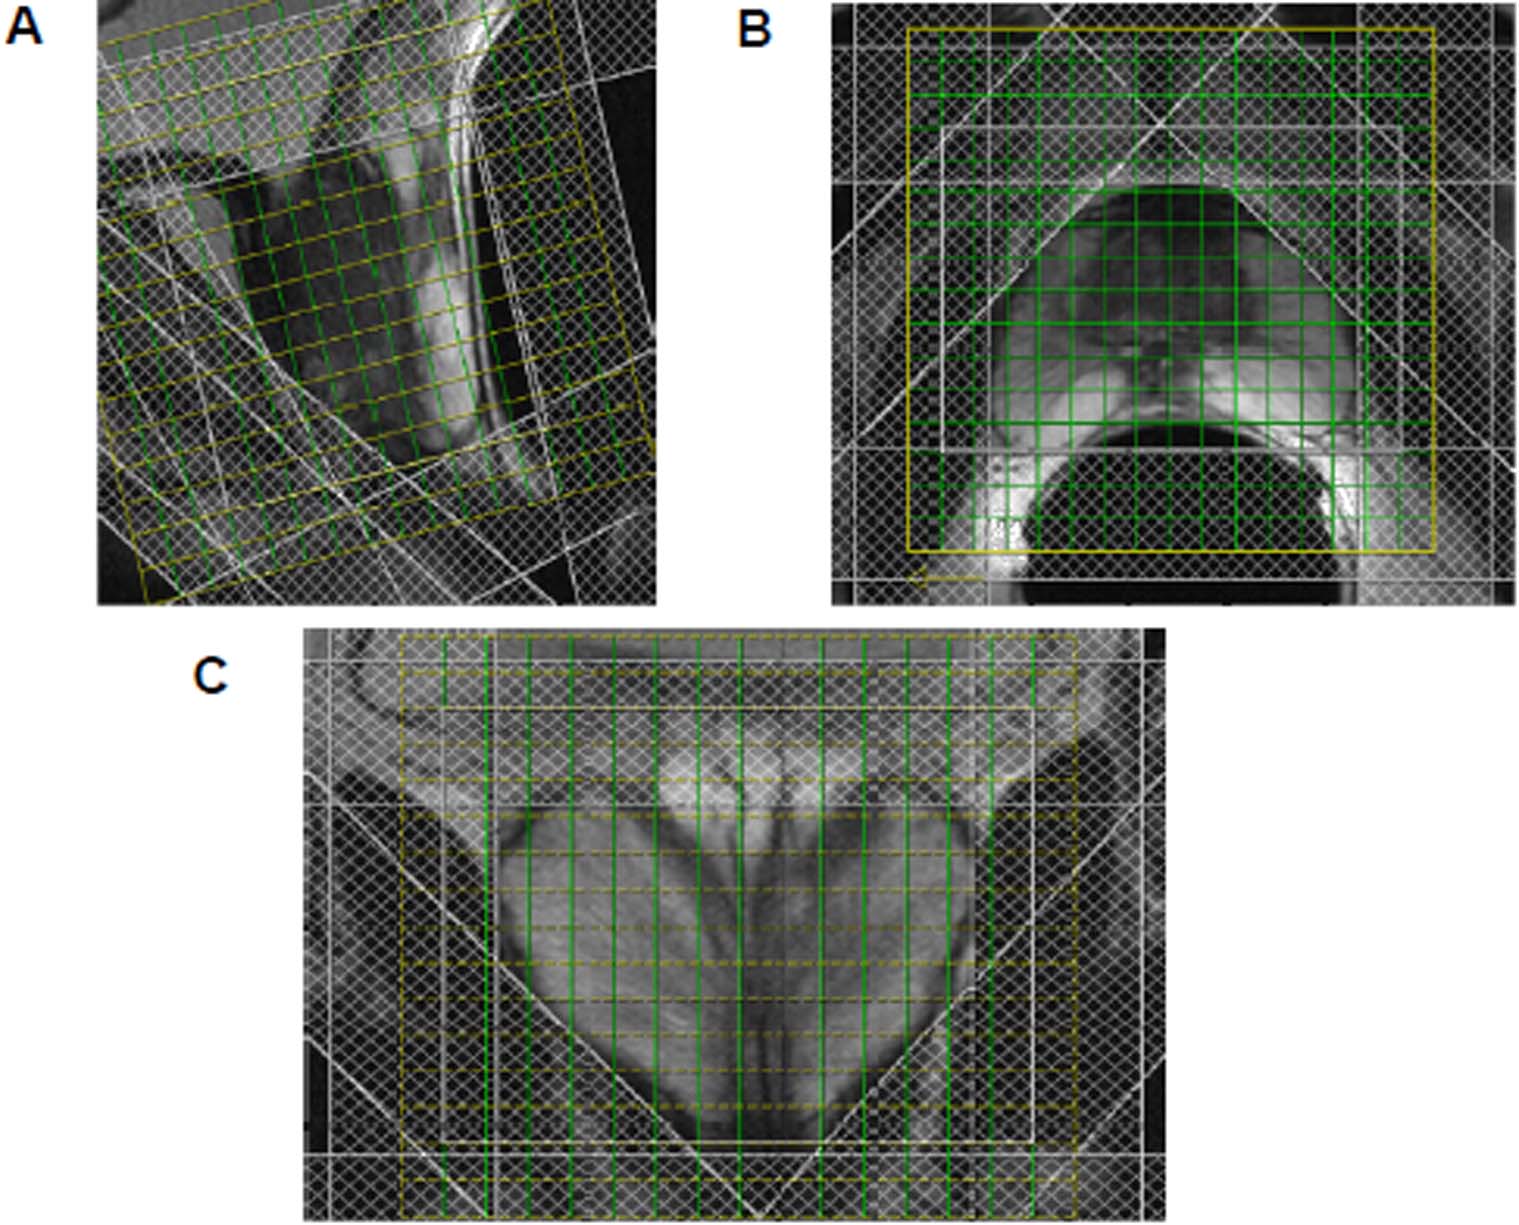
Figure 2. Position of outer volume suppression bands
and 3D MRSI planning on sagittal (a), transverse (b), and coronal (c) plane of
T2-weighted MR image of prostate (reprinted with permission from Elsevier from
reference # 20).
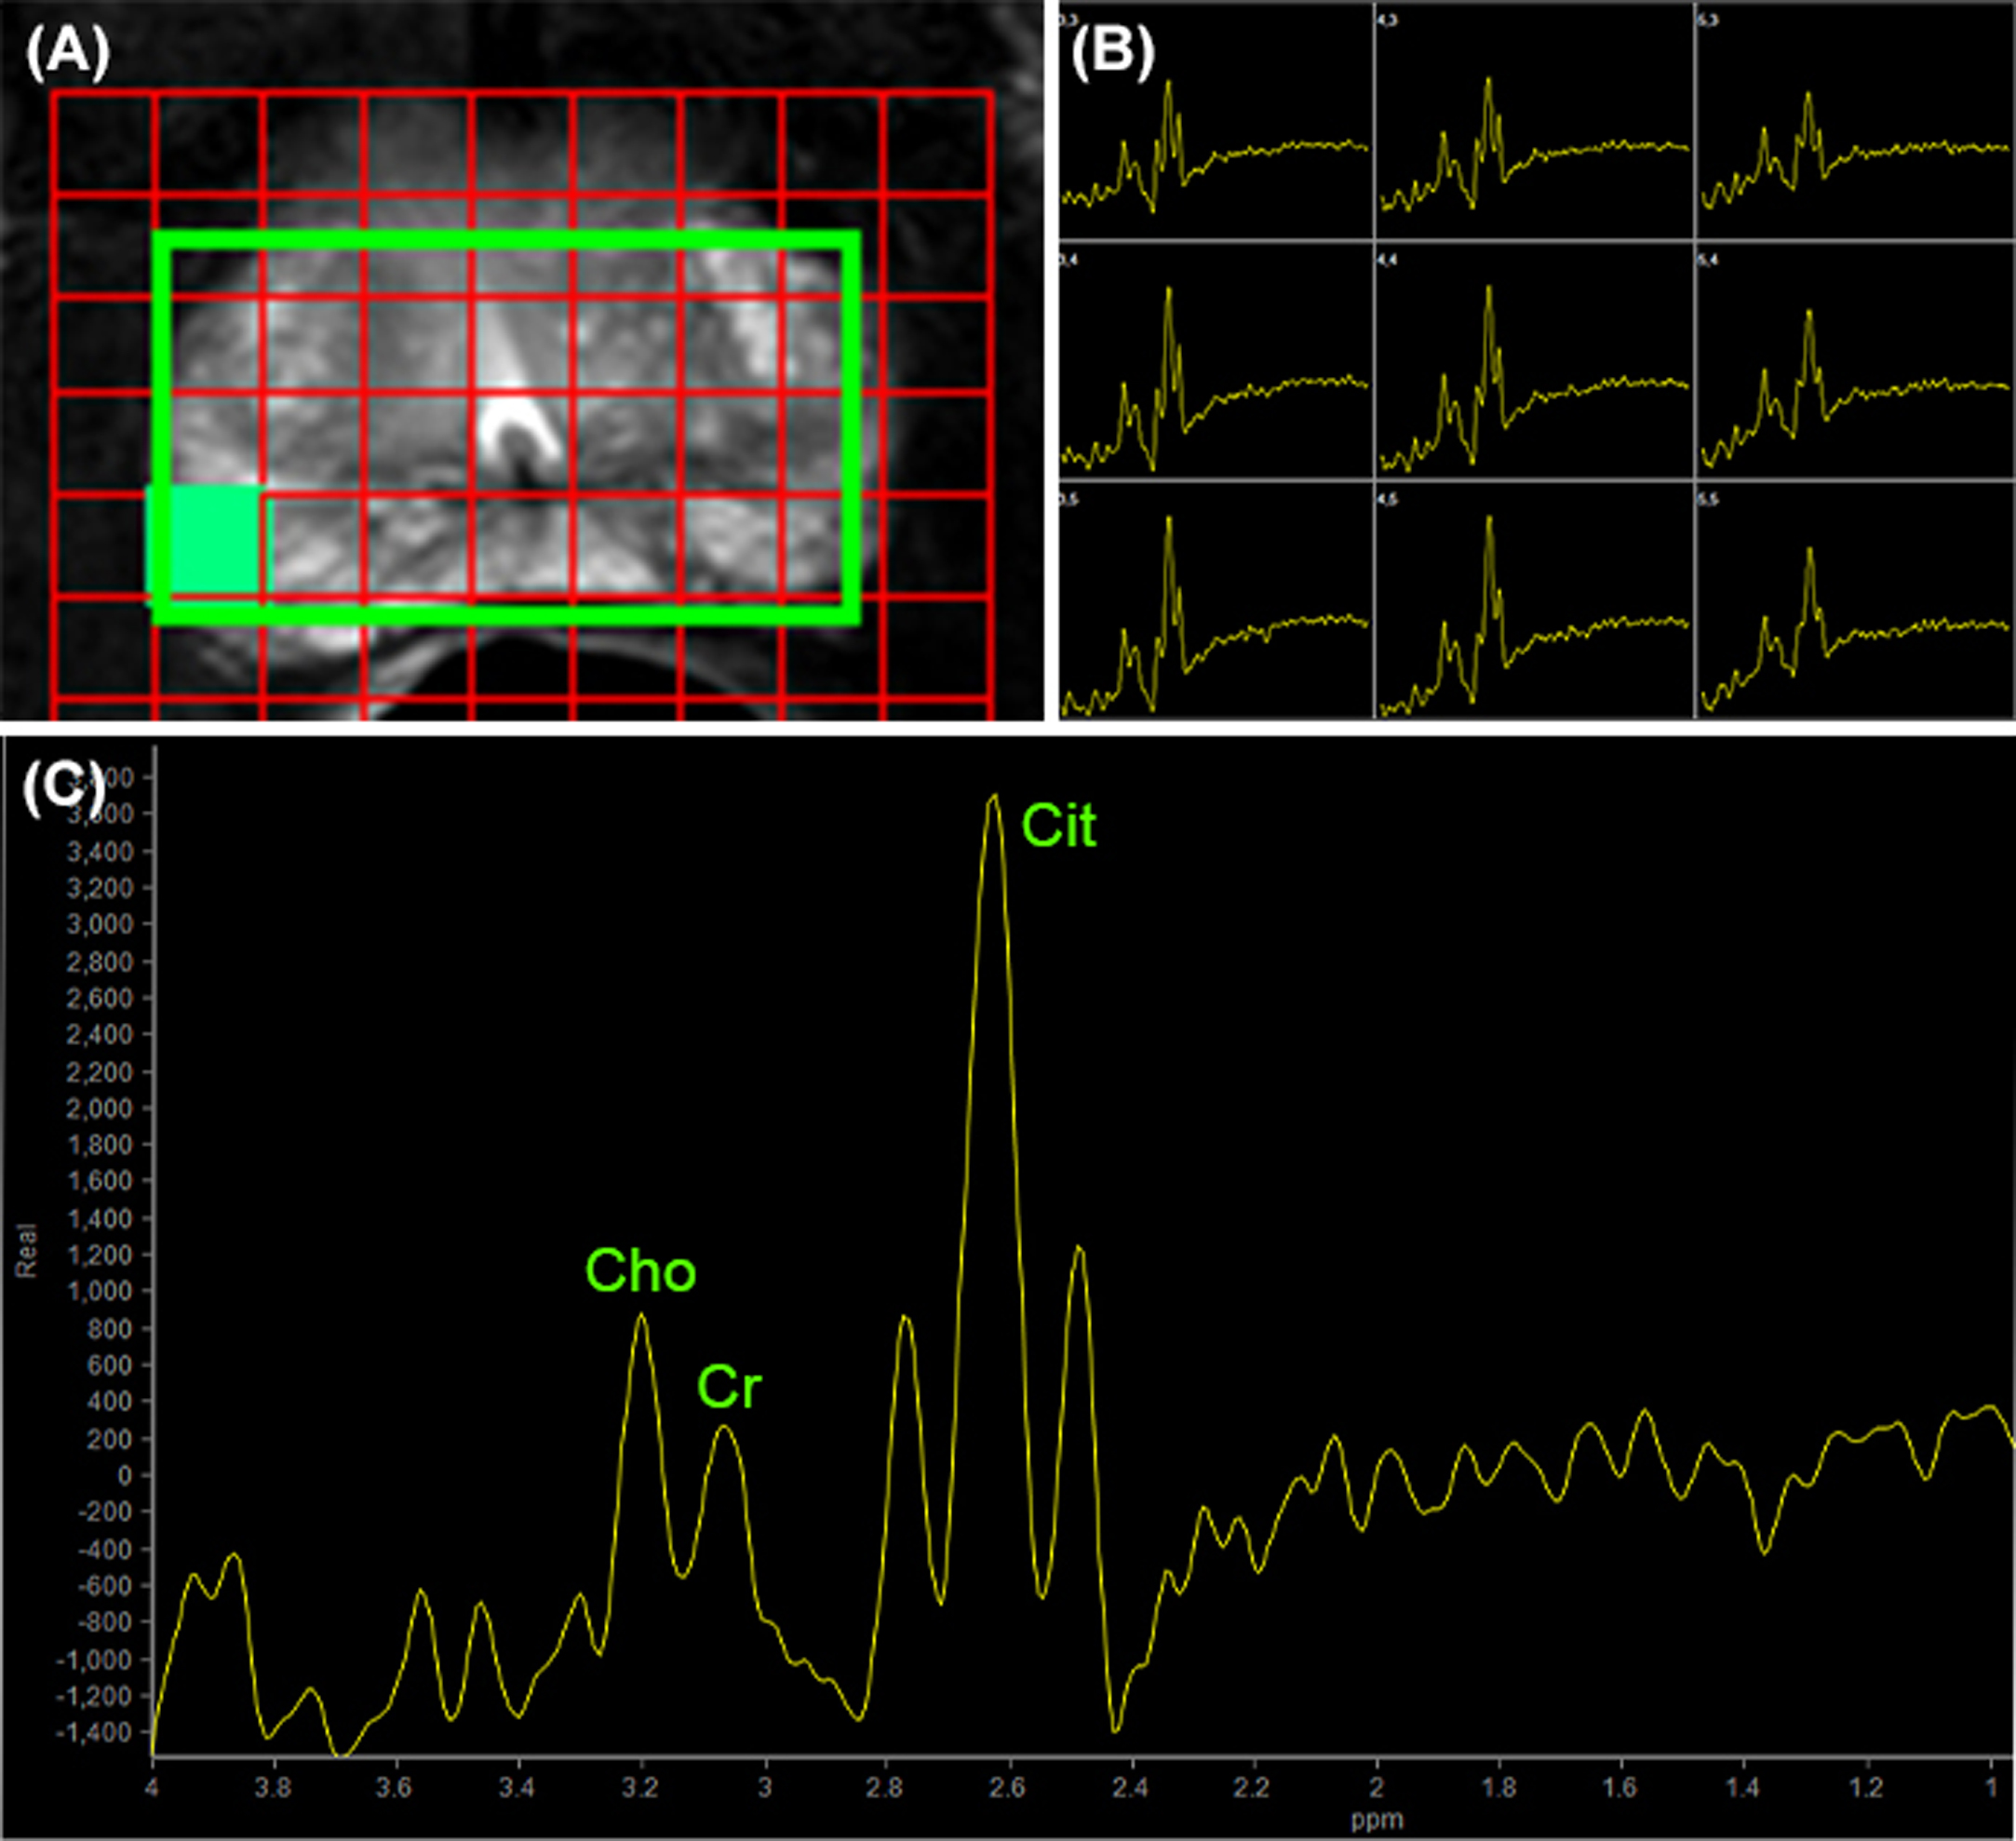
Figure 3. MRSI of prostate acquired at 3.0 T:
(A) MRSI matrix overlaid on T2W axial image off prostate, (B) the expanded
region of MRSI spectral grid showing spectra obtained from each voxel, and (C)
spectrum from one selected voxel (shown as filled square) (reprinted with
permission from Elsevier from reference # 23).