5042
Error Propagation in Absolute Metabolite Quantification for MR Spectroscopy of the Human Brain1Biomedical Engineering, Columbia University, New York, NY, United States, 2Radiology, Columbia University, New York, NY, United States
Synopsis
Spectral quantification methods provide absolute concentration estimates of metabolites from data acquired using in vivo MR spectroscopy. Cramér-Rao Lower Bounds (CRLB) are commonly employed as a minimum estimate of concentration error; however, absolute quantification relies on more than simply the uncertainty of Linear Combination Modeling (LCM). The uncertainties of both metabolite (e.g. T1, T2) and sequence-specific parameters (e.g. TR, TE), are generally ignored, leading to a systemic overestimation of accuracy. In this study, we present an analysis using the propagation of uncertainty to derive a more comprehensive estimate of the overall error of metabolite quantification.
Introduction
MR spectroscopy has developed into an effective tool for identifying and quantifying metabolite concentration in the human brain. Extracting concentrations from MR signals requires a series of post-processing methods, including Linear Combination Modeling (LCM), which fits a sum of differentially weighted basis functions to the measured spectrum1, and the conversion from institutional units to absolute concentration2. Cramér-Rao Lower Bounds (CRLB) are generally used to estimate the uncertainty of the LCM analysis3-5, and have been shown to be a close approximation of the quantification standard deviation for complete models6. However, metabolite quantification depends on the accuracy of multiple parameters, including the T1 and T2 relaxation rates in the region of interest, and the fractional estimates of brain matter in the voxel, among others (Equ. 1). An accurate estimate of the overall error should consider any measurement uncertainties that affect the final calculated concentration.The law of propagation of uncertainty derives the overall measurement error of a system given multiple sources of error7, and is commonly used across physics and engineering disciplines8-10. Since a number of parameters used in quantification are themselves the result of experimental studies, and thus have their own level of uncertainty, the full quantification error should consider the relative contribution from each of these sources. Otherwise, there is a risk to reporting severely underestimated uncertainties by only considering a single error source. This study attempts to quantify this effect, and examine the contribution of various parameters based on reported uncertainty values found in literature.
Methods
Metabolite quantification is described by the following equation2,$$(Equ. 1)\:\:C_m=\frac{A_me^{\frac{TE}{T2_m}}D_m(TR,T1_m)}{S_w(1-f_{csf})}*\sum_{i=1}^{3}{\frac{f_iD_{w,i}(TR,T1_{w,i})C_{w,i}}{e^\frac{TE}{T2_wi}}}$$
where Am is the relative scaling factor in [a.u.] of an individual metabolite basis function in the LCM analysis, fi are the fractional estimates of cerebrospinal fluid (CSF), grey and white matter in the voxel, T1m and T2m are the longitudinal and transverse relaxation times of the examined metabolite, T1wi and T2wi are the relaxation times of water in CSF, grey and white matter, Sw and Cwi are the water concentration in institutional and absolute units, and TE and TR are the sequence echo-time and repetition time, respectively.
We derived the expected overall standard deviation of a metabolite concentration Cm as a measure of its effective quantification error from the law of propagation of uncertainty7 comprising the uncertainties of contributing parameters as,
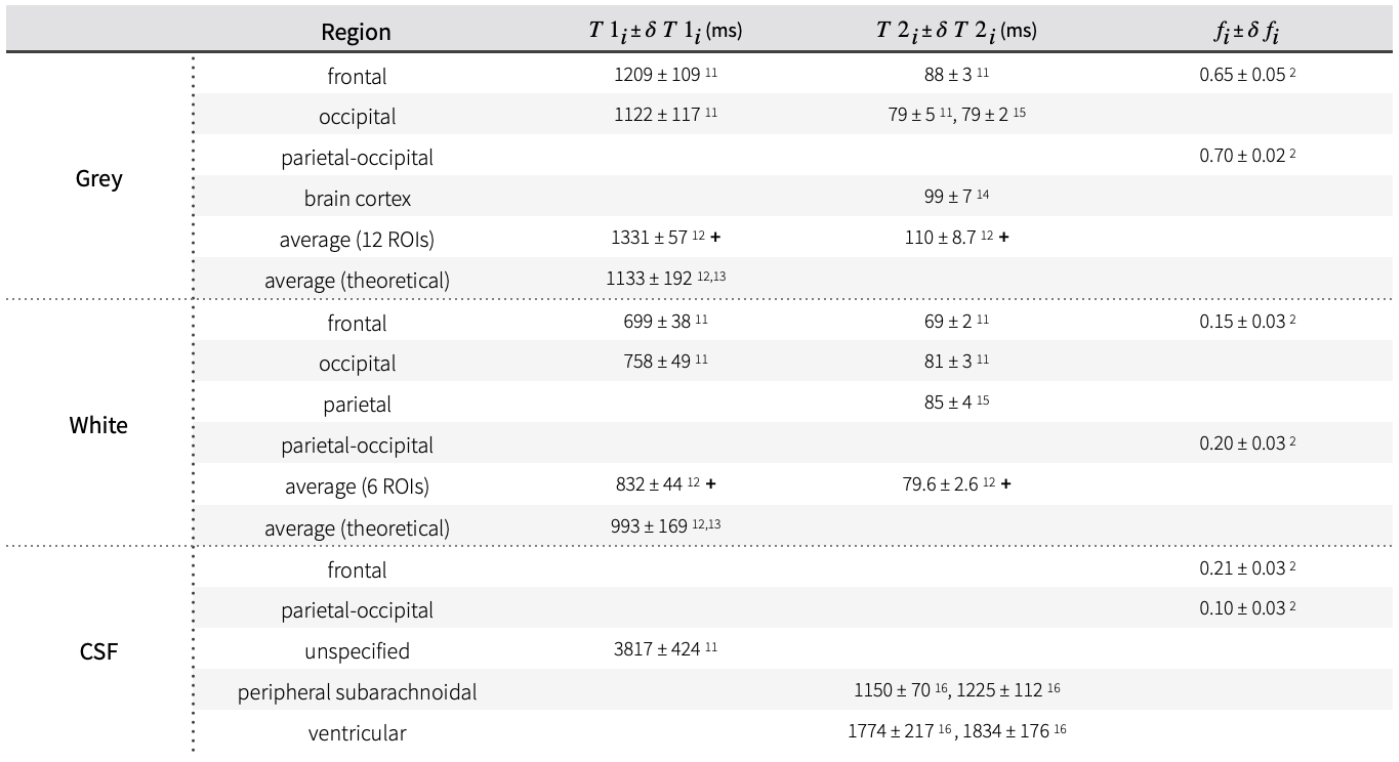
$$(Equ. 2)\;\;\delta{C_m}(\delta{x_i})=\sqrt{\sum_{j=1}^n\left(\frac{\partial{C_m}}{\partial{x_j}}\delta{x_j}\right)^2}, \delta{x_i}={\{\delta{A_m},\delta{S_w},\delta{T1_m},\delta{T2_m},\delta{f_{csf}},\delta{f_{white}},\delta{f_{grey}},\delta{C_{w,i}},\delta{TE},\delta{TR}\}}$$where $$$\frac{\partial{C_m}}{\partial{x_j}}$$$ is the partial derivative of Cm with respect to quantification parameter $$$x_j$$$ and its associated standard deviation $$$\delta{x_j}$$$. The analytical solution of each partial derivative is listed in Figure 1. This study employs a range of reported standard deviations of parameters from literature (Figure 2, Figure 3). To isolate the effect of individual uncertainties on Cm, constants resembling in vivo MR spectroscopy at 3T were chosen for each partial derivative: Am=1, Sw=1, TE=0.02s, TR=2s, and Cw,i = 0.745, 0.615, 1 for grey matter, white matter and CSF15, respectively. A hypothesized uncertainty range of 1-5% is used for water concentration (Sw, Cw,i), and similarly 1 ns to 1 μs for hardware-specific parameters ($$$\delta{TE}$$$, $$$\delta{TR}$$$). Extrema values of the reported uncertainties were used to estimate upper and lower bounds of $$$\delta{C_m}$$$.
Results and Discussion
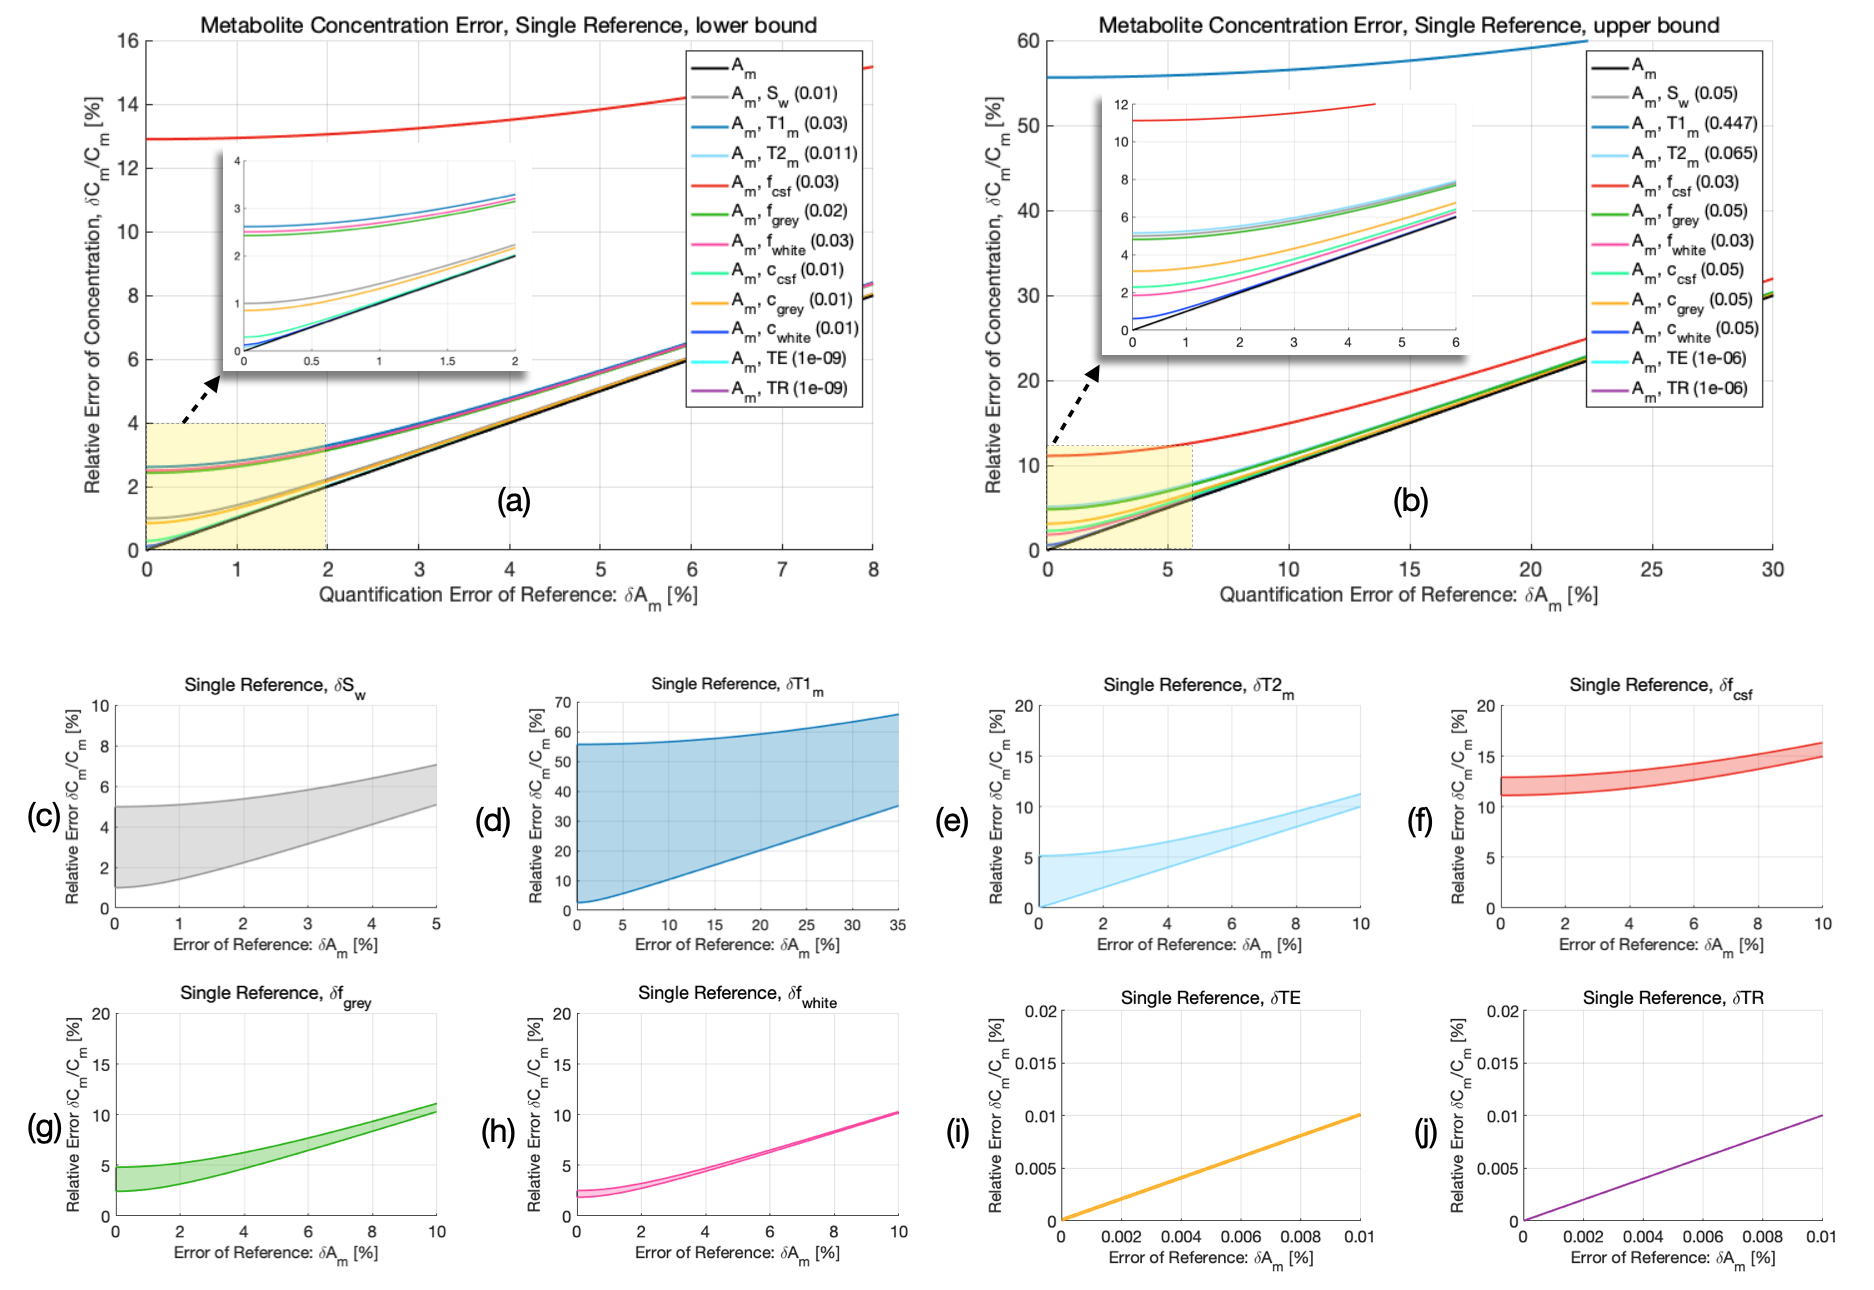
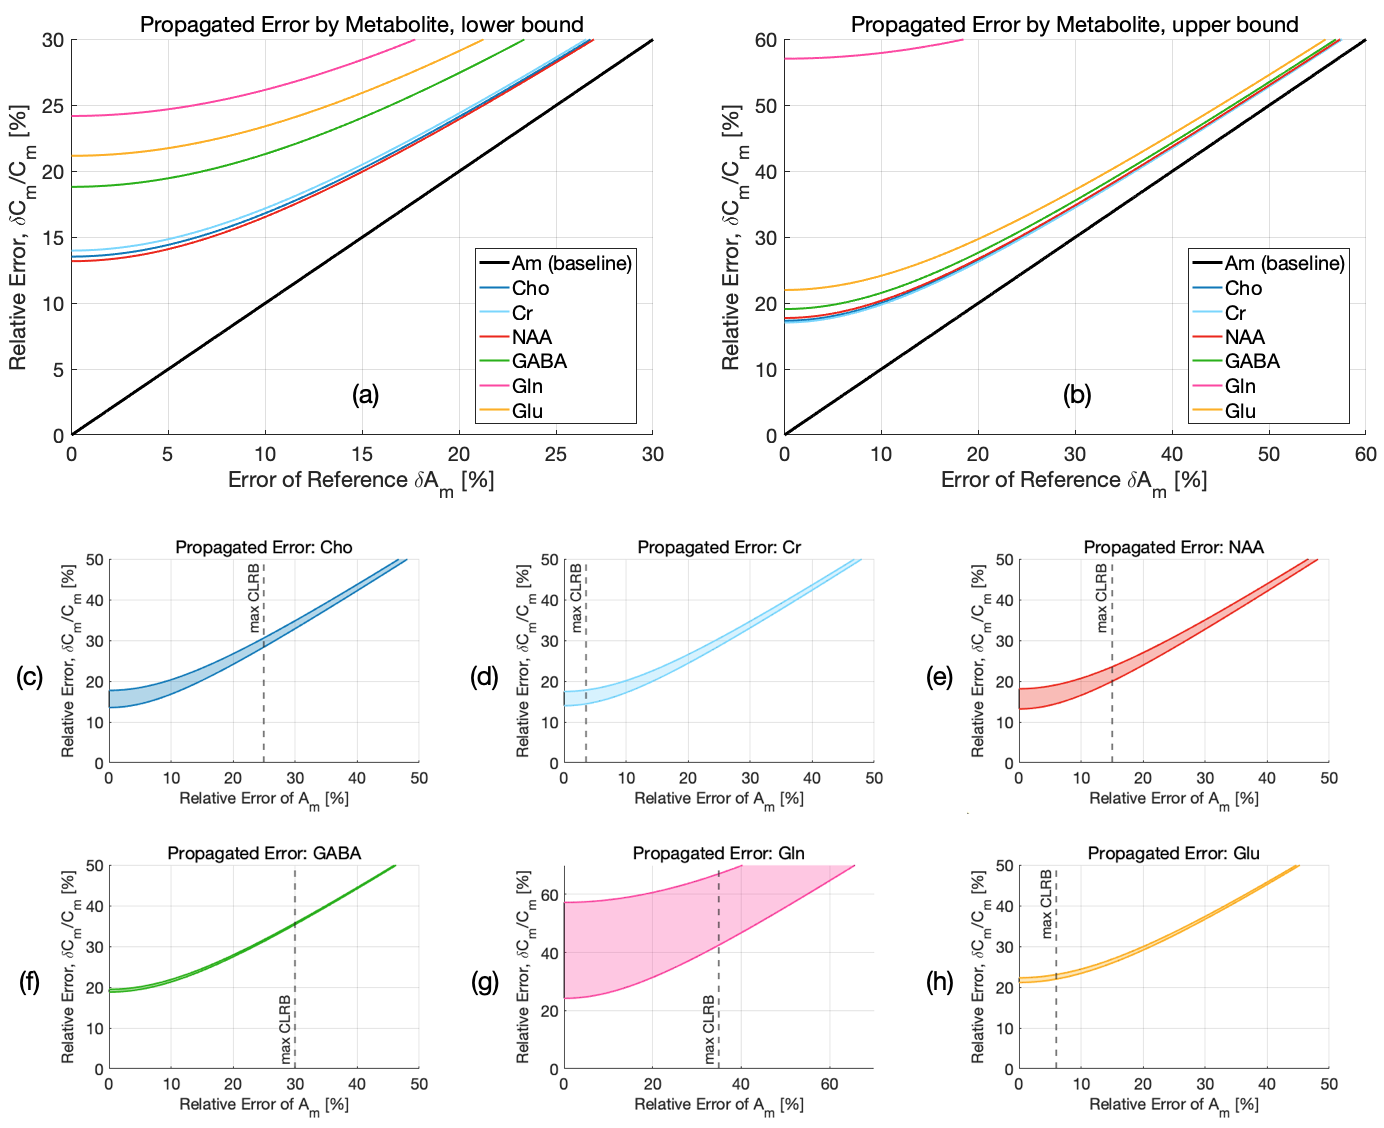
A comparison between the relative contribution of each quantification parameter’s uncertainty and the baseline error estimate using the CRLB of the metabolite $$$\delta{A_m}$$$ is shown in Figure 4. Hardware-specific parameters (e.g. TE, TR) show negligible impact on the overall error using even conservative estimates of timing uncertainties, whereas those with a larger range (e.g. T1m, Sw) or those whose partial derivatives greatly influence error propagation (e.g. fCSF), show greater contributions, with error increases as high as 56% for T1m, 5% for T2m, 13% for fCSF, 2% for fwhite, 4% for fgrey, and .6-3% for Cw,i. A comparison of error ranges for various metabolites is shown in Figure 5, with increases as high as 57% for Gln, 19% for GABA, 22% for Glu, and 18% for NAA, Cr, and Cho.The range of contributions to $$$\delta{C_m}$$$ from various parameters demonstrates a need to carefully consider whether potential error sources in quantification are truly negligible, since CRLBs often underestimate the propagated uncertainty by a considerable margin. Additional details, such as the effect of suboptimal RF flip angles, can be included in this framework. Potential systematic error, including the use of incomplete models for LCM6,22, the inherent limitations of relative CRLBs as an uncertainty estimate23, limited sequence performance or other events (e.g. erroneous timing, subject movement, hardware failure) are ignored. This approach also assumes normally distributed variances and negligible parameter covariances. The propagated uncertainty is also heavily parameter-dependent and will ultimately vary across experiments, affected by the region of interest, voxel size, and sequence TE, with shorter TEs generally reducing CRLBs through increased SNR2.
Conclusion
The accuracy of metabolite quantification is shown to be systematically overestimated if measurement uncertainties of various quantification-dependent parameters are not considered. Since measurement uncertainties are added in quadrature, the propagated error increases monotonically with each error source, compounding on estimates made using only CRLBs by varying degrees across metabolites. The results of this study should motivate investigators to consider multiple sources of potential error in studies that report metabolite concentrations derived from in vivo MR spectroscopy.Acknowledgements
No acknowledgement found.References
1. Provencher SW: Estimation of metabolite concentrations from localizedin vivo proton NMR spectra. Magn Reson Med 1993; 30:672–679.
2. Landheer K, Gajdošík M, Juchem C: A semi‐LASER, single‐voxel spectroscopic sequence with a minimal echo time of 20.1 ms in the human brain at 3 T. NMR in Biomedicine 2020; 33.
3. Bolliger CS, Boesch C, Kreis R: On the use of Cramér–Rao minimum variance bounds for the design of magnetic resonance spectroscopy experiments. NeuroImage 2013; 83:1031–1040.
4. Zhang Y, Taub E, Mueller C, et al.: Reproducibility of whole‐brain temperature mapping and metabolite quantification using proton magnetic resonance spectroscopy. NMR in Biomedicine 2020; 33.
5. Terpstra M, Cheong I, Lyu T, et al.: Test-retest reproducibility of neurochemical profiles with short-echo, single-voxel MR spectroscopy at 3T and 7T: Test-Retest Reproducibility of Neurochemical Profiles at 3T and 7T. Magn Reson Med 2016; 76:1083–1091.
6. Landheer K, Juchem C. Are Cramér‐Rao lower bounds an accurate estimate for standard deviations in in vivo magnetic resonance spectroscopy? NMR in Biomedicine 2021; 34.
7. Taylor BN, Kuyatt CE. Guidelines for Evaluating and Expressing the Uncertainty of NIST Measurement Results. NIST Technical Note 1297. Gaithersburg, MD: United States Department of Commerce, Technology Administration, National Institute of Standards and Technology; 1994.
8. Waters RW, Huyse L, Uncertainty Analysis for Fluid Mechanics with Applications. ICASE Report No. 2002-1. Hampton, Virginia: Institute for Computer Applications in Science and Engineering, NASA Langley Research Center; 2002.
9. Behrens TEJ, Woolrich MW, Jenkinson M, et al.: Characterization and propagation of uncertainty in diffusion-weighted MR imaging. Magn Reson Med 2003; 50:1077–1088.
10. Walter J, Lawrence W, Elder D, Treece M: Development of an Uncertainty Model for the National Transonic Facility (Invited). In 27th AIAA Aerodynamic Measurement Technology and Ground Testing Conference. Chicago, Illinois: American Institute of Aeronautics and Astronautics; 2010.
11. Lu H, Nagae-Poetscher LM, Golay X, Lin D, Pomper M, van Zijl PCM: Routine clinical brain MRI sequences for use at 3.0 Tesla. J Magn Reson Imaging 2005; 22:13–22.
12. Wansapura JP, Holland SK, Dunn RS, Ball WS: NMR relaxation times in the human brain at 3.0 tesla. J Magn Reson Imaging 1999; 9:531–538.
13. Bottomley PA, Foster TH, Argersinger RE, Pfeifer LM: A review of normal tissue hydrogen NMR relaxation times and relaxation mechanisms from 1-100 MHz: Dependence on tissue type, NMR frequency, temperature, species, excision, and age: Review Article: NMR relaxation in tissue. Med Phys 1984; 11:425–448.
14. Stanisz GJ, Odrobina EE, Pun J, et al.: T1, T2 relaxation and magnetization transfer in tissue at 3T. Magn Reson Med 2005; 54:507–512.
15. Ernst T, Kreis R, Ross BD: Absolute Quantitation of Water and Metabolites in the Human Brain. I. Compartments and Water. Journal of Magnetic Resonance, Series B 1993; 102:1–8.
16. De Vis JB, Zwanenburg JJ, van der Kleij LA, et al.: Cerebrospinal fluid volumetric MRI mapping as a simple measurement for evaluating brain atrophy. Eur Radiol 2016; 26:1254–1262.
17. Andreychenko A, Klomp DWJ, de Graaf RA, Luijten PR, Boer VO: In vivo GABA T2 determination with J-refocused echo time extension at 7 T: GABA T2 measurement at 7T. NMR Biomed 2013; 26:1596–1601.
18. Mlynárik V, Gruber S, Moser E: Proton T1 and T2 relaxation times of human brain metabolites at 3 Tesla. NMR Biomed 2001; 14:325–331.
19. Landheer K, Sahgal A, Myrehaug S, Chen AP, Cunningham CH, Graham SJ: A rapid inversion technique for the measurement of longitudinal relaxation times of brain metabolites: application to lactate in high-grade gliomas at 3 T: Lactate T 1 Measurement in High-Grade Gliomas. NMR Biomed 2016; 29:1381–1390.
20. Li Y, Srinivasan R, Ratiney H, Lu Y, Chang SM, Nelson SJ: Comparison of T1 and T2 metabolite relaxation times in glioma and normal brain at 3T. J Magn Reson Imaging 2008; 28:342–350.
21. Puts NAJ, Barker PB, Edden RAE: Measuring the longitudinal relaxation time of GABA in vivo at 3 tesla. J Magn Reson Imaging 2013; 37:999–1003.
22. Elster C, Schubert F, Link A, Walzel M, Seifert F, Rinneberg H: Quantitative magnetic resonance spectroscopy: Semi-parametric modeling and determination of uncertainties. Magn Reson Med 2005; 53:1288–1296.
23. Kreis R: The trouble with quality filtering based on relative Cramér-Rao lower bounds: The Trouble with Quality Filtering Based on Relative CRLB. Magn Reson Med 2016; 75:15–18.
24. Steel A, Chiew M, Jezzard P, et al.: Metabolite-cycled density-weighted concentric rings k-space trajectory (DW-CRT) enables high-resolution 1 H magnetic resonance spectroscopic imaging at 3-Tesla. Sci Rep 2018; 8:7792.
Figures