5039
Impact of Fat Droplet Sizes on R2* in Fat-Iron phantoms for Accurate Assessment of Hepatic Steatosis and Iron Overload Using MRI
Sarah Caroline Brasher1, Cara Morin2, and Aaryani Tipirneni-Sajja1,2
1Biomedical Engineering, University of Memphis, Memphis, TN, United States, 2St. Jude Children's Research Hospital, Memphis, TN, United States
1Biomedical Engineering, University of Memphis, Memphis, TN, United States, 2St. Jude Children's Research Hospital, Memphis, TN, United States
Synopsis
R2* correction is necessary for improving the accuracy of fat fraction quantification in assessing steatosis. However, the dephasing effects of concurrent iron overload may be dependent on the size of iron and fat particles. In this study, we controlled the size of fat droplets in fat-iron emulsion phantoms by traditional stir bar methods and homogenization. R2* and far fraction (FF) values were estimated with multi-spectral models that assume a common or independent R2* for water and fat. Our results show that R2* was slightly reduced in homogenized phantoms at higher fat fractions compared to stir bar phantoms.
Introduction
Hepatic steatosis is a growing global concern that is often concurrent with iron overload, creating many morphological disturbances in the liver. In measuring hepatic steatosis, R2* correction is needed to improve the accuracy in quantification of fat fraction (FF).1 The current methods are single R2* correction (implies that water and fat share the same R2* and dual model R2* correction in which water and fat are independent. The use of both R2* correction models in the combined presence of iron and fat depends on the dephasing effects of iron deposits on water and fat protons, creating a dependence on the size and distribution of iron and fat particles.2 The size of in vivo hepatic fat droplets normally does not exceed 15-25 µm in diameter.3 However, current imaging phantoms that emulate hepatic steatosis often do not control the size of fat droplets and exceed the in vivo threshold.4 The primary goal of this study is to analyze the impact of fat droplet size on the response of R2* water and fat values in the presence of iron and fat and with respect to quantitative MRI.Methods
Homogeneous fat-water-iron emulsion phantoms were produced at fat fractions of 0%, 10%, 20%, 30%, and 40% at iron concentrations of 0%, 0.0075%, 0.025%, and 0.06%. One set of phantoms was homogenized using a Benchmark Scientific D1000 homogenizer with a 10mm x 115mm saw tooth generator probe at approximately 15000 rpm, and the second set was mixed with a stir bar and magnetic hot plate at 1400 rpm. The fat source of these phantoms consisted of peanut oil emulsified with 43mM SDS. The iron nanoparticles (Bionized NanoFerrite, Micromod, Rostock, Germany) of concentration 29.2 mg/ml were held in suspension using 2% agar and were supplemented with 0.5 mM CuSO4 and 43 mM NaCl. A total of 40 phantoms were created (5 fat fractions x 4 iron concentrations x 2 sets). Fat droplet sizes were characterized with bright field light microscopy (Olympus BX-63) and quantified using the MorphoLibJ plugin on ImageJ.5 Magnetic resonance imaging was performed at 1.5T (MAGNETOM Avantofit, Siemens) using 2D GRE sequences with a monopolar gradient. Single R2* correction was performed with a mono-exponential model and NLSQ (Non-linear Least Squares) while dual R2* model was implemented with ARMA (Autoregressive Moving Average).6 Imaging parameters used included: TE1 = 1.2 ms, Echo Spacing= 1.44 ms, TR=200ms, echo train length=20, flip=35°, 104x128 matrix, and 5mm slices. MATLAB (R2020b) was used for ROI selection and R2*, fat fraction, and iron quantification.Results & Discussion
The mean diameter size of the fat droplets was 14.31µm for the stir bar phantoms and 5.79µm for the homogenized phantoms as seen on Figure 1. Unlike prior literature findings in which mean fat droplet diameters were greater than 50µm, the mean fat droplet diameters of the traditional stir bar methods fell within the in vivo hepatocyte morphology range of less than 20µm, while the homogenized phantoms fell far below this value.4 The phantoms were processed through MATLAB to determine R2* values and FF by selecting ROI’s and finding the mean and standard deviation of each selection. As shown on Figure 2, increasing iron concentrations from 0% to 0.06% showed an increase in R2*. On Figure 4, the stir bar phantoms showed that higher FF’s have higher R2* values for all three R2* models, but the homogenized phantoms showed decreased R2* values for the mono exponential and ARMA models. This may be due to the reduced size of fat droplets in homogenized phantoms altering the distribution of iron particles. Figure 3 shows a comparison of the predicted FF against the estimated FF in both the NLSQ and ARMA models. At higher iron concentrations, both models failed to quantify FF accurately, however, the NLSQ model appeared to predict the FF slightly better than the ARMA model. This coincides with previous research in which NLSQ outperformed ARMA at high FF and high iron.6Conclusion
Our study demonstrates that homogenization indeed decreases fat droplet size in MRI phantoms and decreases R2* (s-1), but this must be compared to in vivo R2* and FF data to determine if homogenization will provide a realistic tissue model of steatosis and iron overload in phantoms.Acknowledgements
This project was funded by the National Institutes of Health (NIH) grant #1R21EB031298. The authors thank St. Jude Children’s Research Hospital for allowing the use of the MRI scanner.References
1. Meisamy, S., Hines, C. D. G., Hamilton, G., Sirlin, C. B., McKenzie, C. A., Yu, H., Brittain, J. H., & Reeder, S. B. (2011, March). Quantification of hepatic steatosis with T1-independent, T2-corrected MR imaging with spectral modeling of fat: Blinded comparison with mr spectroscopy. Radiology. Retrieved November 9, 2021, from https://www.ncbi.nlm.nih.gov/pmc/articles/PMC3042638/. 2. Sirlin, C. B., & Reeder, S. B. (2010, August). Magnetic resonance imaging quantification of Liver Iron. Magnetic resonance imaging clinics of North America. Retrieved November 8, 2021, from https://www.ncbi.nlm.nih.gov/pmc/articles/PMC3430384/. 3. Jiang, X., Xu, J., & Gore, J. C. (2020, April 25). Mapping hepatocyte size in vivo using temporal diffusion spectroscopy MRI. Wiley Online Library. Retrieved November 8, 2021, from https://onlinelibrary.wiley.com/doi/10.1002/mrm.28299. 4. Hines, C. D. G., Yu, H., Shimakawa, A., McKenzie, C. A., Brittain, J. H., & Reeder, S. B. (2009, November). T1 independent, T2* corrected MRI with accurate spectral modeling for quantification of fat: Validation in a fat-water-spio phantom. Journal of magnetic resonance imaging : JMRI. Retrieved November 9, 2021, from https://www.ncbi.nlm.nih.gov/pmc/articles/PMC3205952/. 5. Legland D, Arganda-Carreras I, Andrey P, MorphoLibJ: integrated library and plugins for mathematical morphology with ImageJ, Bioinformatics, Volume 32, Issue 22, 15 November 2016, Pages 3532–3534 6. Tipirneni-Sajja, A., Krafft, A. J., Loeffler, R. B., Song, R., Bahrami, A., Hankins, J. S., & Hillenbrand, C. M. (2019, February 13). Autoregressive moving average modeling for hepatic iron quantification in the presence of fat. Wiley Online Library. Retrieved November 9, 2021, from https://onlinelibrary.wiley.com/doi/10.1002/jmri.26682.Figures

Bright Field microscopy images of 40% FF,
0% iron phantoms mixed with a stir bar (Left) and homogenizer (Right). The average
sizes of the fat droplets in the stir bar and homogenized phantoms are 14.31µm
and 5.79µm,
respectively.

R2* models for stir bar (top) and homogenized (bottom) phantoms displaying
iron concentrations (0%, 0.0075%, 0.025%, and 0.06%) vs. R2*. All three models for
both sets of phantoms showed increasing R2* as the iron concentration
increased.
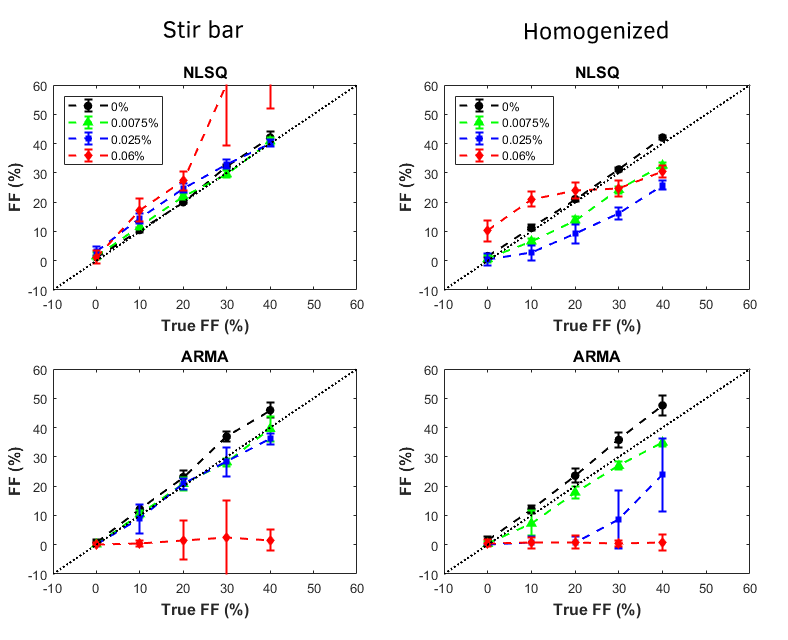
NLSQ and ARMA models for stir bar (left) and homogenized (right) phantoms
displaying predicted FF vs. measured FF. R2*. All models failed in predicting FFs
for higher iron concentrations.

R2* maps for mono-exponential, NLSQ, and ARMA
models for homogenized and stir bar phantoms are shown. The R2* maps look more
homogeneous for homogenized phantoms compared to stir bar phantoms for all
models.
DOI: https://doi.org/10.58530/2022/5039