5037
MR-Assisted PET Respiratory Motion Correction Using Deep-Learning Based Short-Scan Motion Fields1Washington University in St. Louis, Saint Louis, MO, United States, 2Siemens Healthcare GmbH, Erlangen, Germany, 3Siemens Medical Solutions USA, Saint Louis, MO, United States, 4Siemens Medical Solutions USA, Malvern, PA, United States
Synopsis
Respiratory motion causes signal blurring and image artifacts. Simultaneous PET/MRI allows for MR-assisted motion correction (MoCo) in PET imaging, leading to improved PET images for detection and evaluation of lesions. In this study, we proposed and examined a PET MoCo approach using motion vector fields (MVFs) from a deep-learning reconstructed MRI scan. MRI-based MVFs were derived from either 2000 spokes (MoCo2000, 5-6 minutes acquisition time) using a Fourier transform reconstruction or 200 spokes (MoCoP2P200, 30-40 seconds acquisition time) using a deep-learning Phase2Phase (P2P) reconstruction and then incorporated into PET MoCo reconstruction.
Introduction
Simultaneous PET/MRI MoCo (e.g., the Biograph mMR BodyCOMPASS application) requires a companion dedicated MRI motion modeling scan, e.g., a golden-angle stack-of-stars sequence, throughout the entire PET acquisition duration for deriving 3D deformable MVFs 1,2. This requirement reduces the overall PET/MRI efficiency. Therefore, a rapid motion modeling MRI scan is highly desirable. In this study, we tested the proposed PET MoCo approach by using MVFs obtained from a P2P-reconstructed short MRI scan (30-40 seconds) in a patient study. The deep learning P2P network was trained using only noisy images with artifacts to reconstruct 4D respiratory motion-resolved MRIs from highly under-sampled MRI data 3. We also examined whether the proposed method would provide comparable results to PET MoCo using MVFs obtained from a multi-coil nonuniform inverse fast Fourier transform (MCNUFFT)-reconstructed 4 long MRI scan (5-6 minutes) with various quantitative and qualitative PET metrics as endpoints.Methods
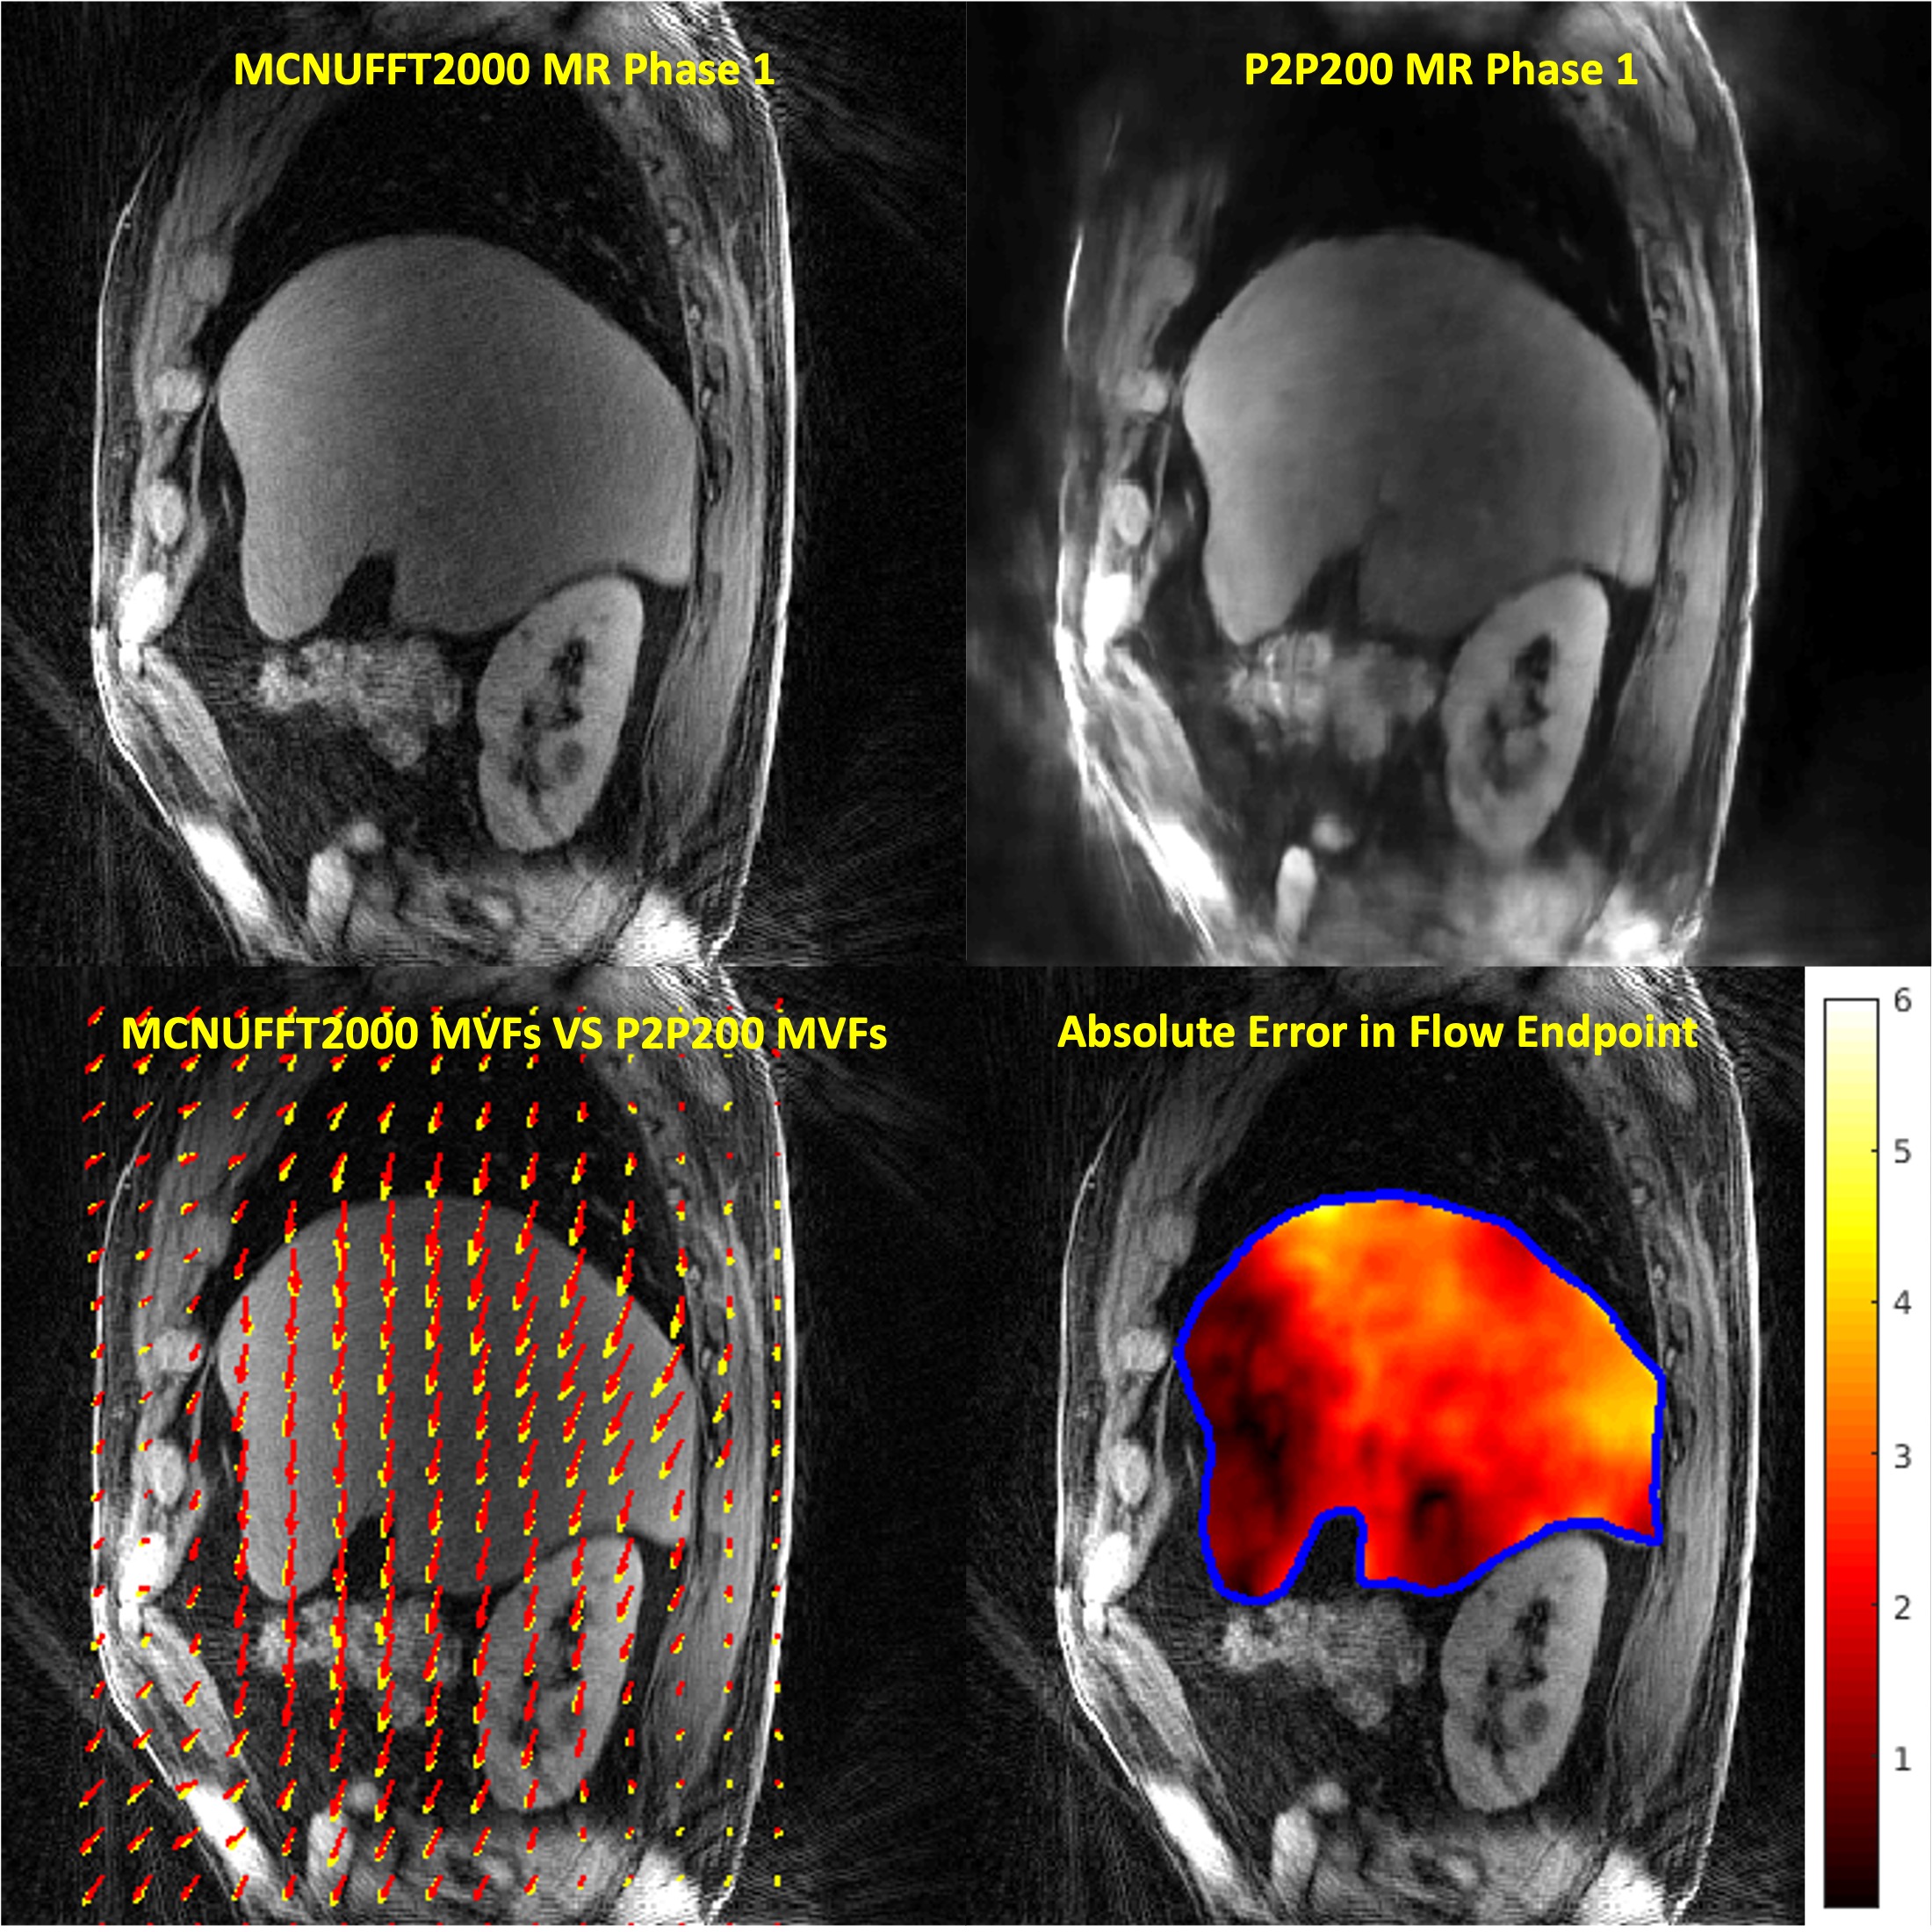
The retrospective analysis was conducted using PET/MRI images acquired from six oncological liver patients for a total of 49 lesions using a 3T PET/MRI (Biograph mMR, Siemens Healthcare) scanner with IRB approval and HIPAA compliance. Imaging data were acquired using CAPTURE5 in sagittal orientation. The imaging parameters were TE/TR=1.66ms/3.5ms, FOV=360mm×360mm, slice partial Fourier=6/8, 50% slice resolution, # slices=96-120, voxel size =1.125×1.125×3 mm3. Two thousand radial spokes (Acq. time: 5:02min – 6:33min) and two hundred radial spokes (Acq. time: 30.2s – 39.3s) were acquired respectively. Eovist or Dotarem was administrated to the patients. Breath-hold VIBE MRI imaging was acquired and fused with PET. The k-space data were binned into 10 respiratory phases based on the 1D respiratory curve obtained from the CAPTURE. Two image reconstruction methods, including the MCNUFFT4 and the deep learning P2P, were used to obtain 4D respiratory motion-resolved MRIs. MCNUFFT was employed to reconstruct 4D MCNUFFT2000 MRI using all 2000 spokes. In contrast, the P2P reconstruction was applied to reconstruct 4D P2P200 MRI using only the first 200 spokes. In a previous study, the P2P network, adapted from the widely used U-Net architecture6, was trained using only noisy images with artifacts. Eight healthy participants were used for training and one for validation3. This previously trained P2P was then directly applied to the liver cancer patients’ data in the current study. A non-linear registration (ANTS)7 was employed on the MRIs to register all respiratory phases onto the end-expiration phase to obtain 3D deformable MVFs in the PET space. The difference in millimeters between two sets of in-plane MVFs [(u1, v1) vs (u2, v2)] was calculated based on the absolute error in flow endpoint (EE) used in Baker, Simon, et al8.$$ EE = \sqrt{\left(u_{1} - u_{2}\right)^{2} + \left(v_{1} - v_{2}\right)^{2}} $$
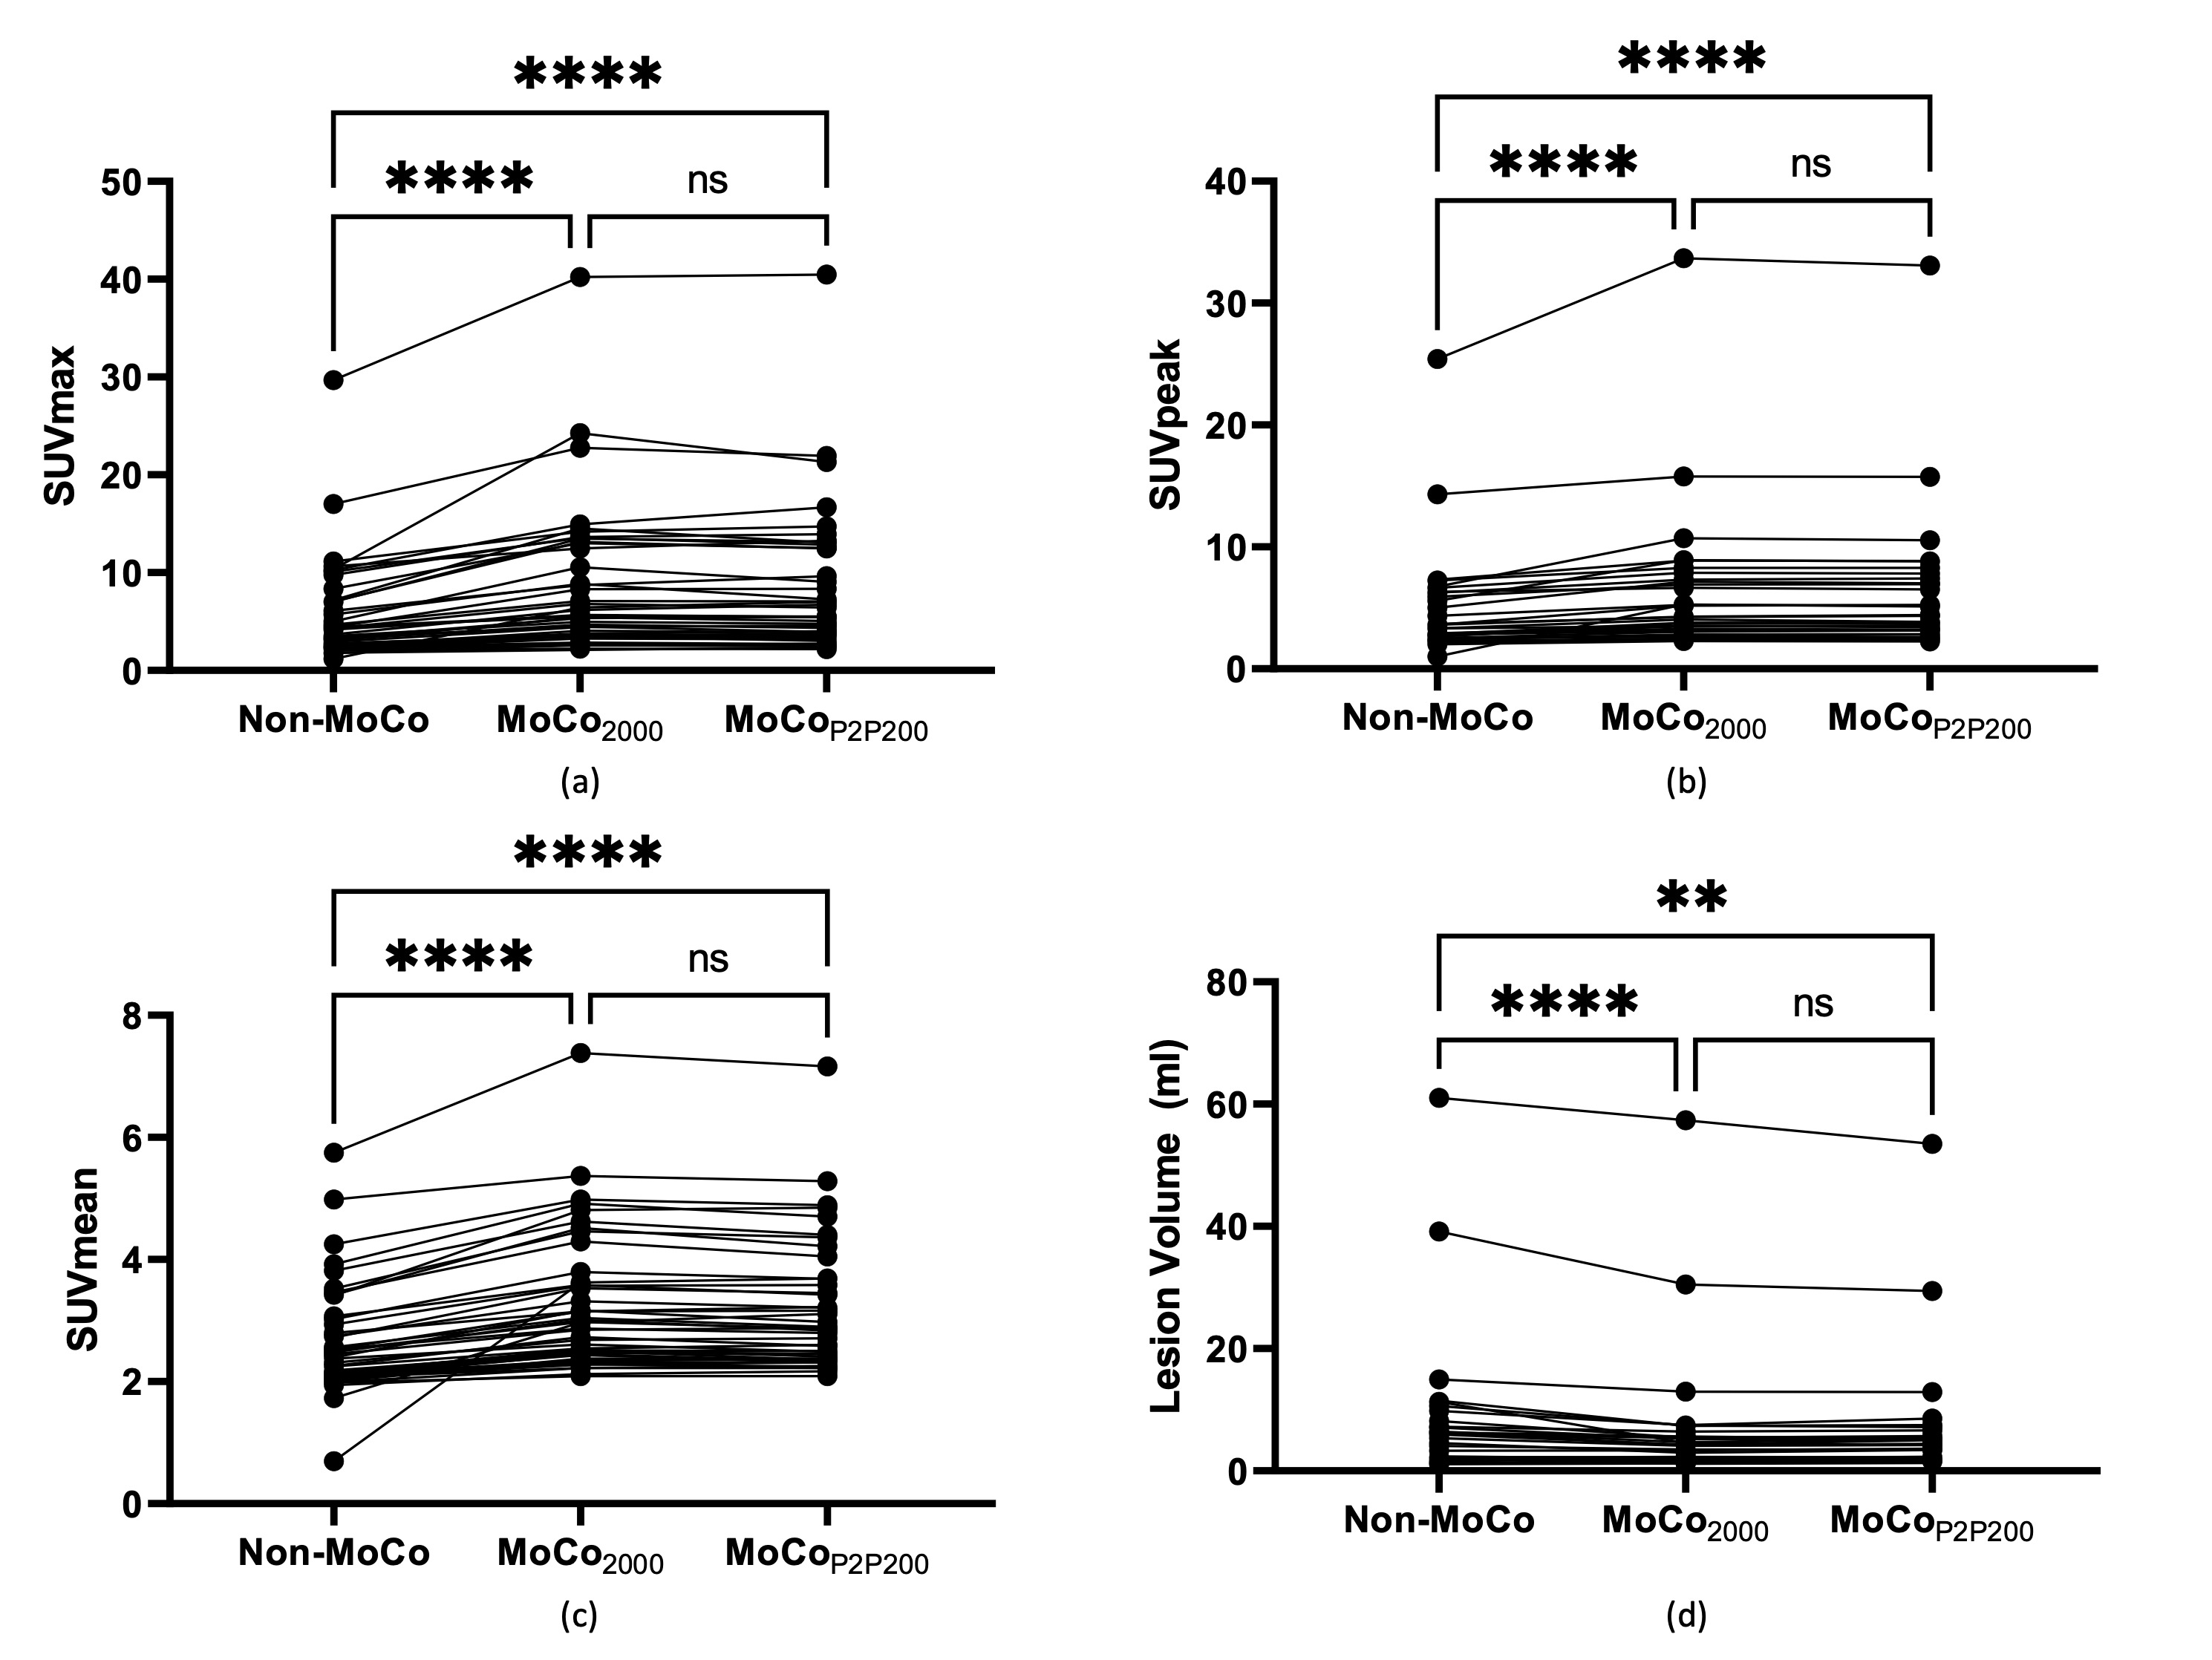
Three sets of PET images were then reconstructed: 1) non-MoCo PET: 3D-OSEM reconstruction without motion correction; 2) MoCo2000: MCIR (motion-compensated image reconstruction)9,10 using MVFs derived from MCNUFFT2000 MRI; and 3) MoCoP2P200: MCIR using MVFs derived from P2P200 MRI. A non-linear registration (ANTS)7 was performed between the breath-held Dixon water image and the end-of-expiration CAPTURE MRI to reduce attenuation correction artifacts related to different respiratory phases. In the MCIR MoCo PET reconstruction, the magnitude of the MRI-derived respiratory motion curve was used to bin the simultaneously acquired PET list mode data into 10 sinograms based on the phase of respiratory motion. These 10 sinograms and their corresponding MRI-derived MVFs were then used in the iterative MCIR reconstruction to obtain MoCo PET images. Non-MoCo, MoCo2000, and MoCoP2P200 were compared in terms of SUVmax, SUVpeak, SUVmean, and lesion volume in the native PET space. Two radiologists blinded to the reconstruction methods scored lesions independently in terms of lesion conspicuity on a 5-point Likert scale.
Results
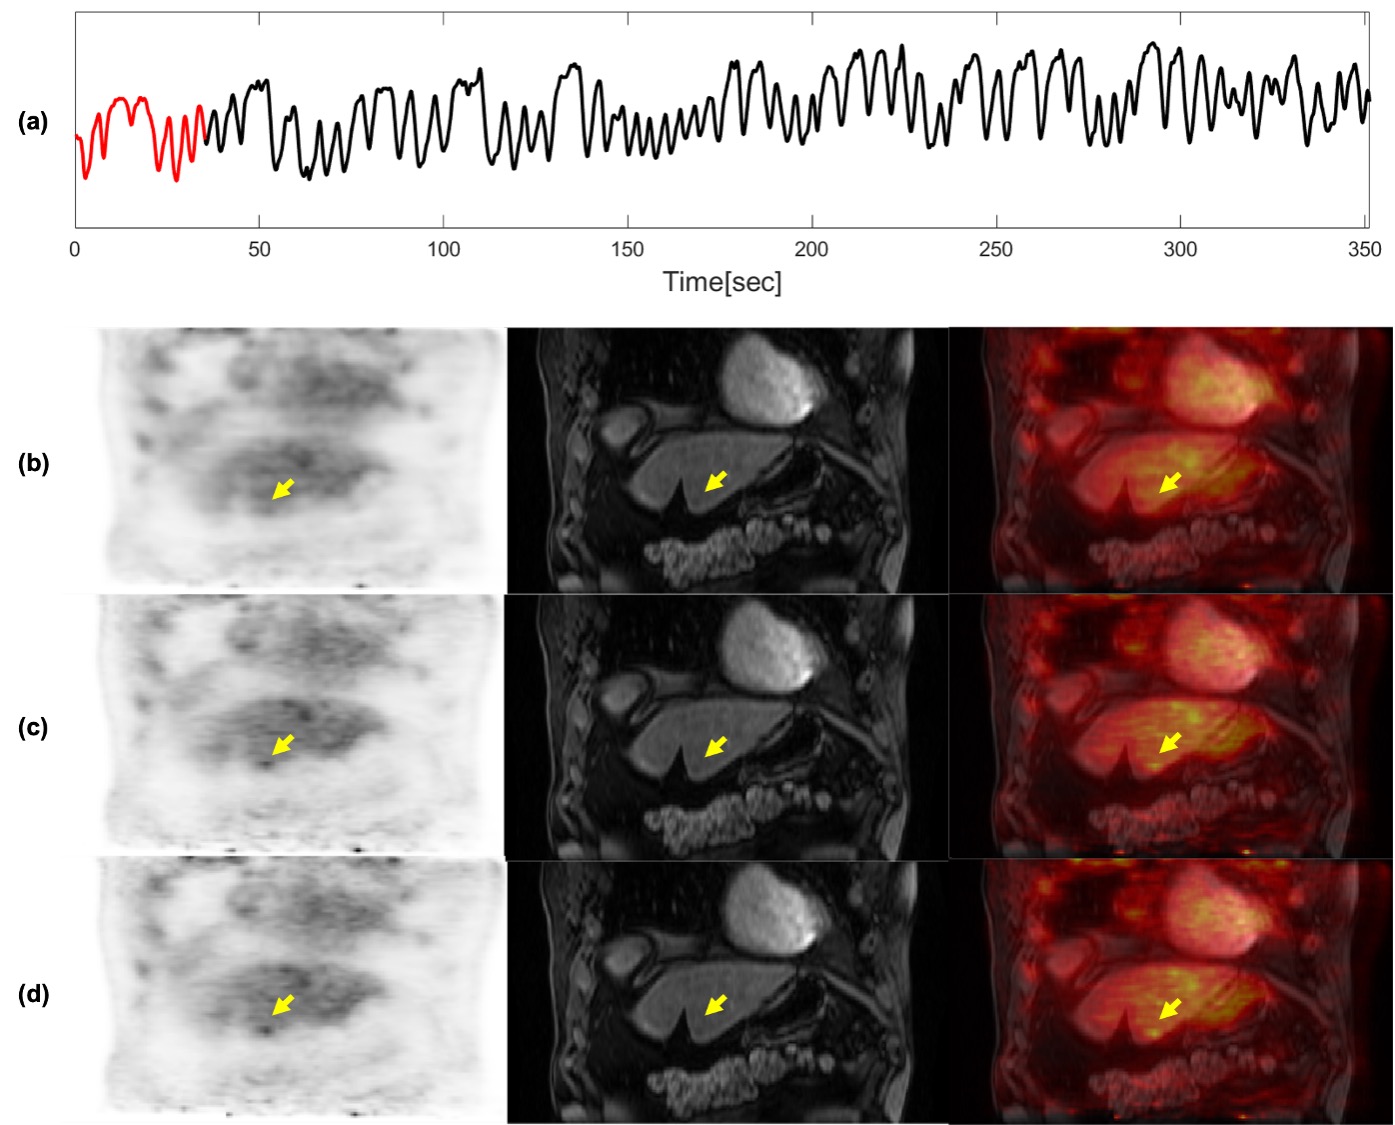
Images from phase 1 (end-of-expiration) of the 4D motion-resolved CAPTURE MRI acquisition, reconstructed using MCNUFFT2000 and P2P200, are shown in Figure 1 (upper row). The differences between MCNUFFT2000 MVFs and P2P200 MVFs are visualized in Figure 1 (lower row). The spaghetti plots of SUVmax, SUVpeak, SUVmean, and lesion volume are shown in Figure 2. The analyzed lesions had significantly higher SUVmax, SUVpeak, SUVmean, and significantly lower lesion volume on the MoCo2000 and MoCoP2P200 than on the non-MoCo PET images. There was no statistical difference between MoCo2000 and MoCoP2P200 with respect to SUVmax, SUVpeak, SUVmean, or lesion volume. The mean rater conspicuity scores across reconstructions are summarized in a box plot shown in Figure 3. Figure 4 and 5 show non-MoCo, MoCo2000, and MoCoP2P200 images from two liver cancer patients.Discussion and Conclusion
Our results demonstrated that aligning breath-hold m map and free breathing PET data and incorporating MRI-derived MVFs in PET MoCo reconstruction improved SUVs and lesion conspicuity. Moreover, some liver lesions seen by both readers on the motion-corrected PET images were completely invisible to both readers on the non-motion-corrected PET images. Thus, motion-corrected PET images may enable radiologists to identify otherwise occult malignant liver lesions, potentially altering clinical management decisions.Furthermore, we have shown that MoCoP2P200 and MoCo2000 provided similar increases in various SUV metrics compared to non-MoCo, demonstrating that the MVFs derived using only a 30-40 seconds MRI motion model scan (i.e., MoCoP2P200) was adequate. Our results showed that a short MRI motion modeling scan reconstructed using a deep learning P2P network can improve the overall imaging efficiency.
Acknowledgements
We acknowledge Siemens Healthineers for providing funding to this study.References
1. Grimm R, Fürst S, Souvatzoglou M, Forman C, Hutter J, Dregely I, Ziegler SI, Kiefer B, Hornegger J, Block KT, Nekolla SG. Self-gated MRI motion modeling for respiratory motion compensation in integrated PET/MRI. Medical image analysis 2015;19(1):110-120
2. Grimm R, Fürst S, Dregely I, Forman C, Hutter JM, Ziegler SI, Nekolla S, Kiefer B, Schwaiger M, Hornegger J, Block T. Self-gated Radial MRI for Respiratory Motion Compensation on Hybrid PET/MR Systems. International Conference on Medical Image Computing and Computer-Assisted Intervention; 2013; Berlin, Heidelberg. Springer. p 17-24.
3. Eldeniz C, Gan W, Chen S, Fraum TJ, Ludwig DR, Yan Y, Liu J, Vahle T, Krishnamurthy U, Kamilov US, An H. Phase2Phase: Respiratory Motion-Resolved Reconstruction of Free-Breathing Magnetic Resonance Imaging Using Deep Learning Without a Ground Truth for Improved Liver Imaging. Investigative Radiology 2021. doi:10.1097/rli.0000000000000792
4. Fessler JA, Sutton BP. Nonuniform fast Fourier transforms using min-max interpolation. IEEE transactions on signal processing 2003;51(2):560-574
5. Eldeniz C, Fraum T, Salter A, Chen Y, Gach HM, Parikh PJ, Fowler KJ, An H. CAPTURE: Consistently Acquired Projections for Tuned and Robust Estimation: A Self-Navigated Respiratory Motion Correction Approach. Investigative radiology 2018;53(5):293-305
6. Ronneberger O, Fischer P, Brox T. U-net: Convolutional networks for biomedical image segmentation. International Conference on Medical image computing and computer-assisted intervention; 2015. Springer. p 234-241.
7. Avants BB, Tustison N, Song G. Advanced normalization tools (ANTS). Insight j 2009;2(365):1-35
8. Baker S, Scharstein D, Lewis J, Roth S, Black MJ, Szeliski R. A database and evaluation methodology for optical flow. International journal of computer vision 2011;92(1):1-31
9. Hudson HM, Larkin RS. Accelerated image reconstruction using ordered subsets of projection data. IEEE transactions on medical imaging 1994;13(4):601-609
10. Qiao F, Pan T, Clark JW, Mawlawi OR. A motion-incorporated reconstruction method for gated PET studies. Physics in Medicine & Biology 2006;51(15):3769-3783
Figures