5023
Application of the template-based attenuation correction to simultaneous MR-PET brain imaging of non-human primates1Athinoula A. Martinos Center for Biomedical Imaging, Department of Radiology, Massachusetts General Hospital, Harvard Medical School, Charlestown, MA, United States, 2Biogen, Cambridge, MA, United States, 3Department of Nuclear Medicine and PET/CT-MRI Center, The First Affiliated Hospital of Jinan University & Institute of Molecular and Functional Imaging, Jinan University, Guangzhou, China, 4Division of Nuclear Medicine and Molecular Imaging, Department of Radiology, Massachusetts General Hospital, Harvard Medical School, Boston, MA, United States
Synopsis
The goal of this study was to generate a population-based template/atlas and apply the template/atlas-based attenuation correction (AC) method for simultaneous positron-emission-tomography/magnetic-resonance-imaging (PET/MRI) neuroimaging studies on non-human primates (NHPs). Population-based template/atlas of computed tomography image and anatomical MRI, were generated from ten NHPs (rhesus macaque). By using the generated template/atlas, the linear attenuation coefficient (LAC) of objects can be reliably derived, showing good differentiation for tissues, also skull and air. Comparison of the PET images reconstructed by the template/atlas-based and simple threshold-based AC has shown that the template/atlas-based AC can increase PET signal by avoiding overcompensation of attenuation.
Introduction
Researchers have pursued diagnostic advantages of integrated magnetic resonance imaging (MRI) and positron emission tomography (PET) system.1 For PET/MR hybrid system, an accurate attenuation correction (AC) for PET is an important for data quantification. To derive the linear attenuation coefficient (LAC) from the MR signal, the template-based AC approach has been proposed and applied for numbers of human brain PET/MR studies.2,3 The performance of this method was superior to other MR-based AC and was even comparable to the CT-based AC or transmission-based AC.2 However, the template-based AC have not been applied for PET/MR neuroimaging studies of non-human primate (NHP) brain. NHP is an important model for translational PET research, where pharmacological interventions are needed to confirm the performance of novel radiotracers. In addition, PET is the best tool to quantify target engagement of novel therapeutics noninvasively and in vivo; therefore, NHP models play an important role in drug development. The goal of this study was to generate a population-based template and apply the template-based AC method for simultaneous PET/MR brain imaging studies in NHPs.Materials and Methods
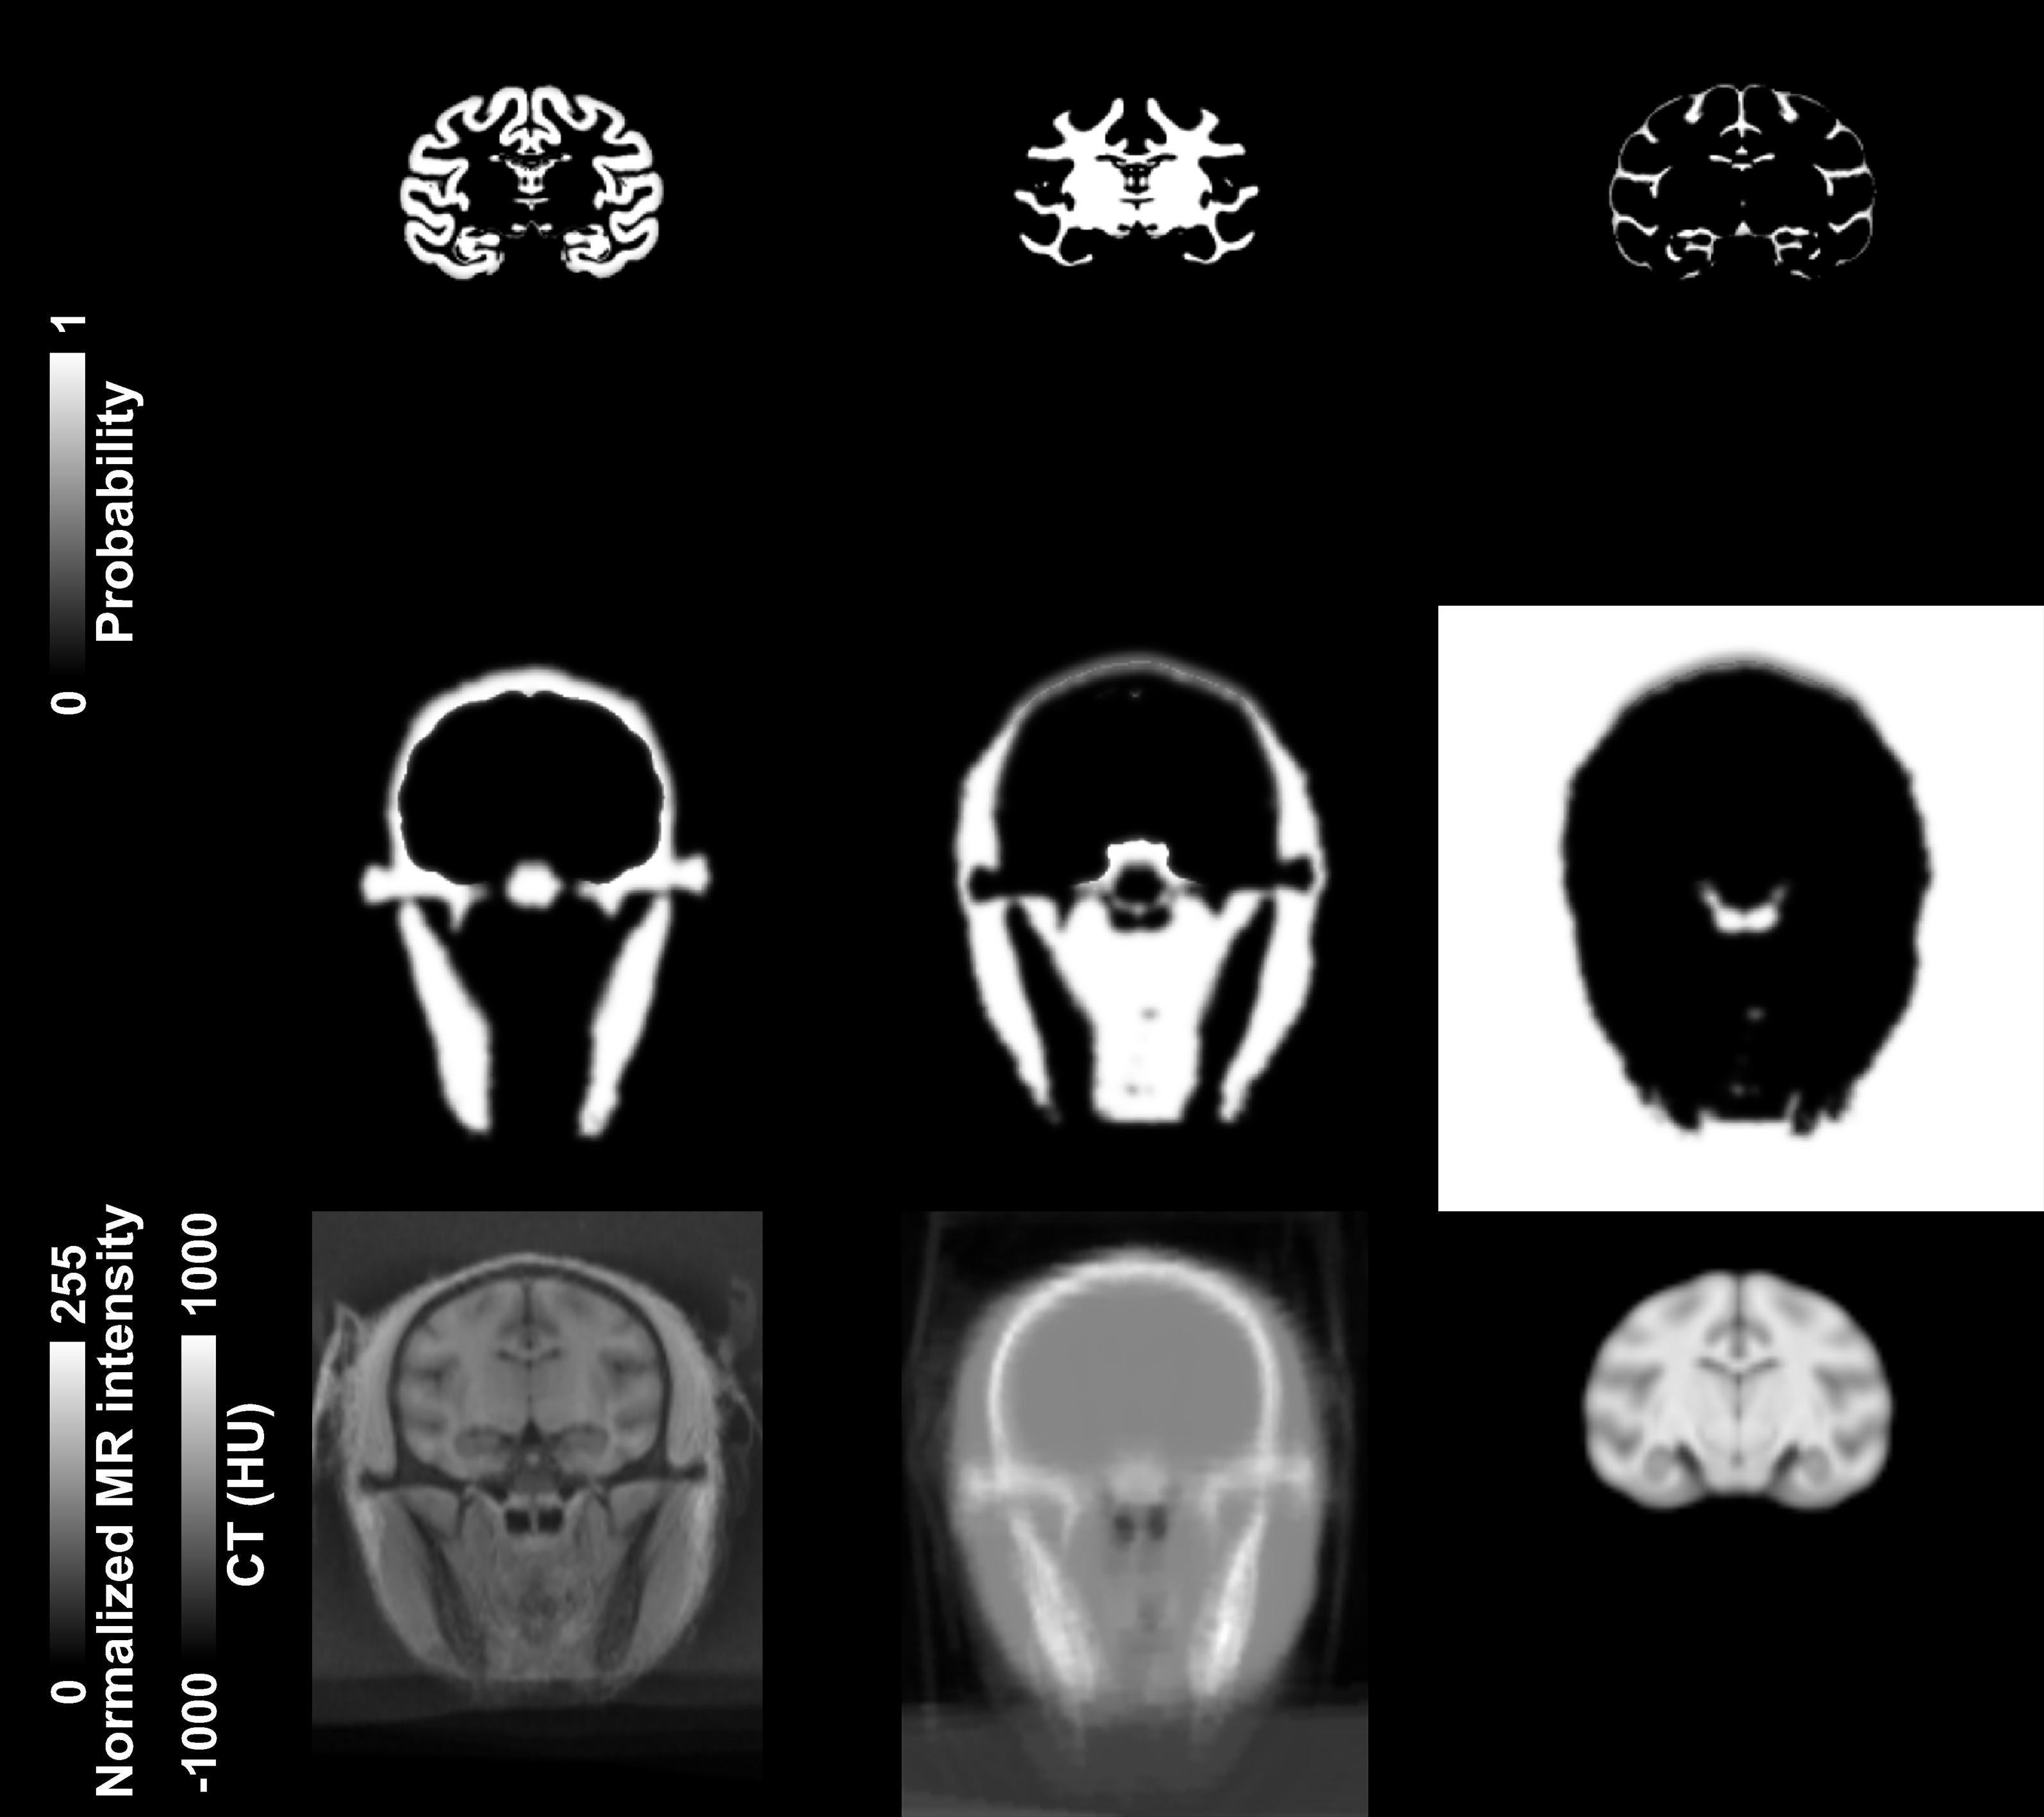
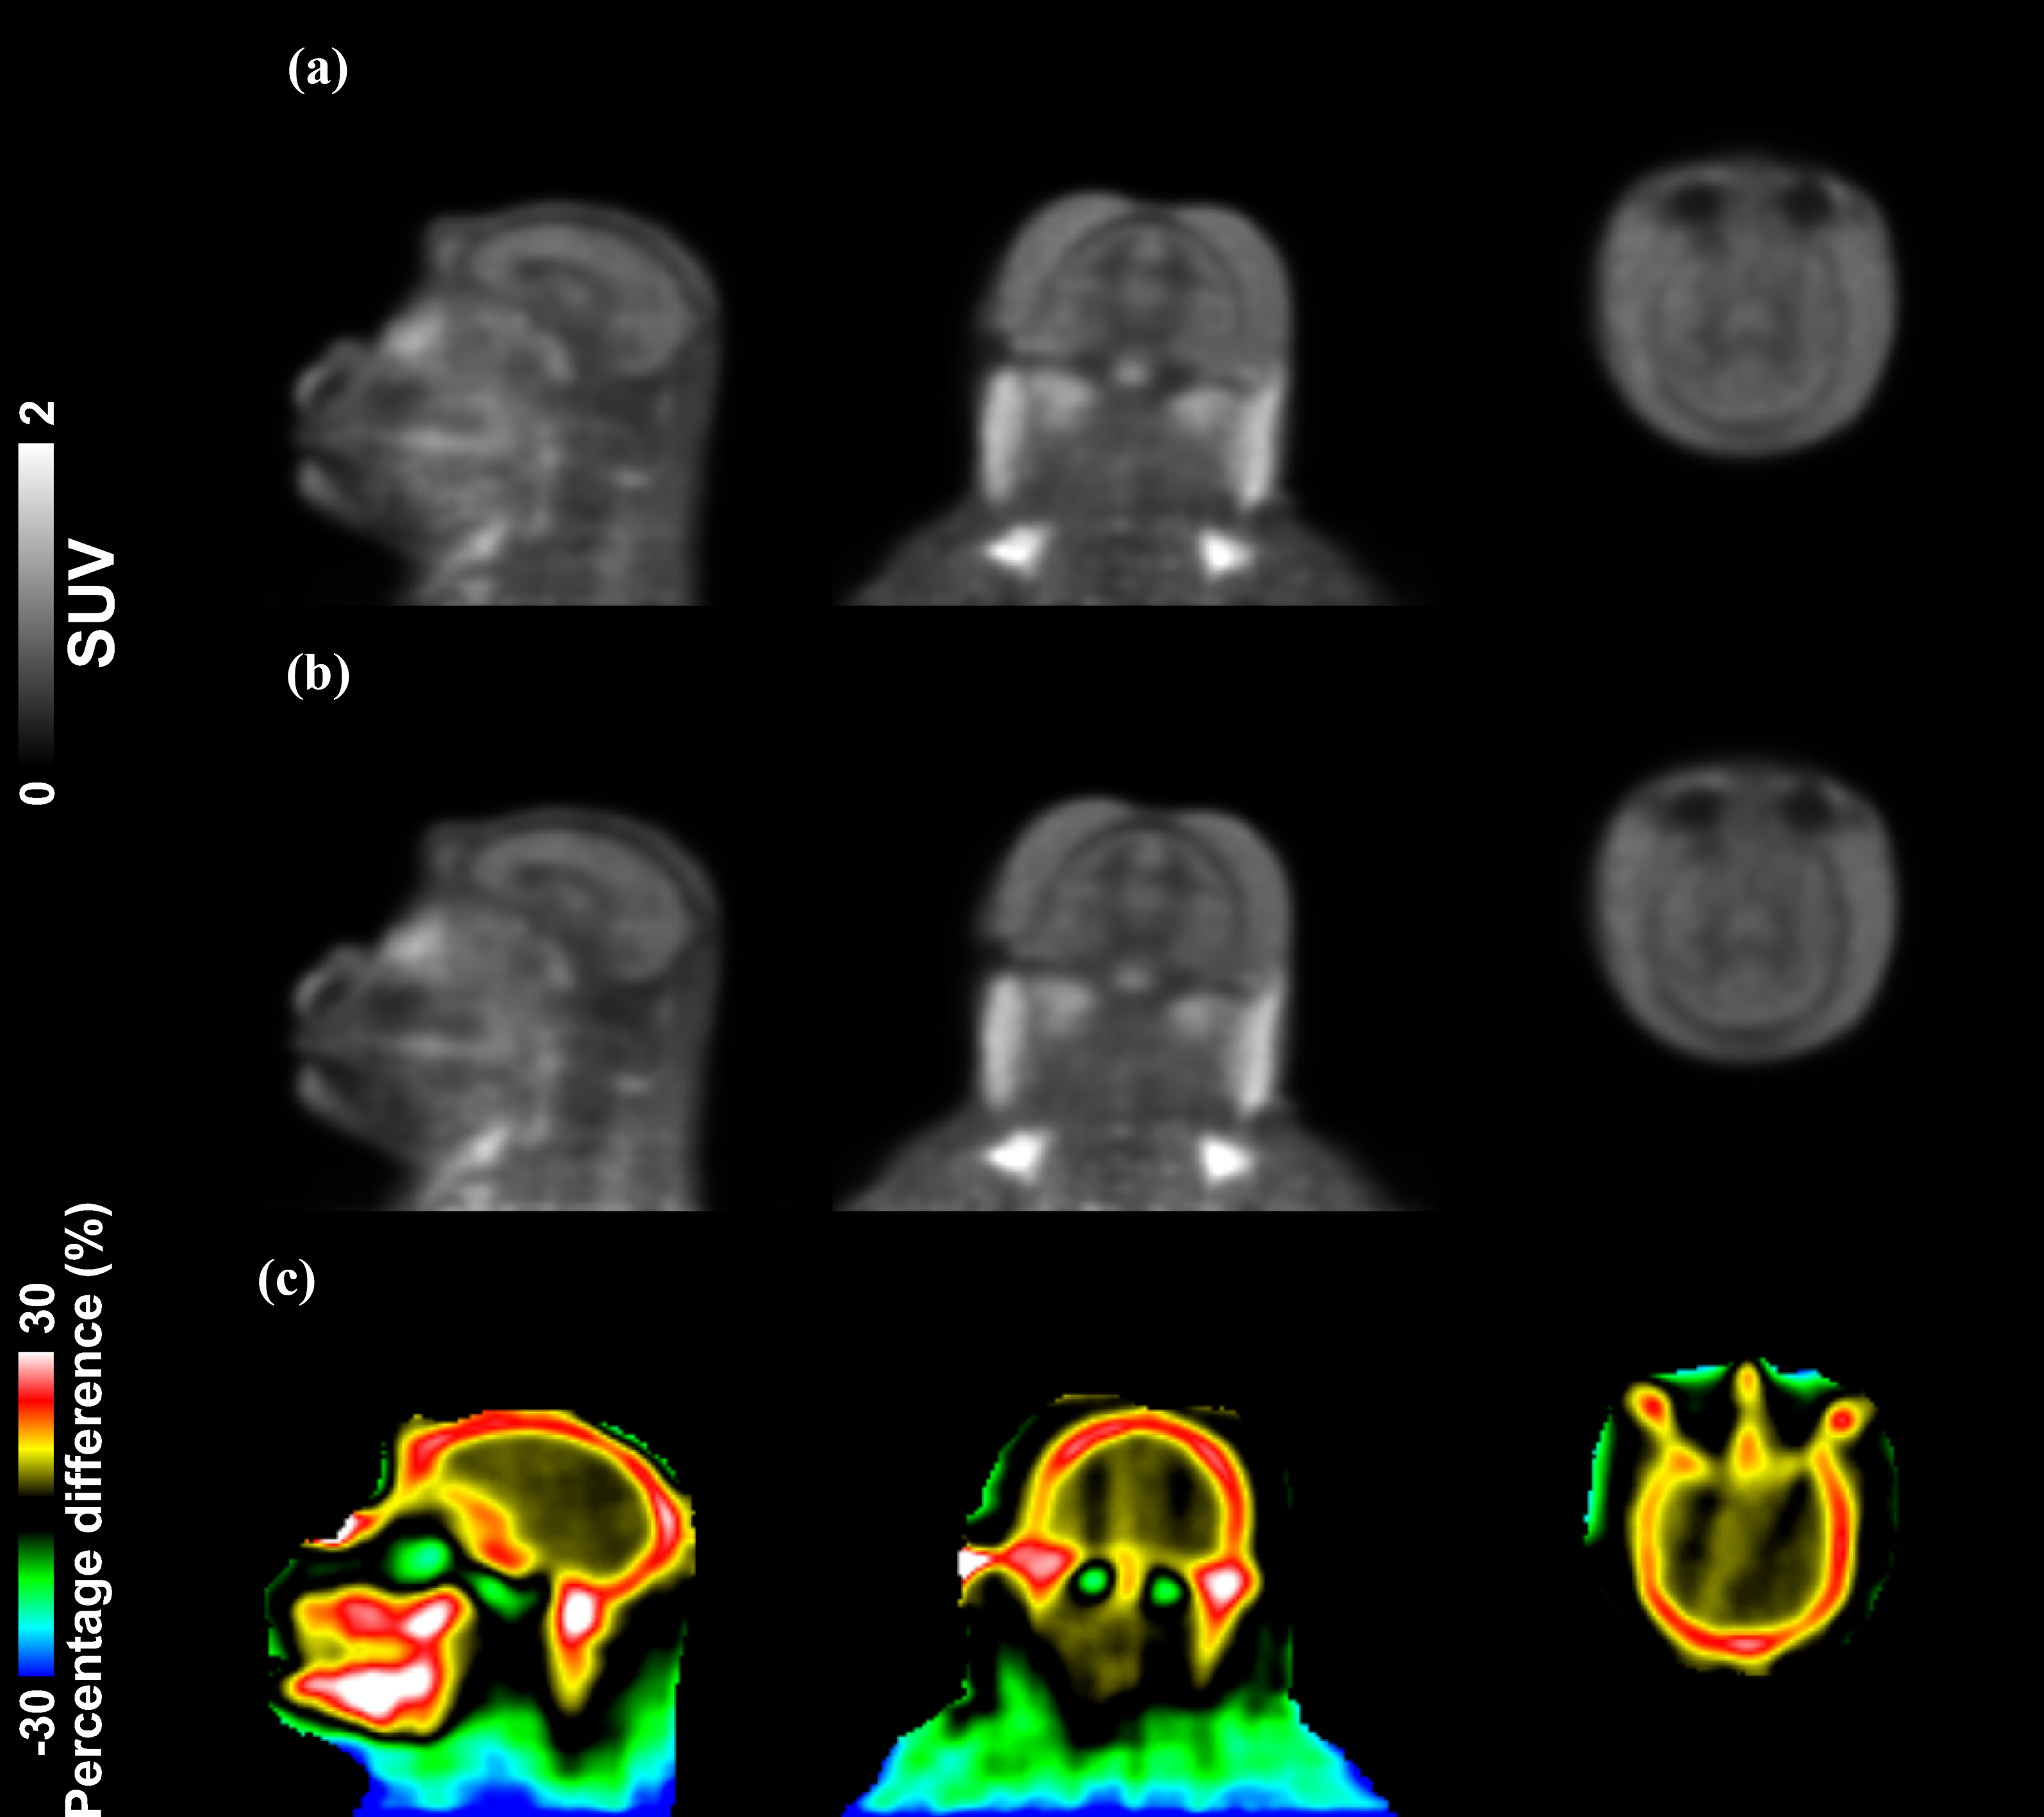
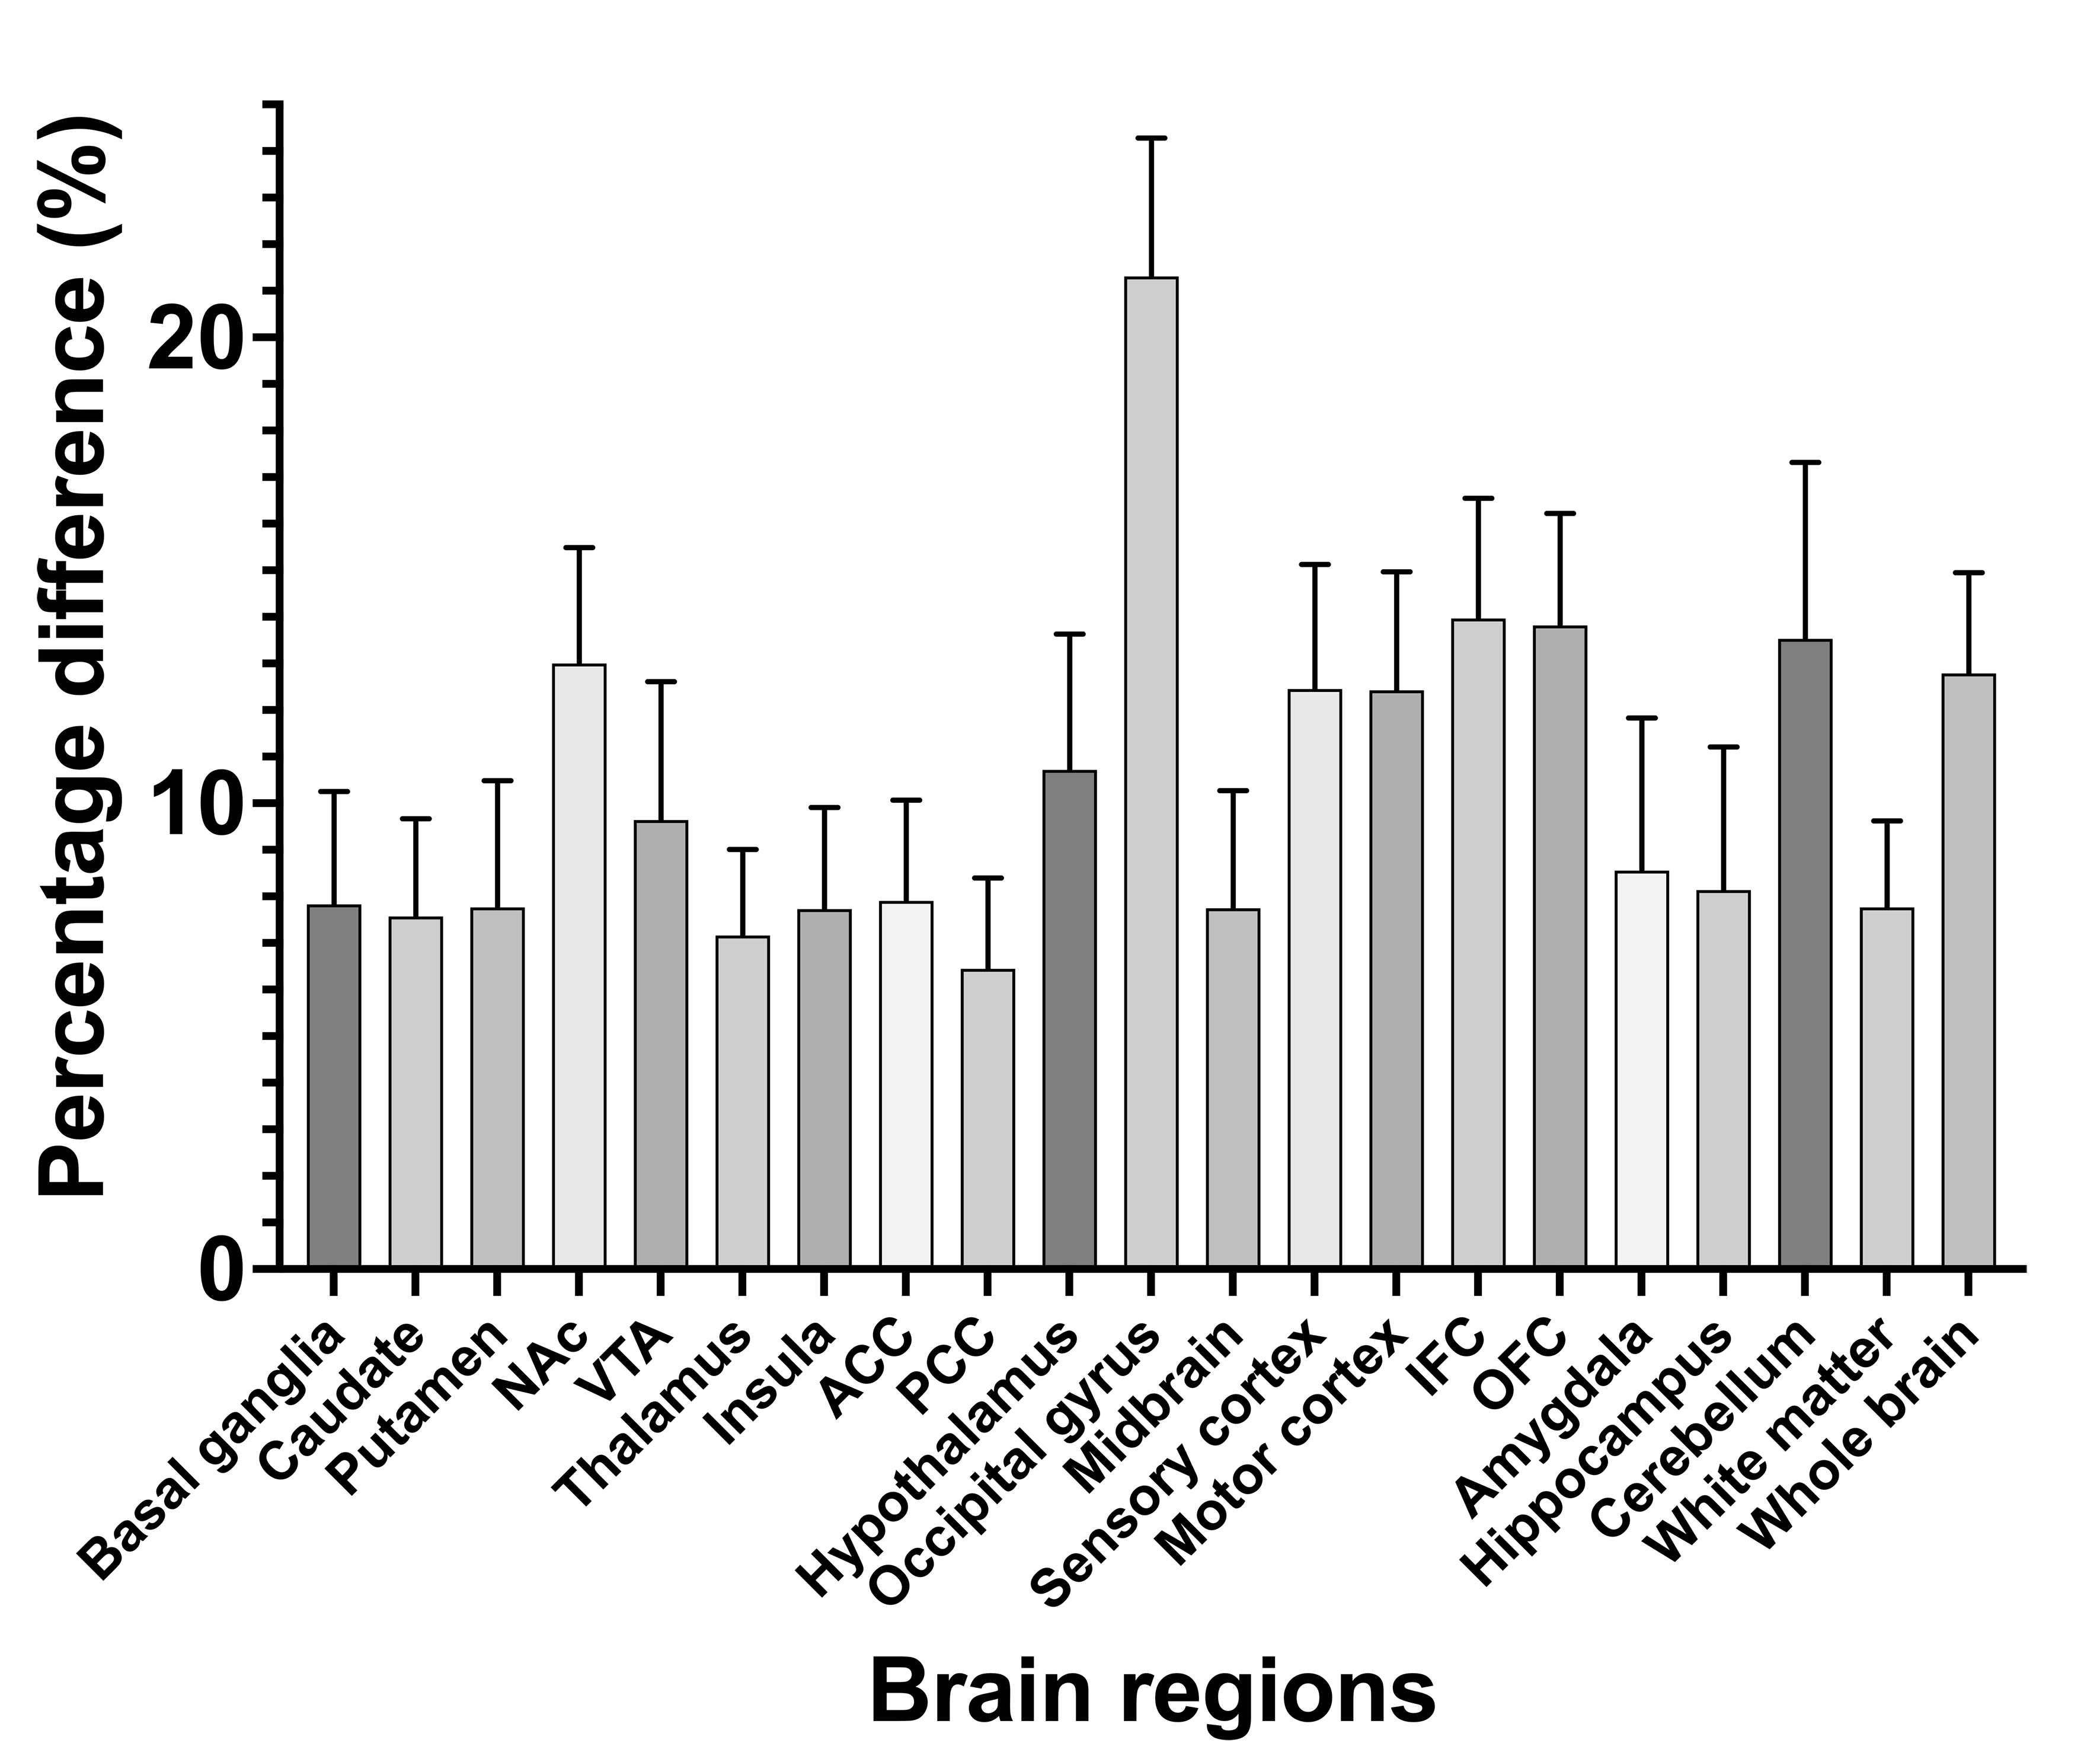
For generation of the population-based template, CT image and anatomical image were acquired in ten NHPs (rhesus macaque) using a PET/CT (GE Discovery 690) and on a 3T MRI (GE Discovery 750). MR image was segmentation into six tissue classes and non-rigidly co-registered by each tissue classes for all 10 NHPs. CT image was warped into the same space, and averaged into the final CT template. For the performance test, we compared PET images reconstructed by two different AC methods, a PET intensity threshold-based (threshold-based AC) and the template-based AC using the generated atlas. Simultaneous PET/MR images were acquired on 4 different NHPs using the Siemens 3T BrainPET prototype scanner. A high-resolution anatomical scan using multi-echo MPRAGE sequence (TR = 2530 ms, TE1/TE2/TE3/TE4 = 1.64/3.5/5.36/7.22 ms, TI = 1200 ms, flip angle = 7°, and 1 mm isotropic) was obtained. MR image was masked by a PET derived binary mask of NHP contour, and bias-corrected and intensity-normalized. Preprocessed MR image was brain extracted, segmented into six tissue classes, and non-rigidly warped into the template space. Finally, the CT template was inversely warped into the subject space and LACs were derived. Dynamic PET data were acquired after an intravenous bolus injection of 196.47 ± 8.23 MBq of [18F]LRRK2 radiotracer to the macaque and stored in list mode for 120 min. The dynamic PET images were reconstructed with the standard uptake value (SUV) image using the 3D-OSEM algorithm into gradually increasing intervals with detector efficiency, decay, dead time, attenuation, and scatter corrections. For a region-based comparison, 17 gray matter, 1 cerebellum, 1 white matter, 1 whole brain regions of interest (ROIs) obtained from the INIA19 template.4 For a voxel-based comparison, a percentage difference map was calculated by dividing the differences between the time-averaged (30-120 min) SUV images of the threshold-based and template-based AC by that of the threshold-based AC.Results
Figure 1 illustrates the tissue classes and template images generated using the iterative diffeomorphic image registration and the INIA19 template. Figure 2 shows (a) the raw and (b) preprocessed MR image, and (c) LAC map for the template-based AC of a representative NHP. Qualitatively, the bone structures on the LAC map closely resemble the anatomical image. Figure 3 demonstrates two PET time-averaged SUV images reconstructed by (a) the template-based AC, (b) threshold-based AC, and (c) percentage difference map between two. Consistent with a previous study, the largest differences occurred in the cortical brain areas near the skull.2 The results of the quantitative ROI-based comparison are summarized in Figure 4. PET image reconstructed by the template-based AC has higher SUV compared to that with the threshold-based AC generally for all brain regions.Discussion and Conclusion
In this study, we generated the population-based template, non-rigidly co-registered CT-MR pair, from ten NHPs. By using the generated template, we can reliably derive the LAC maps from the anatomical image of the NHPs acquired from PET/MR system. By visual inspection, all tissues, including soft-tissues, bone, and air, were well differentiated, especially bone and air, whose MR intensities are the same, extremely low, on the anatomical image. From the ROI- and voxel-based comparison, PET image reconstructed by the threshold-based AC has lower SUV compared to that with the template-based method. We observed that the differences were larger around the boundaries between brain and skull, consistent with the previous results in human brain PET/MR studies.2 Higher SUVs in the template-based method can be explained by that the threshold-based AC method assigns every tissue inside the threshold-derived body contour of NHP into a single LAC, correspond to the bone, basically overcompensating AC. By using the population-based template AC method, we can avoid overcompensating AC, providing more accurate AC for the PET/MR study on NHP. Work is now going to evaluate the impact of different AC methods on PET kinetic modeling results and data quantification. In conclusion, we successfully generated a population-based template for AC for the NHP brain and applied the template-based AC to neuroimaging PET/MR studies. Compared to the threshold-based AC, the template-based AC can provide an accurate MR-based method for PET/MRI studies.Acknowledgements
No acknowledgement found.References
- Quick HH. Integrated PET/MR. J Magn Reson Imaging. 2014 Feb;39(2):243-58. doi: 10.1002/jmri.24523. Epub 2013 Dec 12. Erratum in: J Magn Reson Imaging. 2014;39(5):1341.
- Izquierdo-Garcia D, Hansen AE, Förster S, Benoit D, Schachoff S, Fürst S, Chen KT, Chonde DB, Catana C. An SPM8-based approach for attenuation correction combining segmentation and nonrigid template formation: application to simultaneous PET/MR brain imaging. J Nucl Med. 2014;55(11):1825-30. doi: 10.2967/jnumed.113.136341.
- Ladefoged CN, Law I, Anazodo U, St Lawrence K, Izquierdo-Garcia D, Catana C, Burgos N, Cardoso MJ, Ourselin S, Hutton B, Mérida I, Costes N, Hammers A, Benoit D, Holm S, Juttukonda M, An H, Cabello J, Lukas M, Nekolla S, Ziegler S, Fenchel M, Jakoby B, Casey ME, Benzinger T, Højgaard L, Hansen AE, Andersen FL. A multi-centre evaluation of eleven clinically feasible brain PET/MRI attenuation correction techniques using a large cohort of patients. Neuroimage. 2017;147:346-359. doi: 10.1016/j.neuroimage.2016.12.010.
- Rohlfing T, Kroenke CD, Sullivan EV, Dubach MF, Bowden DM, Grant KA, Pfefferbaum A. The INIA19 Template and NeuroMaps Atlas for Primate Brain Image Parcellation and Spatial Normalization. Front Neuroinform. 2012;6:27. doi: 10.3389/fninf.2012.00027.
Figures