5021
Feasibility of Spiral Routine Knee Imaging at 1.5 T1Department of Radiology, Mayo Clinic, Rochester, MN, United States, 2MR R&D, Philips Healthcare, Rochester, MN, United States
Synopsis
Spiral spin-echo and dual spin-echo sequences have been implemented for knee imaging at 1.5T with in-plane resolution of 0.51 by 0.51 mm2. High-quality proton density-weighted, T2-weighted and T1-weighted water and fat images at various orientations can be obtained using spiral Dixon imaging with comparable total scan time as the conventional Cartesian fast (turbo) spin-echo sequences without Dixon. Spiral T2-weighted water images demonstrated better fat suppression and a 24-67% increase of signal-to-noise ratio compared to fat-suppressed Cartesian reference images.
Introduction
Two-dimensional (2D) fast (turbo) spin-echo (FSE or TSE) sequences are commonly used in routine knee exams for proton density-weighted (PDW), T2-weighted (T2W) and T1-weighted (T1W) images at various orientations, with fat suppression in one or more of the scans1,2. The previous work3-4 demonstrated high-resolution spiral knee imaging at 3T. Although knee imaging at 3T is usually preferable for the higher signal-to-noise ratio (SNR), imaging with metal implants at 1.5T is less challenging due to the less severe susceptibility. For the same reason, spiral imaging with long readout, for improved efficiency, is also more feasible at 1.5T. The goal of this study is to investigate the feasibility of spiral spin-echo (SE) routine knee imaging at 1.5T.Materials and Methods
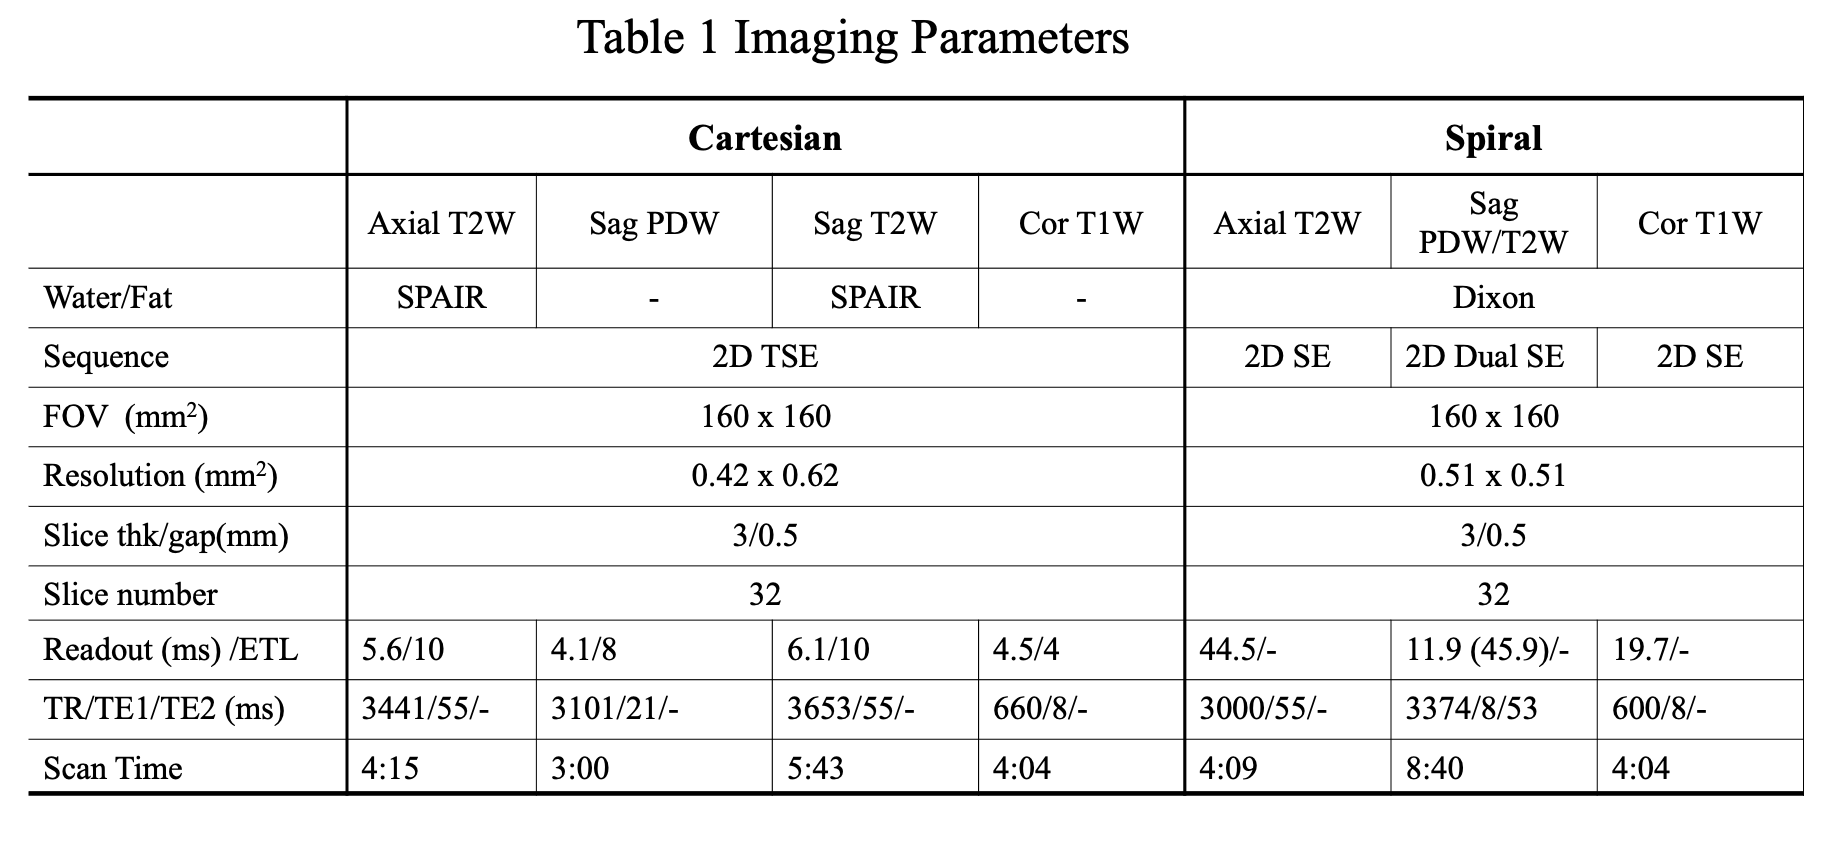
a. Data AcquisitionSpiral pulse sequences were implemented on a 1.5T scanner (Ingenia Ambition, Philips Healthcare, Best, The Netherlands). Data of two volunteers were collected using a 16-channel knee receive coil. Cartesian TSE scans with parameters close to the clinical routine knee exams were performed for reference. Spiral data were collected with the same pixel size of the Cartesian reference imaging. All spiral data were acquired at each nominal echo time (TE) with two TE shifts, 0 and 2.3 ms, for Dixon water-fat imaging5. Field maps of the static field inhomogeneity were obtained from separate low-resolution Cartesian scans. Some of the scan parameters are summarized in Table 1.
Axial T2W imaging
The readout of the Cartesian TSE scan was in the anterior-posterior (AP) direction to minimize the flow artifacts in the knee. Spectral attenuated inversion recovery (SPAIR)6 was applied to suppress the fat signal. Axial spiral T2W images was acquired by a 2D SE sequence with asymmetric spiral in-out readout4 and in-plane flow compensation. A shorter length of spiral-in τ1=19.8 ms was used to achieve the desired TE, while a longer length of spiral-out τ2=24.7 ms was used to further increase the total readout time for better SNR.
Sagittal PDW and T2W imaging
The readout for both Cartesian TSE PDW and T2W sequences was in the AP direction. SPAIR was applied in the Cartesian T2W sequence. A 2D dual SE technique was used to simultaneously collect data for PDW and T2W4. The first echo was acquired using spiral-out with the readout length of τ1=11.9 ms for PDW images. The second echo was acquired with spiral in-out trajectories for T2W images. The length of the spiral-in part is τ1. The spiral-out part has a longer length τ2=34.0 ms. In-plane flow compensation was applied for the second echo. The number of spiral interleaves was increased by 11% to match the total scan time of the PDW and T2W imaging between the spiral and the Cartesian scans.
Coronal T1W imaging
Readout for Cartesian TSE T1W sequence was in the HF direction. Data for spiral T1W images were collected with spiral-out readout. The number of sampling average (NSA) was two for both Cartesian and spiral scans to increase the SNR. In addition, the number of spiral interleaves was increased by 43% to match the scan time between the spiral and Cartesian imaging.
b. Reconstruction and Analysis
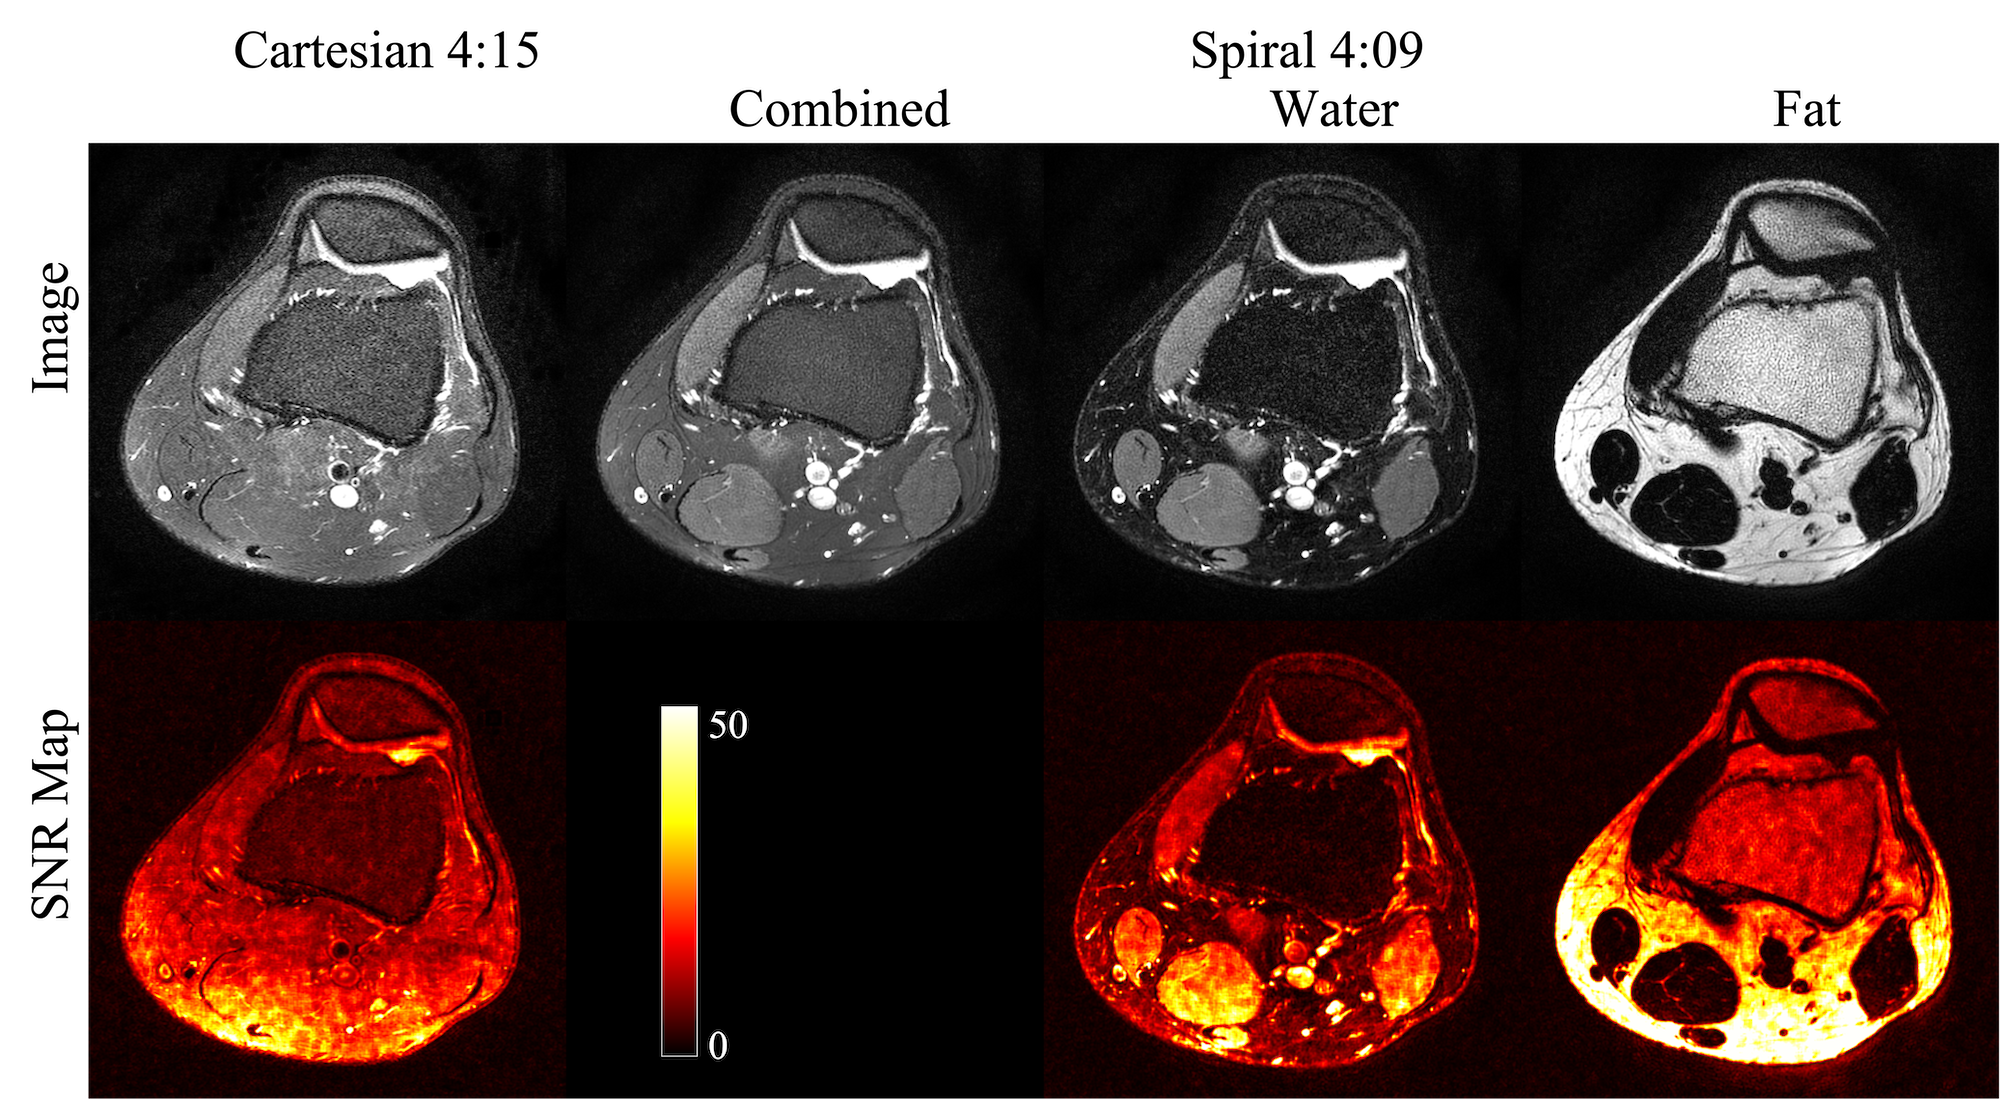
Both Cartesian and spiral data were reconstructed offline without filtering. Spiral water and fat images were reconstructed using a joint water-fat separation and deblurring method5. Concomitant field correction was also incorporated in the deburring process. For T2W images, the separately reconstructed spiral-in and spiral-out images were combined using weighted summation. The weights are $$$\sqrt{τ_1}/(\sqrt{τ_1}+\sqrt{τ_2})$$$ and $$$\sqrt{τ_2}/(\sqrt{τ_1}+\sqrt{τ_2})$$$ for spiral-in and spiral-out images, respectively. Each scan was repeated except for the coronal T1W imaging, in which there were already two data sets from the 2-NSA acquisition. The signal and noise were estimated from the sum and difference of the two images respectively to yield SNR maps (Fig. 1).
Results and Discussion
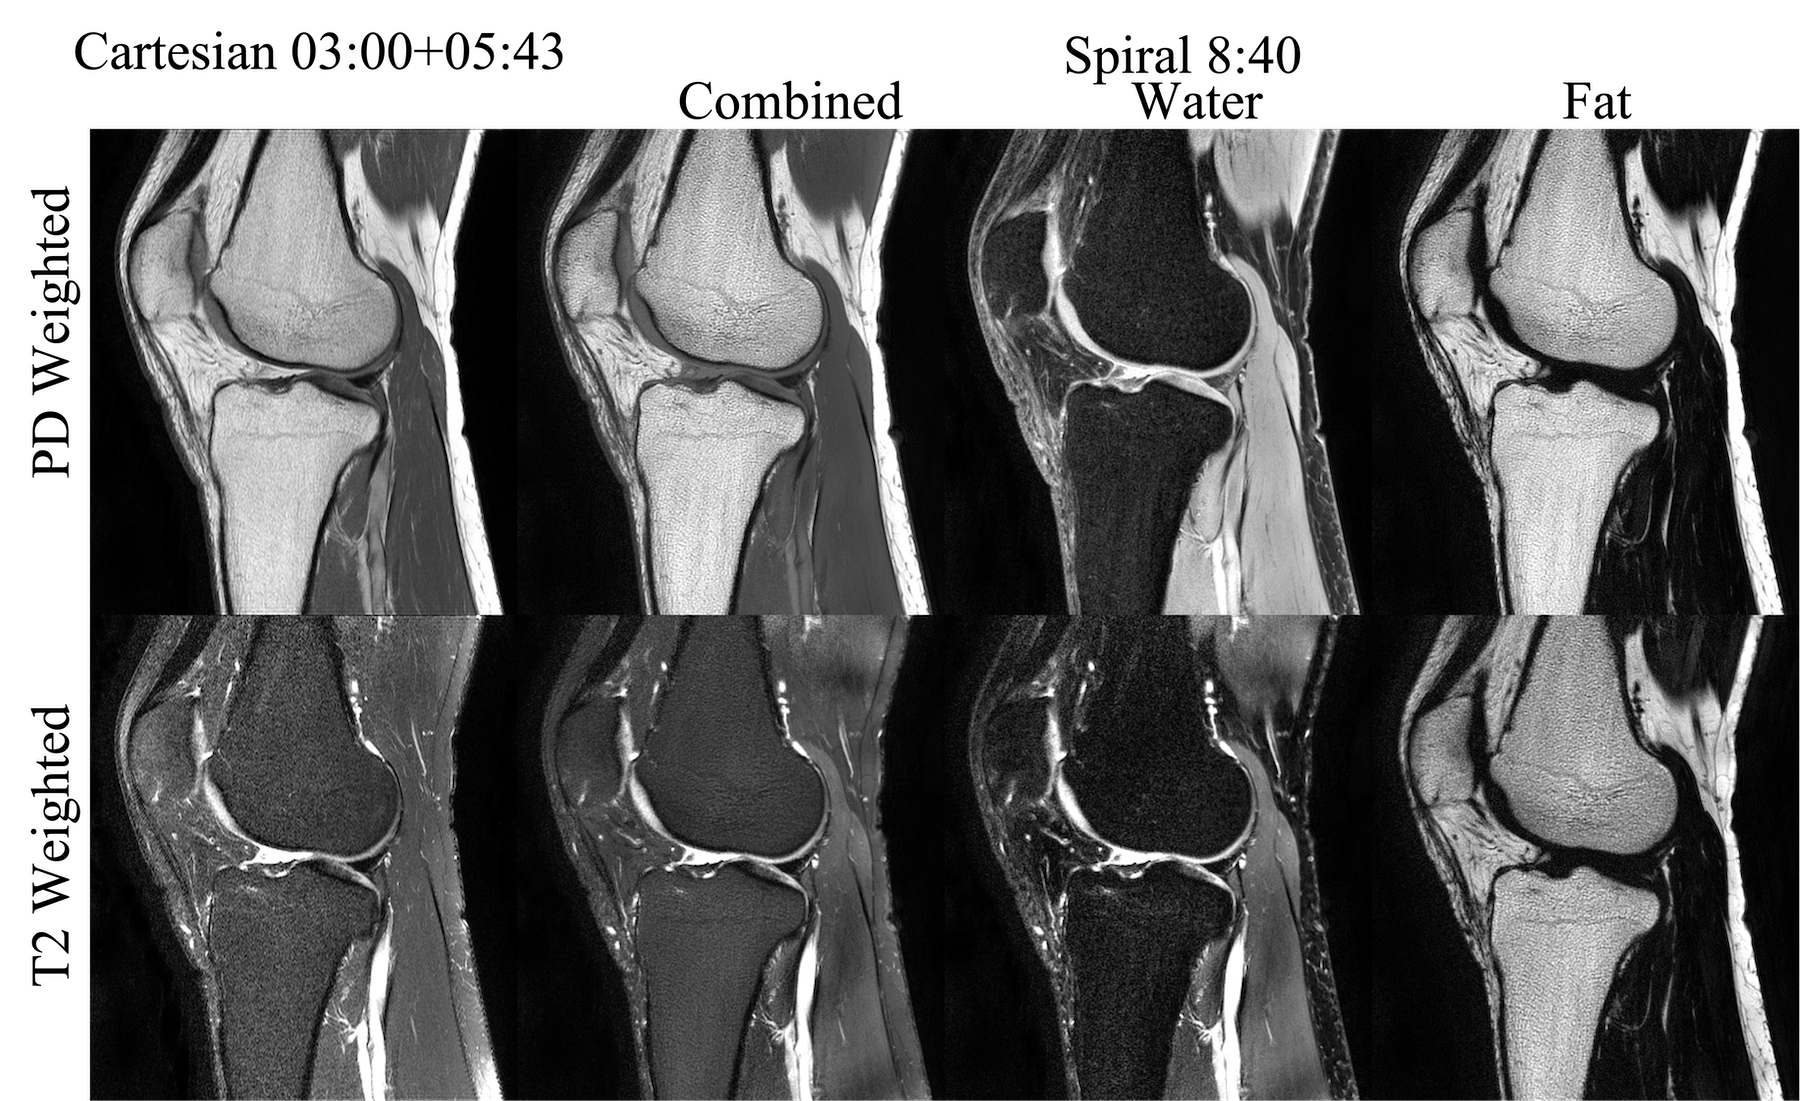
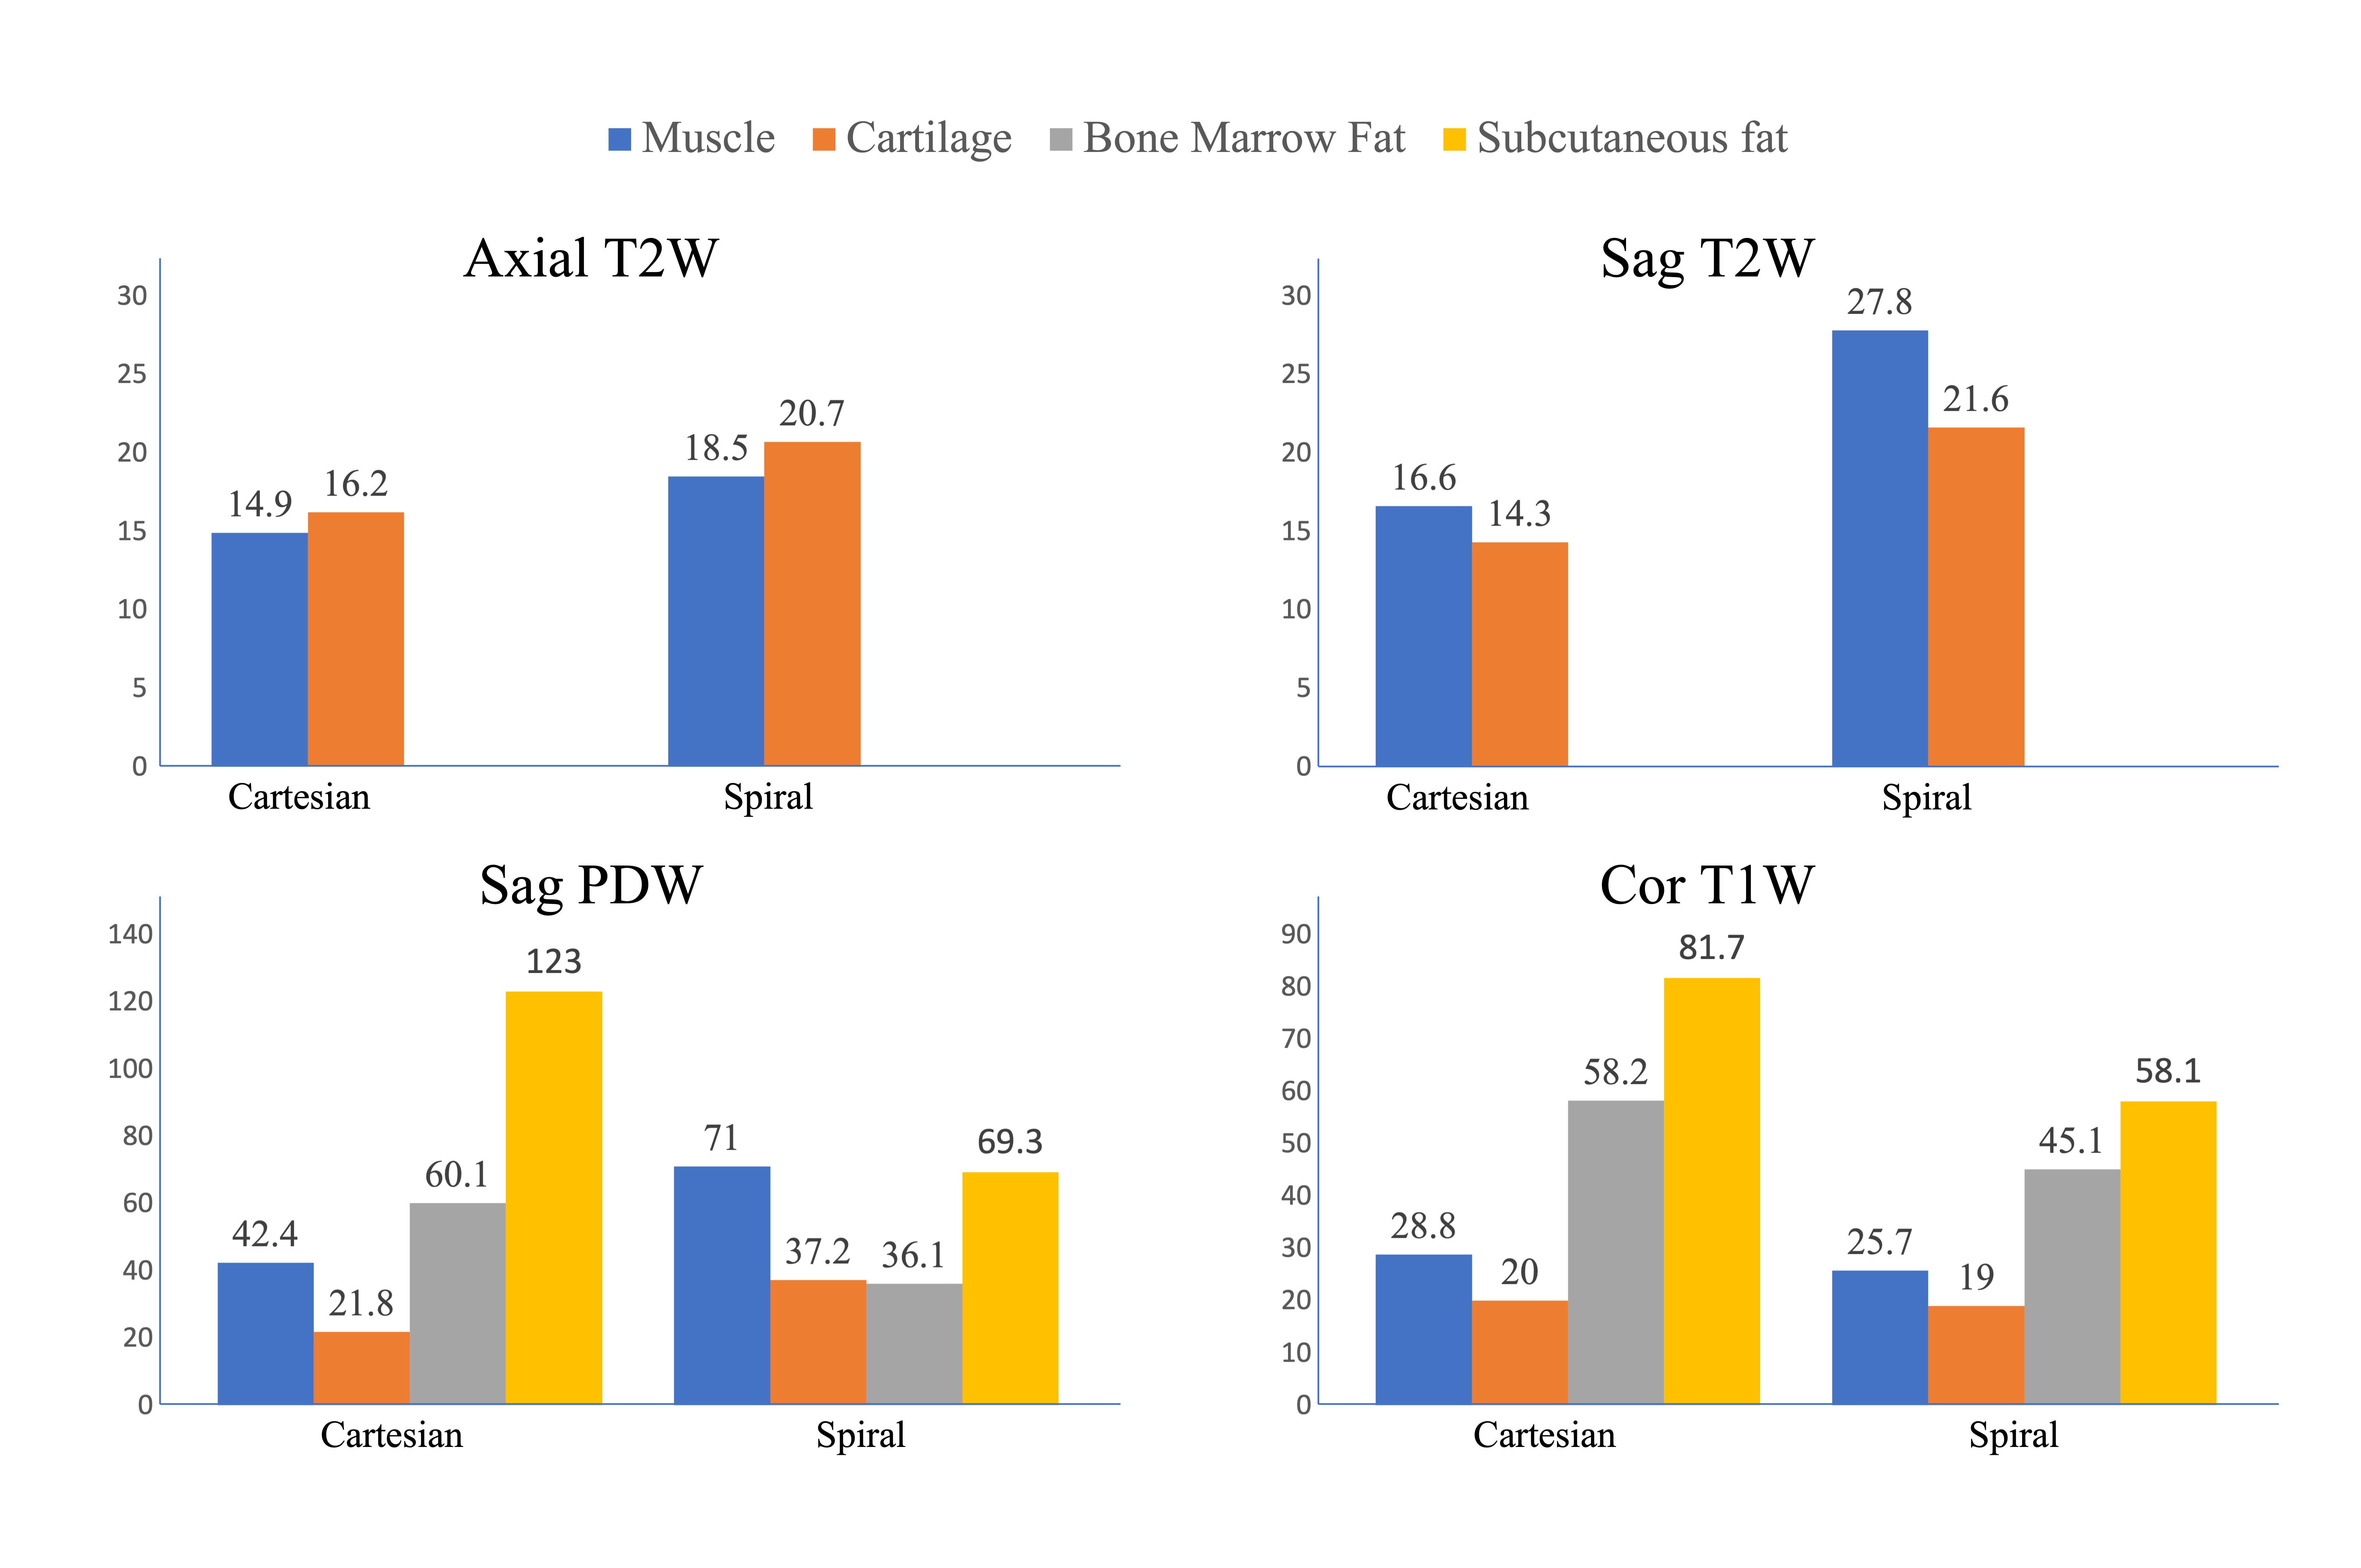
The spiral images are shown and compared with the Cartesian images in Figures 1-3. Spiral fat images were scaled empirically before being combined with water images to create contrasts comparable to the Cartesian references. SNRs estimated from regions of interest are summarized in Fig.4. Compared to the Cartesian TSE T2W imaging with SPAIR, spiral imaging increases SNR by 24-28% for axial scans. A more pronounced SNR increase of 51-67% is observed for the sagittal T2W imaging. Spiral T2 water images also demonstrate better fat suppression.The SNR of fat is much higher in Cartesian TSE for PDW and T1W imaging (Fig.4), likely due to the generally brighter fat signal in TSE scans. Nevertheless, fat SNR might not be a concern for spiral SE imaging since it is already relatively high. The spiral images also have a more textured appearance in bone marrow, partially due to the increased T2* weighting in spiral readouts. T2* decay may also contribute to the slightly (5-11%) lower SNR in the spiral coronal T1W imaging. Spiral PDW images were acquired at a shorter TE than the Cartesian reference and hence a slightly different contrast. It might be possible to synthesize images at different TEs using a T2 map evaluated from the PDW and T2W images4. Repeated scans were used for a preliminary SNR estimation, which is sensitive to motion. Alternative methods7,8 may improve the accuracy of the SNR estimation.
Acknowledgements
This work was funded by Philips Healthcare.References
1. American college of Radiology. ACR–SPR–SSR practice parameter for the performance and interpretation of magnetic resonance imaging (MRI) of the knee. Revised 2015 (Resolution 6).
2. Shapiro L, Harish, Hargreaves, Staroswiecki E, Gold G. Advances in musculoskeletal MRI: technical considerations. J Magn Reson Imaging. 2012;36(4):775-87.
3. Wang D, Baffour BI, Li Z, Chao T, Krishnamoorthy G, Pipe JG. Feasibility of high-resolution knee imaging with a spiral Dixon technique, in proceedings of the 29th Science Meeting of ISMRM, 2020. Abstract 3172
4. Wang D, Baffour BI, Borup, DD, Chao T, Pipe JG. Dual spin-echo proton density-weighted knee imaging with asymmetric spiral in-out trajecories, in proceedings of the 30th Science Meeting of ISMRM, 2021. Abstract 0008
5. Wang D, Zwart NR, Pipe JG. Joint water-fat separation and deblurring for spiral imaging. Magn Reson Med. 2018;79:3218-3228.
6. Del Grande F, Santini F, Herzka DA, et al. Fat-suppression techniques for 3T MR imaging of the musculoskeletal system. RadioGraphics 2014; 34:217-233.
7. Yu J, Agarwal H, Stuber M, Schär M. Practical signal-to-noise ratio quantification for sensitivity encoding: application to coronary MRA. J Magn Reson Imaging 2011;33:1330–1340.
8. Kim D, Wang D, Pipe JG. Towards Automated Scanning: A Framework for Maintaining Constant SNR and T1-contrast for SPGR and MP-RAGE, in proceedings of the 30th Science Meeting of ISMRM, 2021. Abstract 3817.
Figures