5018
Streak reduction in radial imaging with CACTUS1Medical Imaging, The University of Arizona, Tucson, AZ, United States, 2Electrical and Computer Engineering, The University of Arizona, Tucson, AZ, United States, 3Biomedical Engineering, The University of Arizona, Tucson, AZ, United States
Synopsis
Radial trajectories are appealing for efficient parameter mapping due to their robustness to undersampling compared to Cartesian trajectories. However, streaks due to scanner imperfections can significantly affect image quality and accuracy of parameter maps. Previously, we developed a streak reduction technique named CACTUS. CACTUS was demonstrated in cross-sectional (axial) abdominal parameter imaging. The other two imaging planes (coronal and sagittal) in radial MRI are more vulnerable to these anomaly streaks. In this work, we demonstrate the benefits of CACTUS in all three imaging orientations and investigate the effect of undersampling on the presence of streaks and associated parameter maps.
Introduction
Radial trajectories are appealing for efficient parameter mapping due to their robustness to undersampling compared to Cartesian trajectories1,2. However, streaks due to scanner imperfections emanating from regions of gradient nonlinearity and Bo inhomogeneity (typically present in areas at the edge of large FOVs), can significantly affect image quality and accuracy of parameter maps3-5.Previously, we developed two beam-forming based techniques, B-STAR5 and CACTUS6, targeting streaks caused by system imperfections. The advantage of CACTUS over BSTAR is that it is designed to work in k-space and can be combined with iterative algorithms to reconstruct parameter maps from undersampled radial data. CACTUS was demonstrated in cross-sectional (axial) abdominal imaging. The other two imaging planes (coronal and sagittal) in radial MRI are more vulnerable to streaks emanating from anatomy outside (or at the edge of large) FOVs. In addition, undersampling (which is critical for fast parameter mapping) accentuates streaking artifacts reducing the inherent benefits of radial MRI for parametric imaging.
Here, we demonstrate the benefits of CACTUS in all three imaging orientations and investigate the effect of undersampling on the presence of streaks and associated parameter maps.
Methods
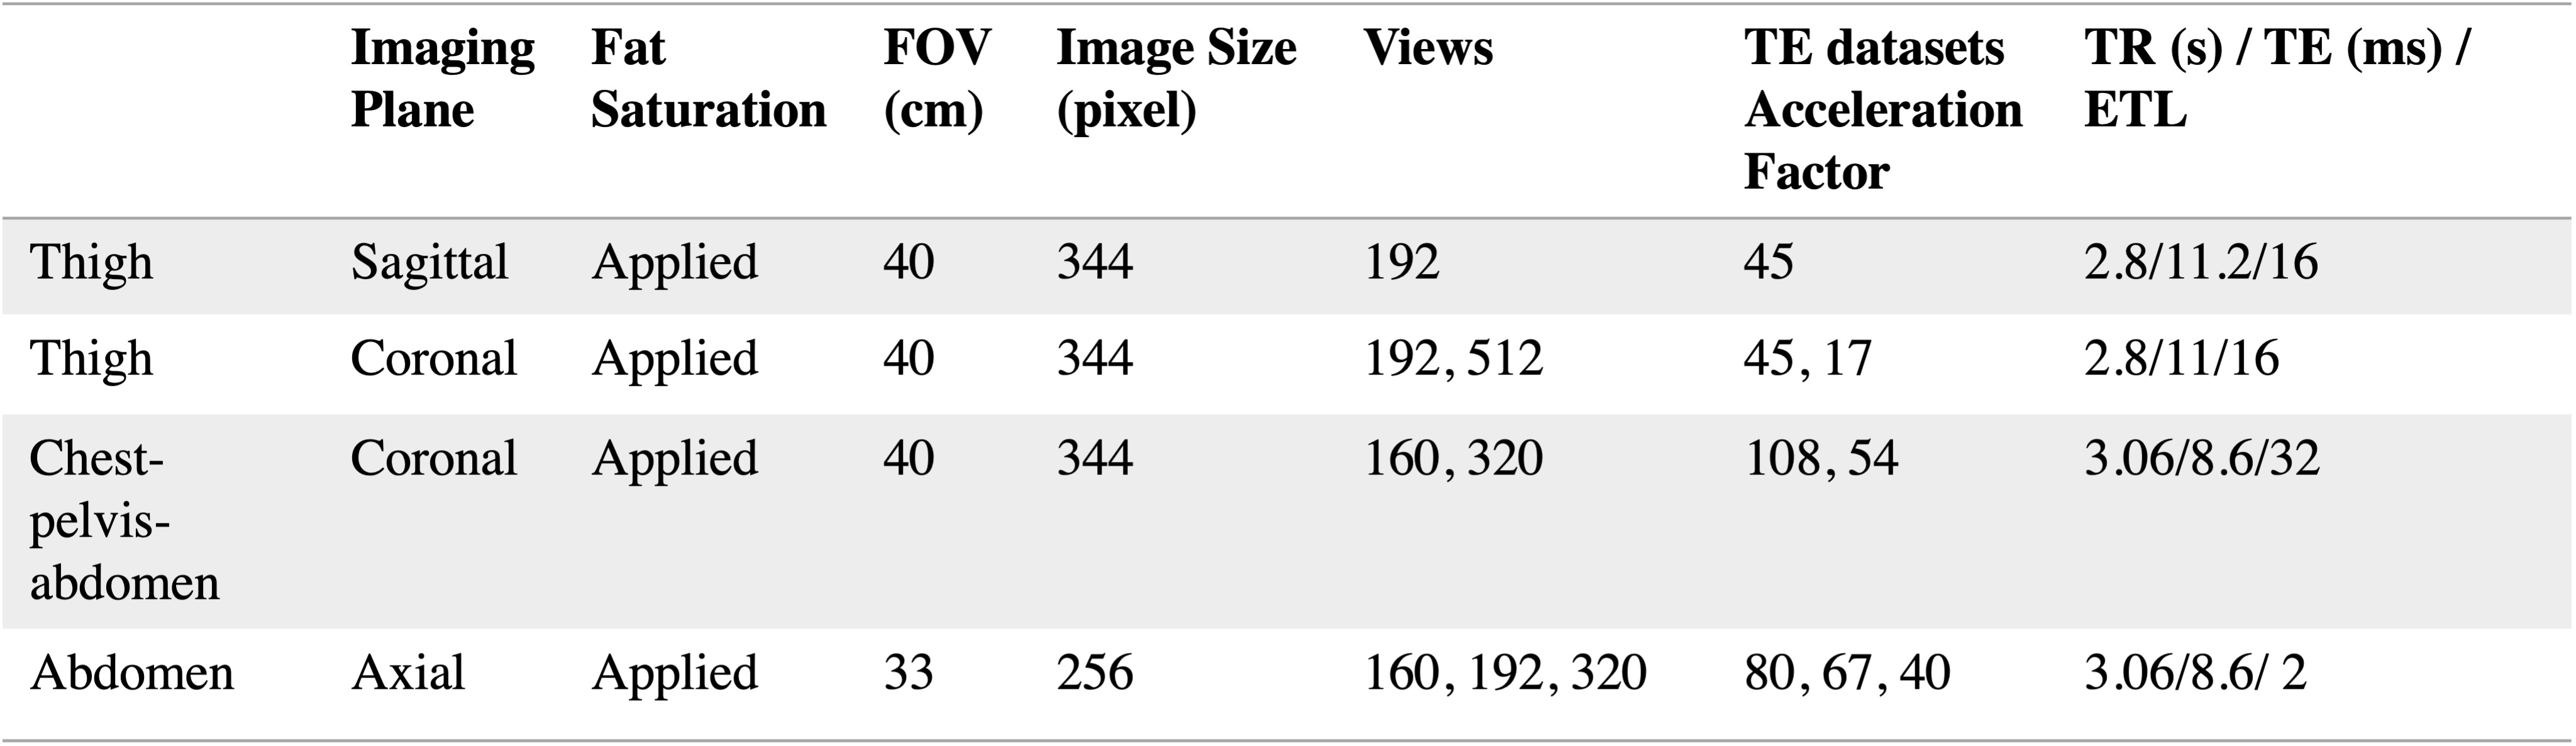
The de-streaking process of CACTUS is illustrated in Fig.1. Suppose an imaging system consisting of $$$N$$$ receiver coils . Coil images $$$x$$$ are first used to obtain the coil combined image, from which the streak source regions are identified. CACTUS models these streaks as interference to the signal of interest and represents them using a low-dimensional subspace of the coil space. To eliminate streaks, the coil images $$$x$$$ or k-space data $$$b$$$ are projected onto the interference null space. The latter projection returns the de-streaked k-space $$$b_\perp$$$, which can be easily integrated into iterative or deep learning reconstruction pipelines.Radial turbo spin-echo (RADTSE7) data were acquired at 3T (Siemens, Skyra) on normal volunteers sampling the thigh, chest-abdomen-pelvis, and abdomen as examples of clinical scans in the sagittal, coronal, and axial planes. Table 1 shows relevant sequence parameters. Each RADTSE dataset underwent the same reconstruction pipeline: (i) all views were used to reconstruct an anatomical image with an average TE contrast, i.e., the composite image; (ii) a model-based iterative algorithm8 was used to reconstruct TE images from highly undersampled TE datasets (~4% sampling), which were fitted using VARPRO9 to obtain the T2 map. For data processed with CACTUS, interference source ROIs were drawn at the streak source using the composite image. To integrate with iterative approaches, CACTUS projects the k-space data in a pre-processing step (Fig. 1). Interference subspace ranks were tuned for composite image and iterative reconstructions, respectively, per dataset.
Results
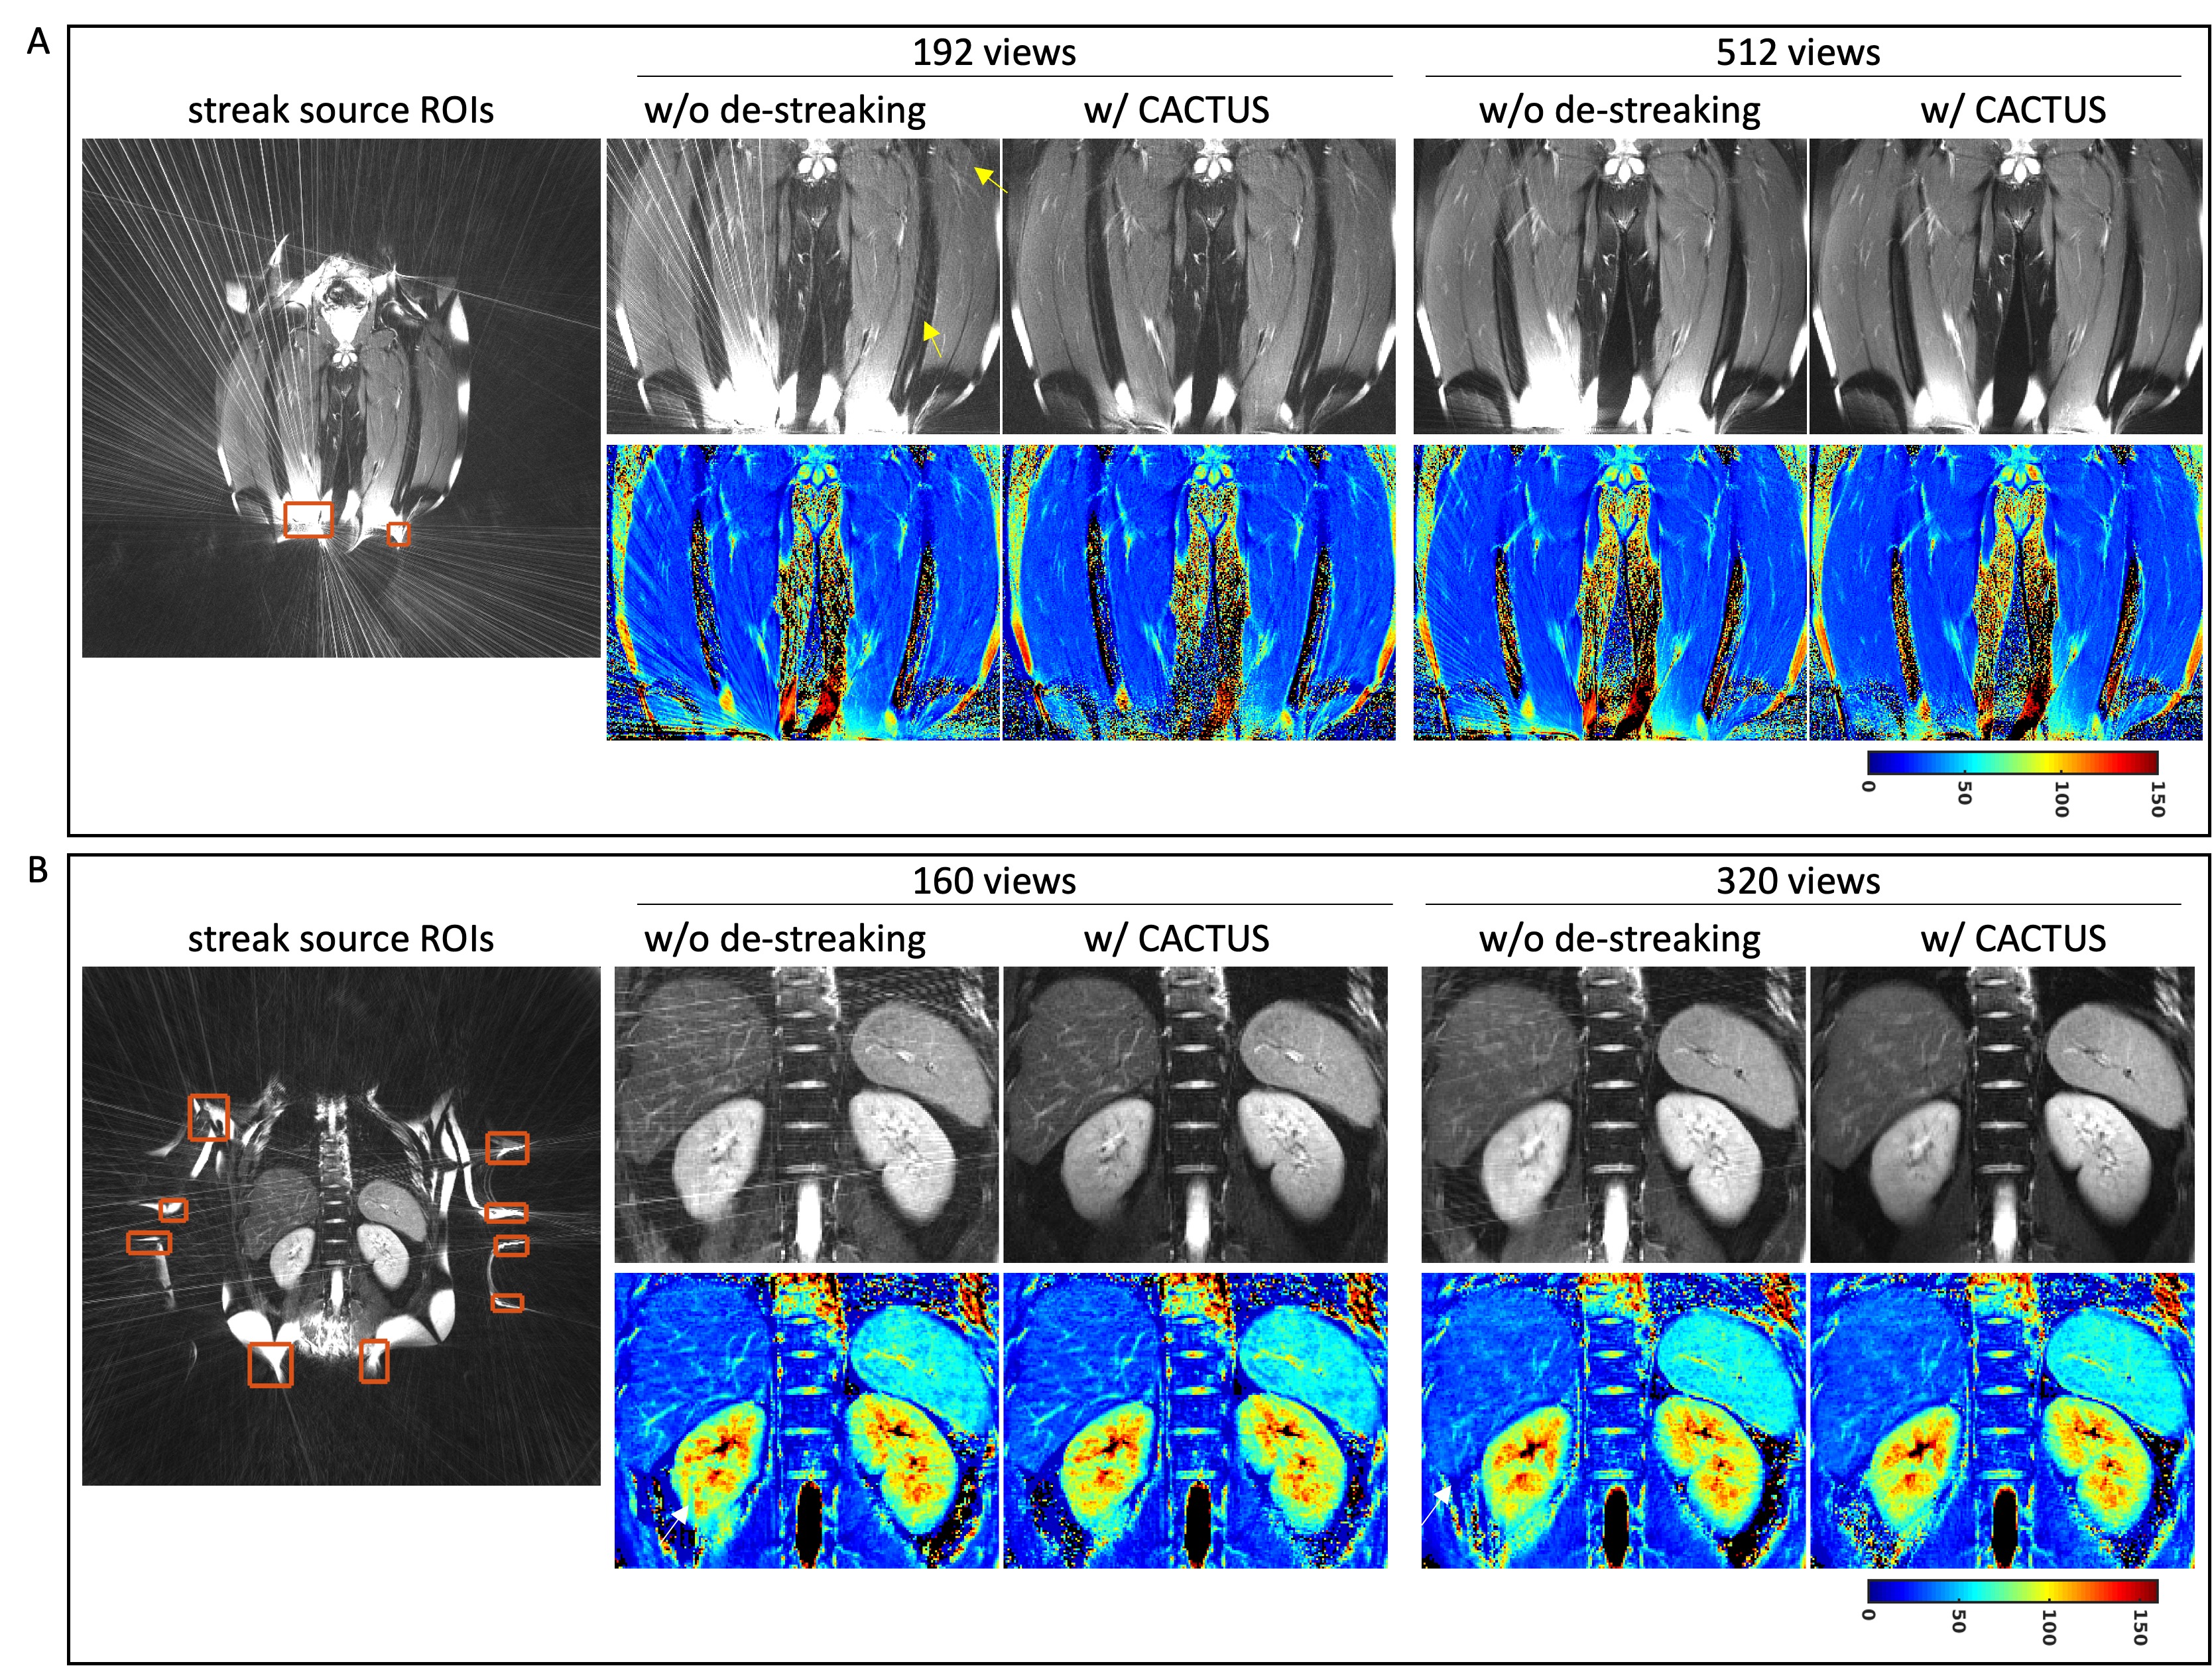
Fig. 2 demonstrates de-streaking for thigh imaging in the sagittal plane. Fig. 2A shows the composite image reconstructed at 2xFOV to illustrate the streak sources (typically outside the FOV or anatomy-of-interest) and the position of the CACTUS ROIs (red boxes). Note that streaks are mainly caused by unsuppressed fat at the edges of the thigh. Fig. 2B shows the composite image (zoomed to the anatomy-of-interest) without and with CACTUS correction. CACTUS suppressed the streak source and eliminated streaks through the anatomy-of-interest. Fig. 2C shows T2 maps without and with CACTUS. While the iterative reconstruction suppressed finer streaks in the mid leg region, artifacts due to streaks (shading, noise amplification) coming from the lower part of the leg, remain (arrowheads); with CACTUS, these artifacts are removed.Fig. 3A demonstrates de-streaking for thigh imaging (coronal plane) with the left panel showing the image reconstructed at 2xFOV and the CACTUS ROIs (red boxes). When imaged with 192 views, strong streaks (emanating from the larger source ROI) and subtle streaks (emanating from the smaller source ROI) contaminate the anatomy (arrows). With 512 views, the streaks on the left are greatly reduced and those on the right are no longer visible – illustrating undersampling effects. Regardless of undersampling, CACTUS consistently suppressed the streaks rendering artifact-free anatomy. Similar observations regarding the composite images apply to the T2 maps.
Fig. 3B shows de-streaking on a chest-abdomen-pelvis coronal slice. Note the arms are distorted due to gradient nonlinearities at the edge of the magnet causing the source of streaks (red boxes). Without CACTUS, streaks through liver, spleen, and kidneys manifest in the composite image at 160 views and 320 views, although less pronounced in the latter. CACTUS completely removed these streaks regardless undersampling level.
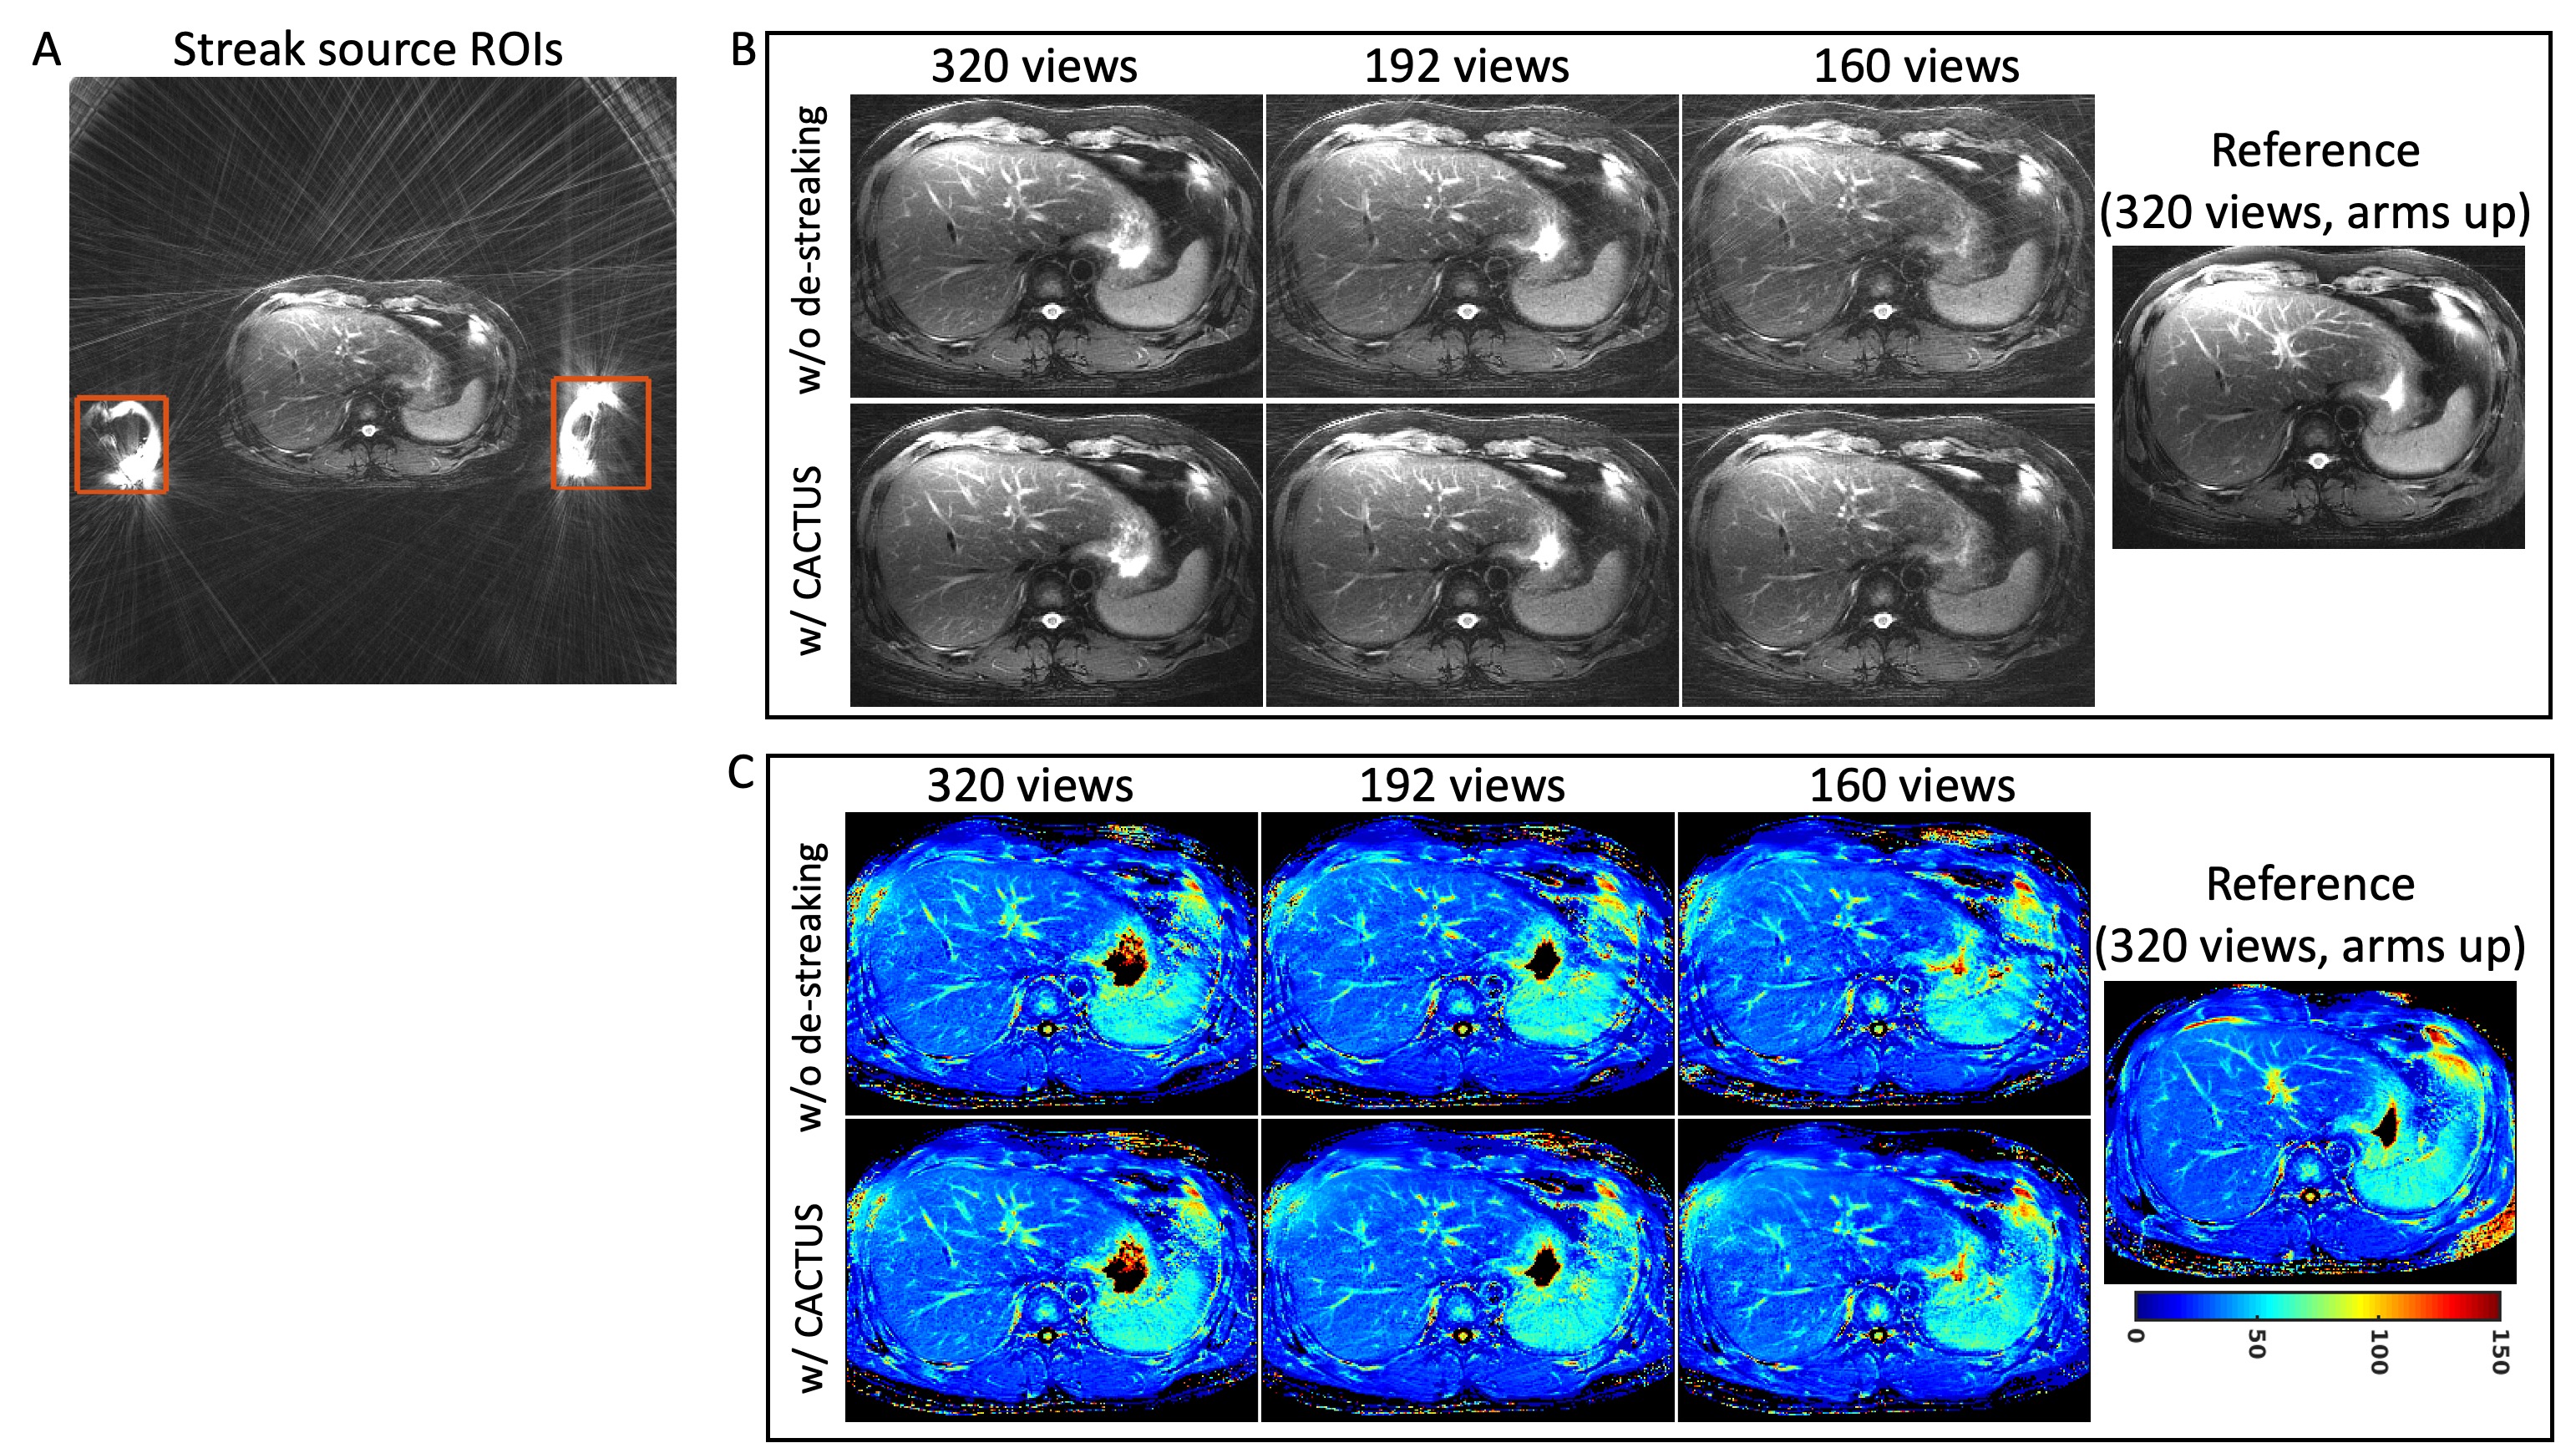
Fig. 4 demonstrates de-streaking in abdominal axial imaging. Fig. 4A shows the streak sources from the arms (red boxes). Fig. 4B shows composite images acquired at three undersampling levels and a reference image (acquired with arms up at 320 views). Fig. 4C shows the corresponding T2 maps without and with CACTUS de-streaking. As the number of views decreases, the streaks through the liver appear more pronounced in the composite images translating into T2 underestimation in the liver and spleen (showing as shadings) for all three maps. Compared to the reference, CACTUS eliminated streaks in the composite images and delivered homogenous T2 maps.
Conclusion
Streaks in radial imaging are accentuated due to system imperfections and become more prominent in highly undersampled acquisitions affecting image quality and T2 estimation. CACTUS is an efficient method for streak reduction enabling highly undersampled imaging and T2 mapping.Acknowledgements
The authors would like to acknowledge support from NIH (R01CA245920), the Arizona Biomedical Research Commission (CTR056039), and the Technology and Research Initiative Fund (TRIF) Improving Health Initiative.References
1. Keerthivasan, M. B., Galons, J. P., Johnson, K., Umapathy, L., Martin, D. R., Bilgin, A., & Altbach, M. I. (2021). Abdominal T2‐Weighted Imaging and T2 Mapping Using a Variable Flip Angle Radial Turbo Spin‐Echo Technique. Journal of Magnetic Resonance Imaging.
2. Li, Z., Bilgin, A., Johnson, K., Galons, J. P., Vedantham, S., Martin, D. R., & Altbach, M. I. (2019). Rapid high‐resolution T1 mapping using a highly accelerated radial steady‐state free‐precession technique. Journal of Magnetic Resonance Imaging, 49(1), 239-252.
3. Xue, Y., Yu, J., Kang, H. S., Englander, S., Rosen, M. A., & Song, H. K. (2012). Automatic coil selection for streak artifact reduction in radial MRI. Magnetic resonance in medicine, 67(2), 470-476.
4. Grimm, R., Forman, C., Hutter, J., Kiefer, B., Hornegger, J., & Block, T. (2013). Fast automatic coil selection for radial stack-of-stars GRE imaging. In Proceedings of the 21st Annual Meeting of ISMRM (p. 3786).
5. Mandava, S., Keerthivasan, M. B., Martin, D. R., Altbach, M. I., & Bilgin, A. (2019). Radial streak artifact reduction using phased array beamforming. Magnetic resonance in medicine, 81(6), 3915-3923.
6. Fu, Z., Altbach, I.M., & Bilgin, A. (2021). Cancellation of streak artifacts using the interference null space (CACTUS) for radial abdominal imaging. In Proceedings of the 29th Annual Meeting of ISMRM (#0670).
7. Altbach, M. I., Outwater, E. K., Trouard, T. P., Krupinski, E. A., Theilmann, R. J., Stopeck, A. T, & Gmitro, A. F. (2002). Radial fast spin‐echo method for T2‐weighted imaging and T2 mapping of the liver. Journal of Magnetic Resonance Imaging, 16(2), 179-189.
8. Tamir, J. I., Uecker, M., Chen, W., Lai, P., Alley, M. T., Vasanawala, S. S., & Lustig, M. (2017). T2 shuffling: sharp, multicontrast, volumetric fast spin‐echo imaging. Magnetic resonance in medicine, 77(1), 180-195.
9. Golub, G., & Pereyra, V. (2003). Separable nonlinear least squares: the variable projection method and its applications. Inverse problems, 19(2), R1.
Figures