5013
High resolution 3D whole brain T1, T2, T2* and QSM mapping within 3.5 mins
Jinwei Zhang1, Thanh Nguyen2, Eddy Solomon2, Hang Zhang1, Chao Li1, Alexey Dimov2, Pascal Spincemaille2, and Yi Wang2
1Cornell University, New York, NY, United States, 2Weill Cornell Medicine, New York, NY, United States
1Cornell University, New York, NY, United States, 2Weill Cornell Medicine, New York, NY, United States
Synopsis
A 3D whole brain T1, T2, T2*, QSM mapping pipeline was proposed for fast multi-parametric quantitative imaging. A multi-echo gradient echo (mGRE) sequence with varying sampling patterns along echoes was implemented to acquire signals for T2* and QSM mapping. A multi-contrast MR fingerprinting (MRF) sequence with both inversion recovery and T2 preparation pulses and varying sampling patterns among contrasts was implemented to acquire signals for T1 and T2 mapping. A deep ADMM network was used to reconstruct mGRE images. The magnitude image from reconstructed mGRE images was used to guide the reconstruction of MRF images with directional joint TV regularization.
Introduction
Quantitative parameter mappings in brain tissues provide comprehensive characteristics for accurate diagnosis. Multi-parametric mapping usually results in long scan time as MR signals under different magnetization preparations need to be acquired for parameter fitting. On the other hand, MR fingerprinting (MRF) [1] proposed a dictionary matching based approach for tissue relaxation parameter mapping. In this work, we show our preliminary results of whole brain T1, T2, T2* and susceptibility mapping acceleration using deep neural network and iterative reconstructions.Methods
Pulse sequences: In Figure 1(a), a multi-contrast MRF sequence including both inversion recovery and T2 preparation pulses was implemented to acquire MRF time series signals. Cartesian spiral acquisition scheme [2] with centric ordering of k-space sampling was used by varying the sampling patterns across different acquisition blocks in Figure 1. T2* and QSM were estimated using multi-echo complex signal fitting and dipole inversion. In Figure 1(b), a modified multi-echo gradient echo (mGRE) sequence with varying sampling patterns along echoes in each TR was implemented to acquire signals for T2* and QSM mapping. Both sequences in (a) and (b) were accelerated with a factor (12.5% under-sampling)Image reconstructions: A deep ADMM network was used to reconstruct mGRE images for QSM and T2* mapping [3]. The magnitude image from reconstructed mGRE images was used to guide the reconstruction of MRF images with directional joint TV (dJTV) regularization:
$$ \| UFSx - b\|_F^2 + \lambda |\ MJx\|_F^2 $$
where $$$x$$$ the four contrast images to reconstruct, $$$U$$$ the under-sampling patterns of four contrasts, $$$F$$$ Fourier transform, $$$S$$$ coil sensitivity maps, $$$b$$$ the acquired under-sampled k-space data, $$$M$$$ the directional matrix of spatial gradient derived from the magnitude image of deep ADMM reconstructed mGRE images, $$$J$$$ the Jacobian matrix of four contrast images.
Parameter estimations: T1 and T2 relaxation times were estimated using MRF framework with dictionary matching. Block simulation was implemented to simulate the sequence in Figure 1(a) with various T1 and T2 pairs. Voxel-wise dictionary matching was deployed between reconstructed four contrast images and simulated signal evolutions to find the closet T1 and T2 pair. The reconstruction and parameter estimation workflow is shown in Figure 2.
Results
Preliminary results were shown in Figure 3. Reasonable T1 and T2 values of white matters (average 830ms and 73ms in Figure 3) [4] show the feasibility of the proposed method for multi-parametric quantification. Total scan time of two sequences was 3.5mins with voxel size 1*1*2 mm^3. As a comparison, replacing single-echo GRE with multi-echo GRE in Figure 1a requires a total scam time of 6.5 mins under the same acceleration factor, which has twice scan time compared to the proposed method.Discussion and conclusions
We showed our preliminary results of whole brain T1, T2, T2* and QSM mappings under 4 mins with voxel size 1*1*2 mm^3. Future work includes incorporating mGRE acquisition block of Figure 1b into one of the acquisition blocks in MRF sequence Figure 1a, such as the third acquisition block for single-scan.Acknowledgements
No acknowledgement found.References
- Ma, Dan, et al. "Magnetic resonance fingerprinting." Nature 495.7440 (2013): 187-192.
- Prieto, Claudia, et al. Journal of Magnetic Resonance Imaging 41.3 (2015): 738-746.
- Zhang, Jinwei, et al. arXiv preprint arXiv:2103.05878 (2021).
- Wansapura, Janaka P., et al. Magnetic Resonance in Medicine 9.4 (1999): 531-538.
Figures

Figure 1. (a): a multi-contrast MRF sequence including both inversion recovery and T2
preparation pulses. (b): a multi-echo gradient
echo (mGRE) sequence for QSM and T2* mapping

Figure 2. Reconstruction and parameter estimation workflow.
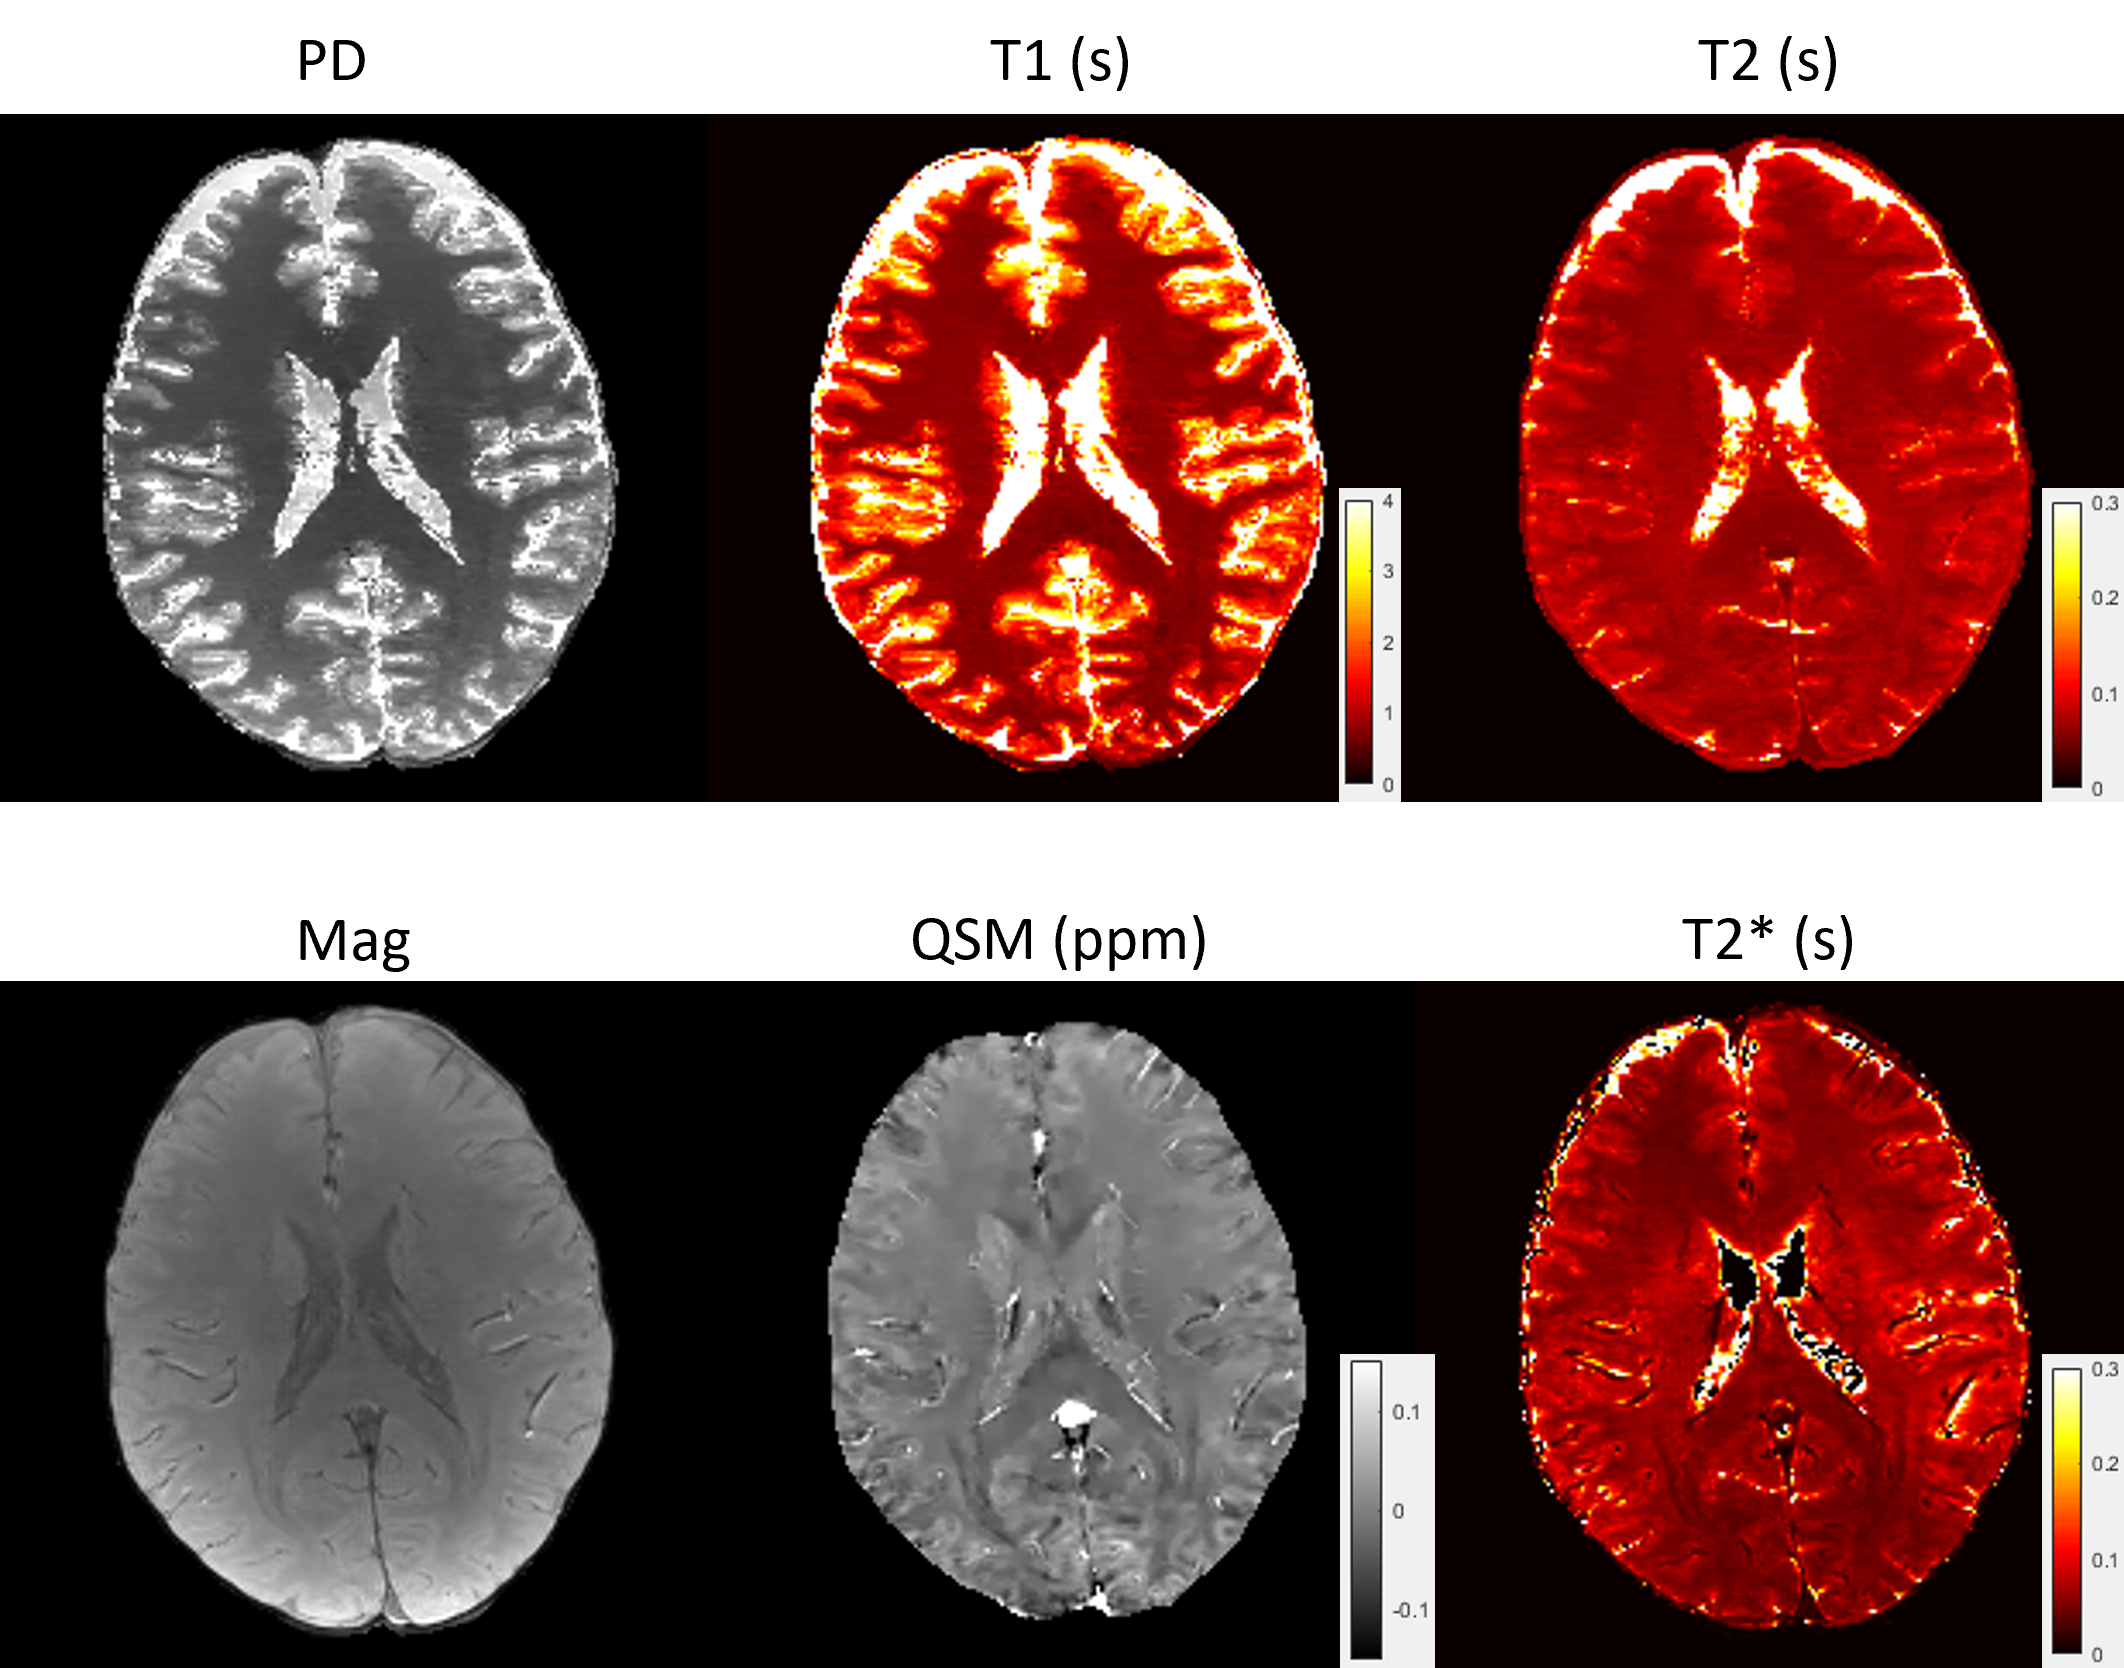
Figure 3. Preliminary results of multi-parametric mapping. Reasonable T1 and T2 values
of white matters (average 830ms and 73ms) show the
feasibility of the proposed method for multi-parametric quantification.
DOI: https://doi.org/10.58530/2022/5013