5009
Myelin Imaging Using 3D Dual-echo Ultra-short Echo Time MRI with Rosette k-Space Pattern1Weldon School of Biomedical Engineering, Purdue University, West Lafayette, IN, United States, 2Department of Radiology, Medical Physics, University of Freiburg, Freiburg, Germany, 3College of Veterinary Medicine, Purdue University, West Lafayette, IN, United States, 4Wellcome Centre for Integrative Neuroimaging, University of Oxford, Oxford, United Kingdom, 5Health Science Department, Purdue University, West Lafayette, IN, United States
Synopsis
This study aimed to develop a new 3D dual-echo rosette k-space trajectory, specifically for applications of ultra-short echo time (UTE) magnetic resonance imaging (MRI). The direct imaging of the myelin bilayer, which has ultra-short transverse relaxation time (uT2), was acquired to test the performance of the proposed UTE sequence. The rosette trajectory was developed based on rotations of a ‘petal-like’ pattern in the kx-ky plane, with oscillated extensions in kz-direction for 3D coverage. The higher uT2 fraction value in white matter (WM) compared to grey matter (GM) demonstrated the ability of the proposed sequence to capture rapidly decaying signals.
Introduction
Myelin constituents are water and dry mass, in which the dry mass is composed of about 80% lipids and 20% protein1. Since transverse relaxation of the lipid proton signal becomes shorter in this geometrically restricted environment, T2 values vary from a few microseconds to milliseconds, where 75% of the myelin lipid signal manifests T2 values below 100 μs2. Thus, conventional MRI sequences with echo times (TEs) in the order of milliseconds or longer can hardly capture the rapid signal decay of the lipid bilayer. On the other hand, ultra-short echo time (UTE) MRI3 sequences are capable of acquiring data with TE in the order of microseconds (μs), which can provide images of tissues with ultra-short T2 directly.For UTE sequences, the readout gradients are applied immediately after the completion of the RF pulses. Therefore, to achieve minimum possible TE, each data acquisition in UTE sequences needs to follow a center-out trajectory. The most common k-space trajectory used in UTE MRI applications is a 3D radial center-out readout. However, sampling the outer k-space with a radial pattern may not be efficient4. Rosette k-space trajectories, which allow a center-out sampling pattern while providing more samples in the outer k-space per spoke than radial trajectories, are also potential candidates for 3D UTE MRI. However, to date, 3D rosette k-space patterns have not yet been demonstrated in UTE applications.
This study aimed to develop a new 3D dual-echo rosette k-space trajectory, specifically for applications of UTE MRI. The direct imaging of the myelin bilayer, which has ultra-short transverse relaxation time (uT2), was acquired to test the performance of the proposed UTE sequence.
Methods
The following equations define the 3D rosette k-space trajectory5:Kxy(t)=Kx(t)+i*Ky(t)=(Kmax*cos(φ))*sin(ω1*t)*eiω2t+β
Kz(t)=(Kmax*sin(φ))*sin(ω1*t)
where Kmax is the maximum extent of k-space, ω1 is the frequency of oscillation in the radial direction, ω2 is the frequency of rotation in the angular direction, φ determines the location in the z-axis, and β determines the initial phase in the angular direction.
In Figure 1A, a rosette trajectory is shown for the specific case where ω1 and ω2 are set to be equal. With a manual separation at the middle of each data readout, dual-echo images can be achieved within a single acquisition (Figure 1A and 1B). TE values are separately determined by the time of two crossings of the k-space origin. The gradients of one petal trajectory are shown in Figure 1B.
Five healthy volunteers were recruited and underwent ten dual-echo rosette UTE scans at varied echo times (TEs) with a whole-body 3T MRI scanner (Siemens Healthineers, Erlangen, Germany). The parameters for the UTE acquisition were: Kmax=250/m, ω1=ω2=1.611 kHz, number of total petals= 36100, samples per petal=210, φ was sampled uniformly in the range of [-π/2, π/2], and β was sampled uniformly in the range of [0,2π], field of view (FOV)=240x240x240 mm3, matrix size=120x120x120, readout dwell time=10 μs, flip angle=7-degree, TR=7 ms, readout duration=2.1 ms. Ten repeated dual-echo UTE scans were performed with varied TEs. A compressed sensing approach was used for image reconstruction, using total generalized variation (TGV) as the sparsifying penalty 6. Dual-exponential model fitting was performed to separate uT2 signals, with the output of uT2 fraction, uT2 value and long T2 value.
Results
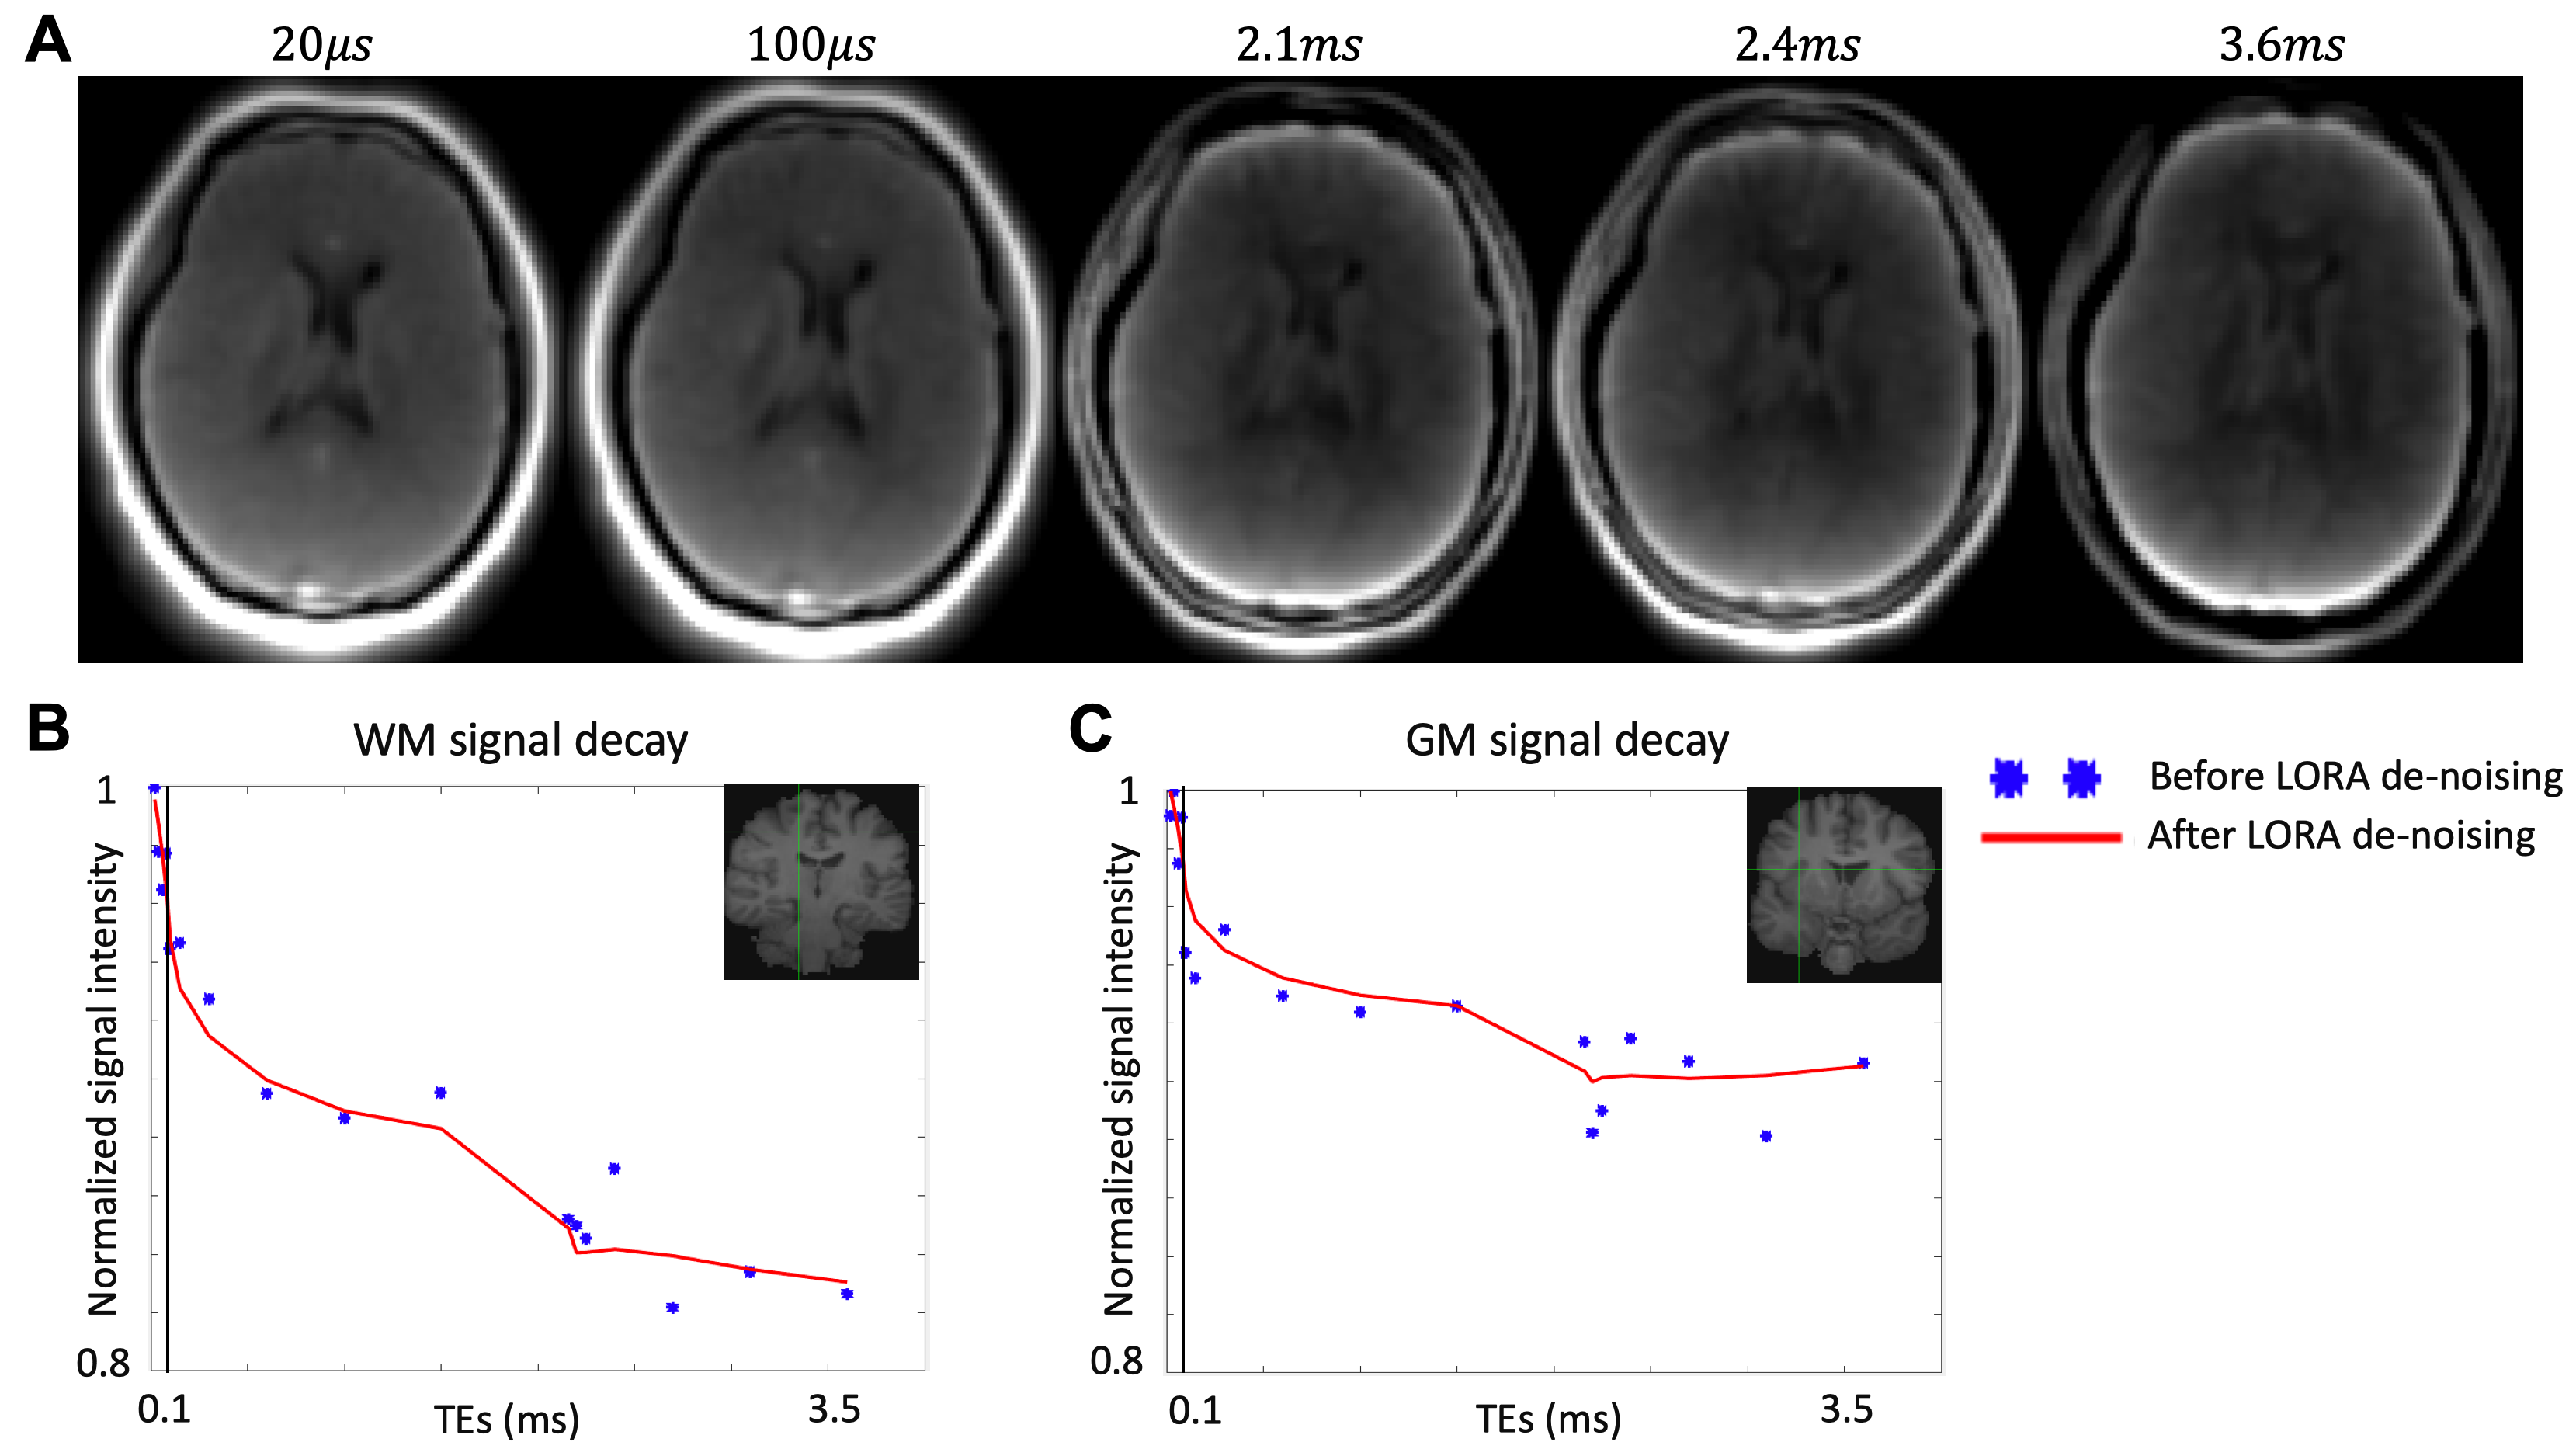
In Figure 2A, brain image slices from a volunteer are shown for five representative TEs, 20 μs, 100 μs, 2.1 ms, 2.4 ms, and 3.6 ms. The reconstructed images’ signal contrast between white matter (WM) and grey matter (GM) increased with longer TEs. Figures 2B and 2C show the differences in signal decay between WM (Figure 2B) and GM (Figure 2C).Figure 3 shows the mean uT2 fraction map (Figure 3A), the mean ultra-short T2 value map (Figure 3B), and the mean long T2 value map (Figure 3C) in MNI-152 space. The uT2 fraction map (Figure 3A) indicated a generally homogeneous uT2 fraction among voxels in WM, which is higher than the uT2 fraction among voxels in GM (10.9%±1.9% vs. 5.7%±2.4%). The ultra-short T2 value in WM was around 0.12 ms, and the ultra-short T2 value in GM was slightly faster than WM (0.08 ms). The long T2 components T2 value map indicated an increased T2 value across GM and the cerebrospinal fluid (CSF) compared to the WM, which is in line with previous literatures7,8.
Discussion
The advantages of the rosette k-space design included: 1) increased sampling density in the outer k-space; 2) shorter TE due to the gradient design without ramp-up time; 3) a smooth transition between the two echoes in dual-echo acquisition. A statistically significantly higher uT2 fraction value was found in WM compared to GM. In addition, the uT2 fraction value was homogeneously distributed among WM voxels. However, the influence of iron content9 and other macromolecules10 was not ruled out, which led a future research direction.Conclusion
This study proposed a novel 3D rosette k-space trajectory, specifically for UTE applications. The higher uT2 fraction value in WM compared to GM demonstrated the ability of this sequence to capture rapidly decayed signals. In addition, the fitting based on the dual-exponential model provided quantitative results of the uT2 fraction, which could be used for myelination assessment in the future.Acknowledgements
Data acquisition was supported in part by NIH grant S10 OD012336. This project supported by an award from the Ralph W. and Grace M. Showalter Research Trust.References
1. Greenfield S, Brostoff S, Eylar EH, Morell P. Protein composition of myelin of the peripheral nervous system. J Neurochem 1973;20(4):1207-1216.
2. Wilhelm MJ, Ong HH, Wehrli SL, Li C, Tsai PH, Hackney DB, Wehrli FW. Direct magnetic resonance detection of myelin and prospects for quantitative imaging of myelin density. Proc Natl Acad Sci U S A 2012;109(24):9605-9610.
3. Madio DP, Lowe IJ. Ultra-fast imaging using low flip angles and FIDs. Magn Reson Med 1995;34(4):525-529.
4. Wan L, Zhao W, Ma Y, Jerban S, Searleman AC, Carl M, Chang EY, Tang G, Du J. Fast quantitative 3D ultrashort echo time MRI of cortical bone using extended cones sampling. Magn Reson Med 2019;82(1):225-236.
5. Zahneisen B, Grotz T, Lee KJ, Ohlendorf S, Reisert M, Zaitsev M, Hennig J. Three-dimensional MR-encephalography: fast volumetric brain imaging using rosette trajectories. Magn Reson Med 2011;65(5):1260-1268.
6. Knoll F, Bredies K, Pock T, Stollberger R. Second order total generalized variation (TGV) for MRI. Magn Reson Med 2011;65(2):480-491.
7. Boucneau T, Cao P, Tang S, Han M, Xu D, Henry RG, Larson PEZ. In vivo characterization of brain ultrashort-T2 components. Magn Reson Med 2018;80(2):726-735.
8. Sati P, van Gelderen P, Silva AC, Reich DS, Merkle H, de Zwart JA, Duyn JH. Micro-compartment specific T2* relaxation in the brain. Neuroimage 2013;77:268-278.
9. Snyder AM, Connor JR. Iron, the substantia nigra and related neurological disorders. Biochim Biophys Acta 2009;1790(7):606-614.
10. Sheth VR, Fan S, He Q, Ma Y, Annese J, Switzer R, Corey-Bloom J, Bydder GM, Du J. Inversion recovery ultrashort echo time magnetic resonance imaging: A method for simultaneous direct detection of myelin and high signal demonstration of iron deposition in the brain - A feasibility study. Magn Reson Imaging 2017;38:87-94.
Figures