5007
Intraplatform Repeatability and Interplatform Reproducibility of T1 and T2 Mapping Using a NIST System Phantom1Radiology, Mayo Clinic Arizona, Phoenix, AZ, United States, 2Neurosurgery, Mayo Clinic Arizona, Phoenix, AZ, United States
Synopsis
Quantitative magnetic resonance imaging, especially T1/T2 relaxation time mapping is increasingly used in both research and clinical practice. The purpose of this study was to assess the precision and cross-platform repeatability and reproducibility of T1 and T2 mapping modules on GE and Siemens MRI platforms, with the goal of standardization across vendors. A standard MRI quantitative phanom was scanned on four scanners, twice per scanner. GE data was processed with a custom script. Our results show high intraplatform repeatability, but showed high inter-platform discrepancies for both T1 and T2 results.
Introduction
Quantitative magnetic resonance imaging (qMRI), including the mapping of the relaxation time constants T1 and T2, is increasingly used in both research and clinical practice1,2. qMRI has widely been employed to measure tissue characteristics precisely for assessing different types of diseases, and recent advances have shown promise in evaluating diseases of the brain, body and MSK system. These new quantitative values can be valuable in the planning of surgical resection, radiation treatment planning, and other clinical applications. However, differences in pulse sequence, field strength, software version, hardware, and vendors can result in variations in T1 and T2 mapping results3. The purpose of this study is to assess the precision and cross-platform repeatability and reproducibility of vendor-independent T1 and T2 mapping modules on GE and Siemens MRI platforms, with the goal of standardization across vendors.Methods
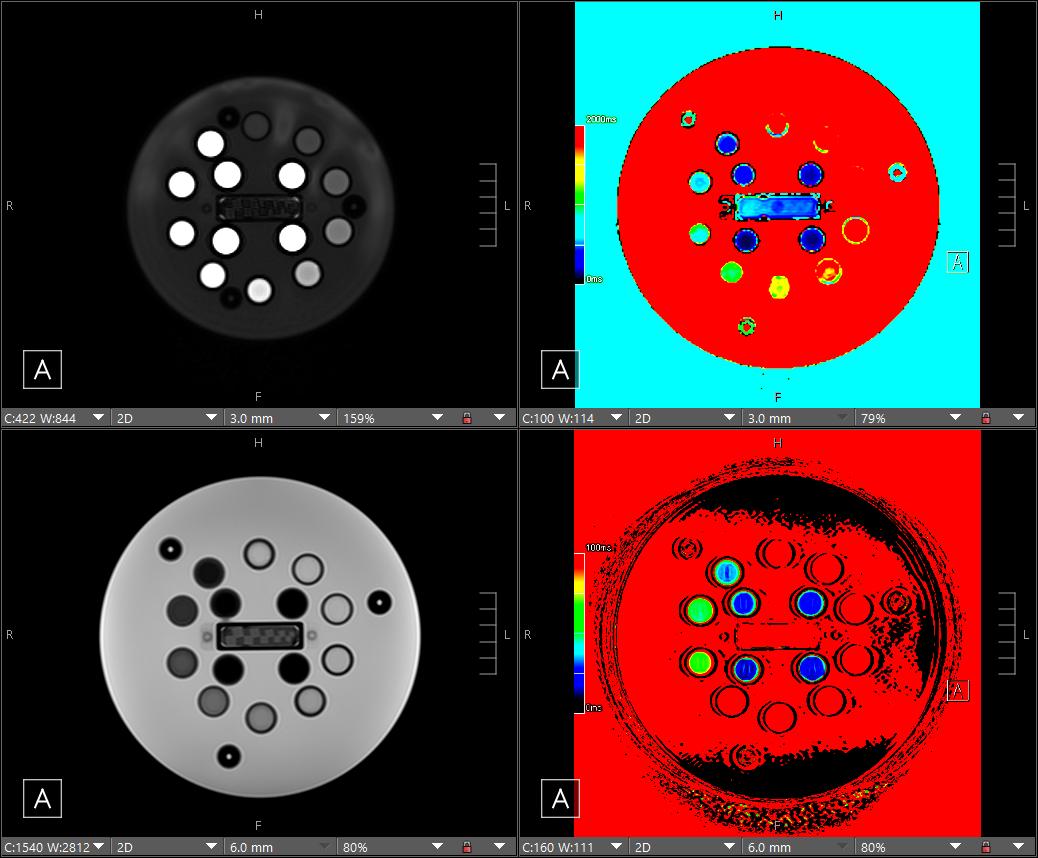
A NIST MRI system phantom was scanned on four MR platforms: 3T GE PETMR, 3T GE 750W, 3T Siemens Vida, and a 1.5T Siemens Sola. The phantom was scanned twice per platform, using a head receive-only coil. For T1, a variable flip angle (VFA) method was used; for T2, a multi-echo spin echo method was used. For Siemens scanners; the T1 and T2 values were derived by drawing ROIs on in-line post-processed T1/T2 maps (Mapit) that were automatically generated by the scanner. For GE scanners, ROIs were drawn over the source images for each flip angle/TE for T1 and T2 sequences, respectfully. The signal intensities from the ROIs were fitted to the MR signal equations in a custom MATLAB script and the T1/T2 decay constants extracted from the fitted curves. The sequence parameters were matched to the phantom manufacturer’s recommended values. 100mm2 circular ROIs were all drawn in Visage PACS by a single individual for quantitative measures.Results
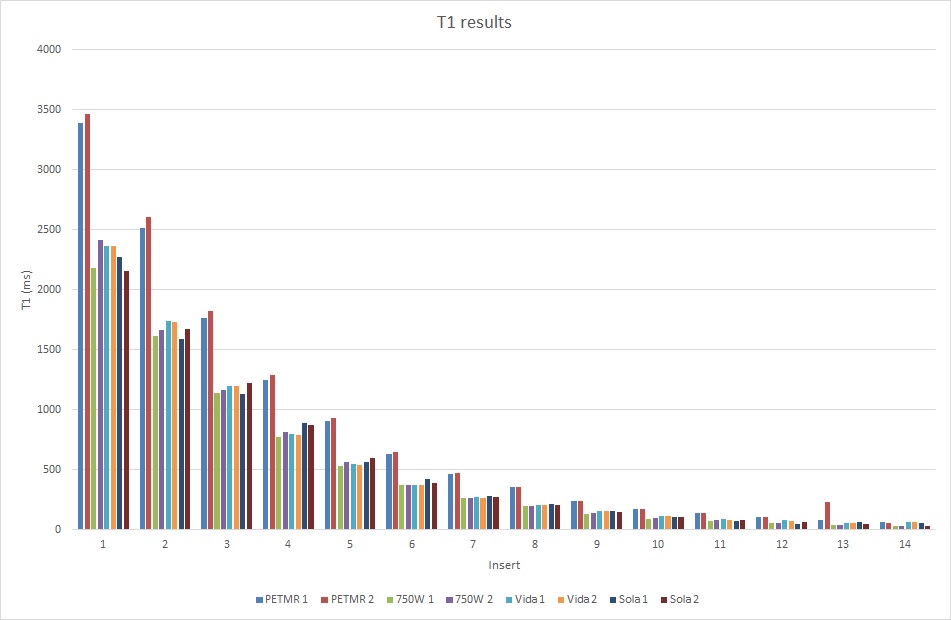
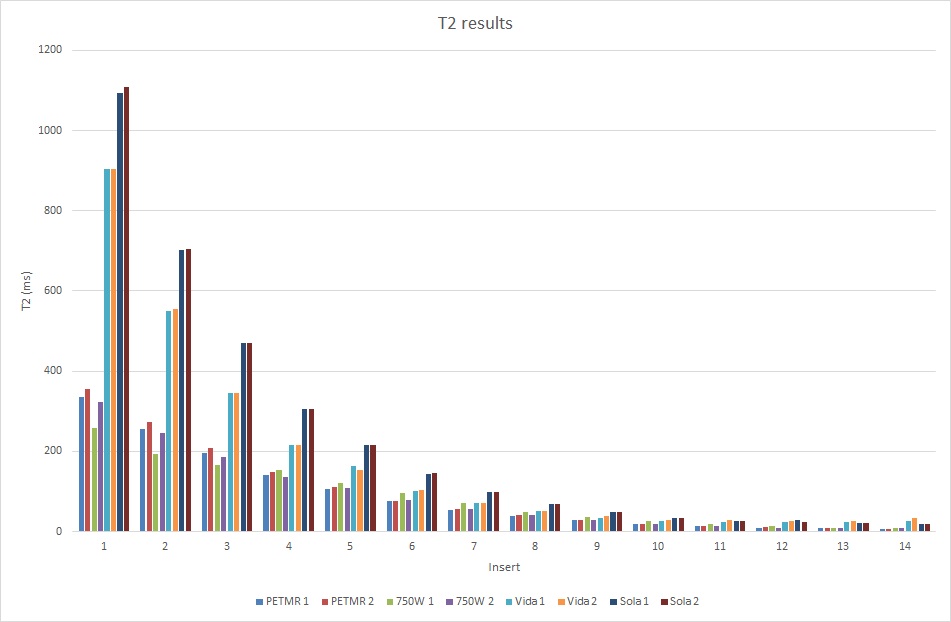
Quantified T1 and T2 values for each scanner are summarized in figures 2 and 3.Discussion
Overall, our data shows that T1 and T2 mapping has high intra-platform reproducibility, but low inter-vendor agreement for T2 and low inter-platform agreement for T1 on GE scanners. The two trials for each scanner resulted in roughly 10% variability, likely due to minute differences ROI placement for each trial. The large difference in T1 measurements from GE between the PETMR and 750W MR platforms may be due to the differences in hardware and installed pulse sequences; however, effort was made to match all pulse sequence parameters between these two platforms. The differences seen between GE and Siemens for T2 mapping were much more stark, with Siemens scanners measuring T2 values up to 3x higher than that of GE. There may be significant differences in the post-processing algorithms, particularly from the automatic Mapit T1/T2 map generation on Siemens, that contribute to this large discrepancy.Conclusion
This study shows that T1 and T2 mapping data should be carefully reviewed, especially when comparing between different MR vendors and platforms, for differences that may be significant. Automated post-processing for qMRI applications may be convenient for operators, but results should be verified, preferably against calibrated quantitative MR phantoms, before committing to clinical usage. Further investigation will be necessary to fully explain the differences in the quantitative measures found in the data of this study.Acknowledgements
No acknowledgement found.References
1. Shridhar Konar A, Qian E, Geethanath S, et al. Quantitative imaging metrics derived from magnetic resonance fingerprinting using ISMRM/NIST MRI system phantom: An international multicenter repeatability and reproducibility study. Med Phys. 2021;48(5):2438-2447. doi:10.1002/mp.14833
2. Cashmore MT, McCann AJ, Wastling SJ, McGrath C, Thornton J, Hall MG. Clinical quantitative MRI and the need for metrology. Br J Radiol. 2021;94(1120):20201215. doi:10.1259/bjr.20201215
3. Keenan KE, Ainslie M, Barker AJ, et al. Quantitative magnetic resonance imaging phantoms: A review and the need for a system phantom. Magn Reson Med. 2018;79(1):48-61. doi:10.1002/mrm.26982
Figures