5004
Multi-site harmonization of diffusion MRI data from the Adolescent Brain Cognitive Development (ABCD) Study1Harvard Medical School and Brigham and Women's Hospital, Boston, MA, United States, 2Isomics, Cambridge, MA, United States
Synopsis
This study presents our harmonization efforts on the multi-site diffusion MRI data from ~11,000 adolescents in the Adolescent Brain Cognitive Development (ABCD) study, collected at 21 sites using Siemens, GE, and Philips scanners. We validated the harmonization of the multi-site dMRI data using several standard and advanced diffusion MRI measures including Fractional Anisotropy (FA), Return-To-Origin Probability (RTOP), Return To the Axis Probability (RTAP), Return To the Plane Probability (RTPP), Mean Squared Displacement (MSD).
Introduction
The Adolescent Brain Cognitive Development (ABCD) study is collecting a large repository of data pertaining to adolescent brain development containing cognitive, behavioral, and neuroimaging data from 11,000+ children acquired across 21 sites. Diffusion MRI (dMRI) data acquired as part of the ABCD study is a rich resource to investigate subtle neurodevelopmental pathologies in the tissue microstructure1. However, dMRI data is particularly sensitive to multi-site/multi-scanner differences due to magnetic field inhomogeneities and vendor-specific data reconstruction algorithms, which introduce substantial bias in the acquired data2. Hence, the data must be harmonized prior to any analysis. This abstract presents our harmonization efforts on this very large dataset, building on our success in harmonizing a large schizophrenia database3 as well as in the harmonization community challenge4. We validated our harmonization approach using several dMRI measures including Fractional Anisotropy (FA), Return-To-Origin Probability (RTOP), Return To the Axis Probability (RTAP), Return To the Plane Probability (RTPP), and Mean Squared Displacement (MSD)5.Methods
Dataset and brain masking.We used minimally preprocessed baseline dMRI data from the ABCD study (release 3) acquired on 3T Siemens, Philips, and GE scanners (Figure 1) from 21 sites using 45 different scanner-related settings (Hatton et al.6). The ABCD study does not provide the brain masks for the dMRI data, which is a prerequisite for our harmonization. Therefore, we applied and validated our deep learning-based brain masking tool that robustly extracts the brain from dMRI data (https://github.com/pnlbwh/CNN-Diffusion-MRIBrain-Segmentation).
Harmonization.
We applied our retrospective harmonization algorithm2 to remove the scanner-related differences across all sites. Our harmonization approach (https://github.com/pnlbwh/dMRIharmonization), based on rotation invariant spherical harmonics (RISH), works at the signal level to remove the scanner differences across sites while accounting for non-linearities both in the dMRI data and the scanner bias. Since each site had scanner upgrades or used multiple scanners during the study, we applied the harmonization across all 45 scanner-related settings, each of which we term as “dataset” henceforward. In the first step of the harmonization, we selected one dataset as the reference and the remaining 44 datasets were harmonized to this reference. To this end, a subset of 35 healthy subjects, who were age-, sex- and IQ-matched at the group level to the reference dataset, were selected to create the RISH feature templates to learn the scanner differences. This step is called template creation. After that, the learned mappings across RISH features were applied to the remaining dMRI data of the corresponding dataset to be harmonized to the reference (see Cetin Karayumak et al.2 for details).
Analysis.
We estimated FA, RTOP, RTAP, RTPP, and MSD using DIPY software5 on the original and harmonized datasets as well as the reference dataset. We computed the average over the whole brain white matter skeleton and 42 white matter bundles (see Figure 5)7,8 of these diffusion maps for each subject and compared the original and harmonized datasets to the reference dataset using unpaired t-tests. We set up two experiments to evaluate the performance of the harmonization: (Experiment i) We compared the original, harmonized, and reference datasets that were used in template creation (see Figures 2, 3, and 5a); (Experiment ii) Using an independent set of 35 subjects that were not used in the template creation, we repeated experiment i to demonstrate the performance of the harmonization on unseen data (Figure 4 and 5b).
Results
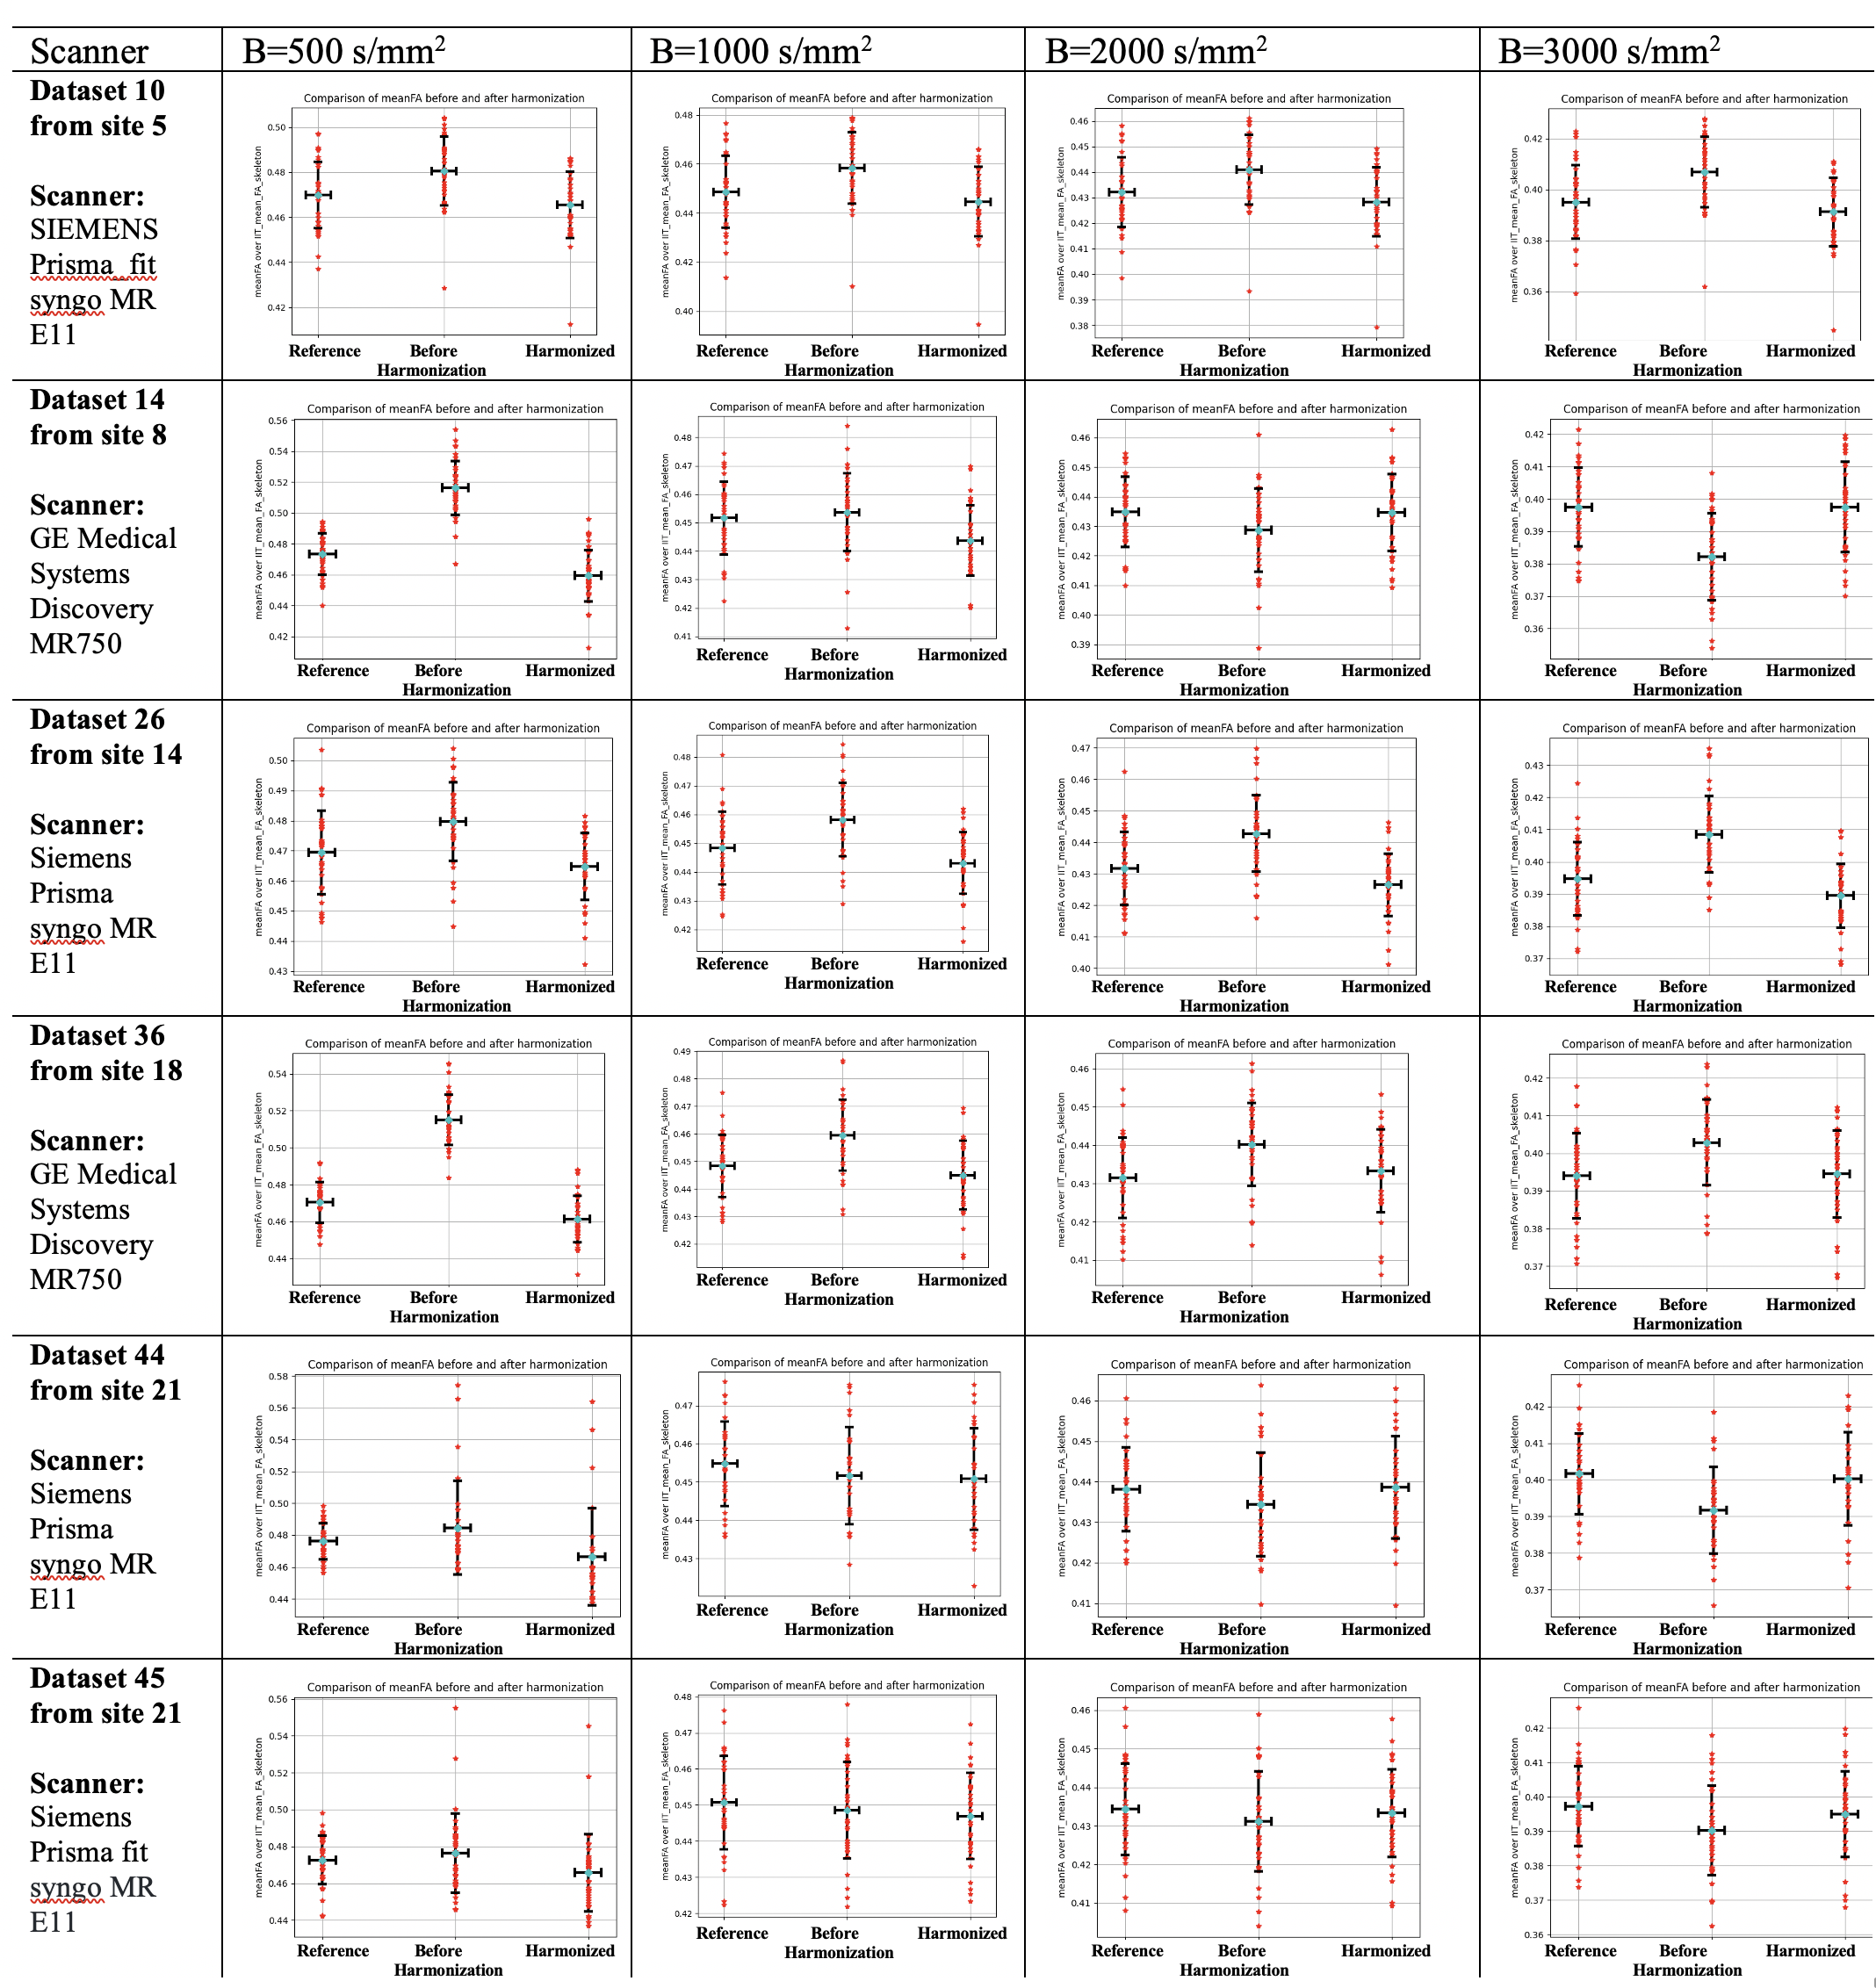
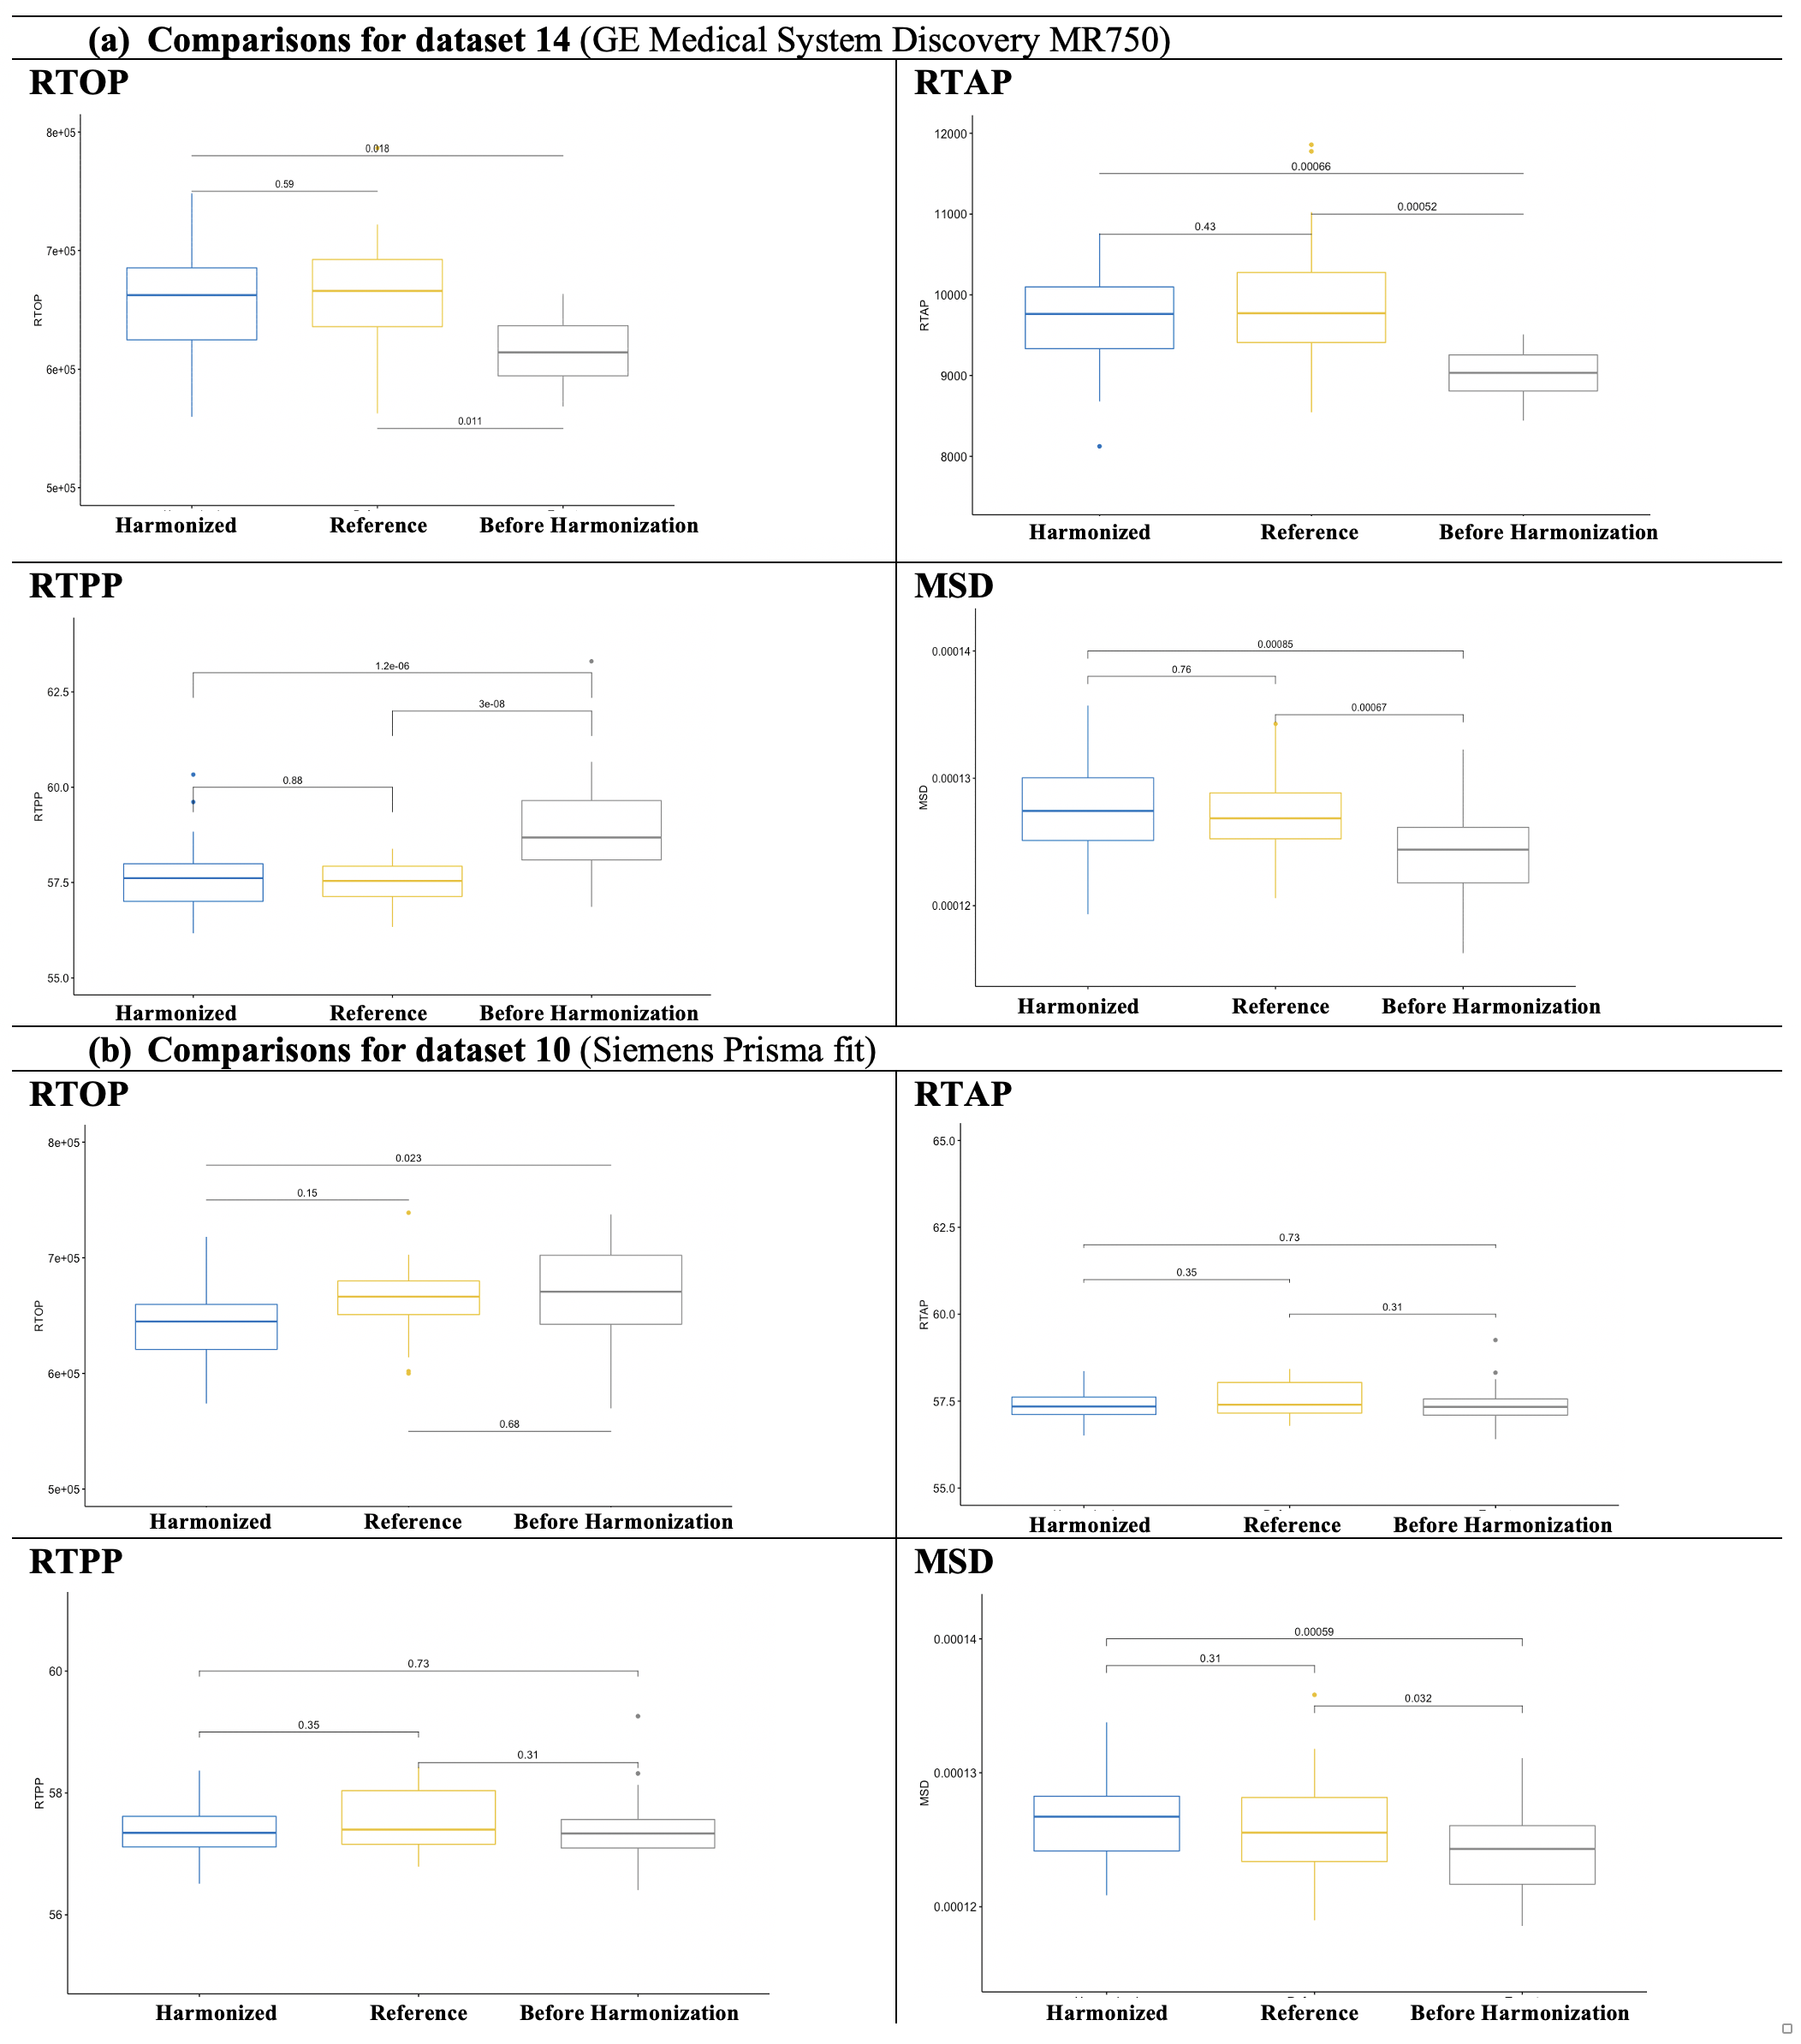
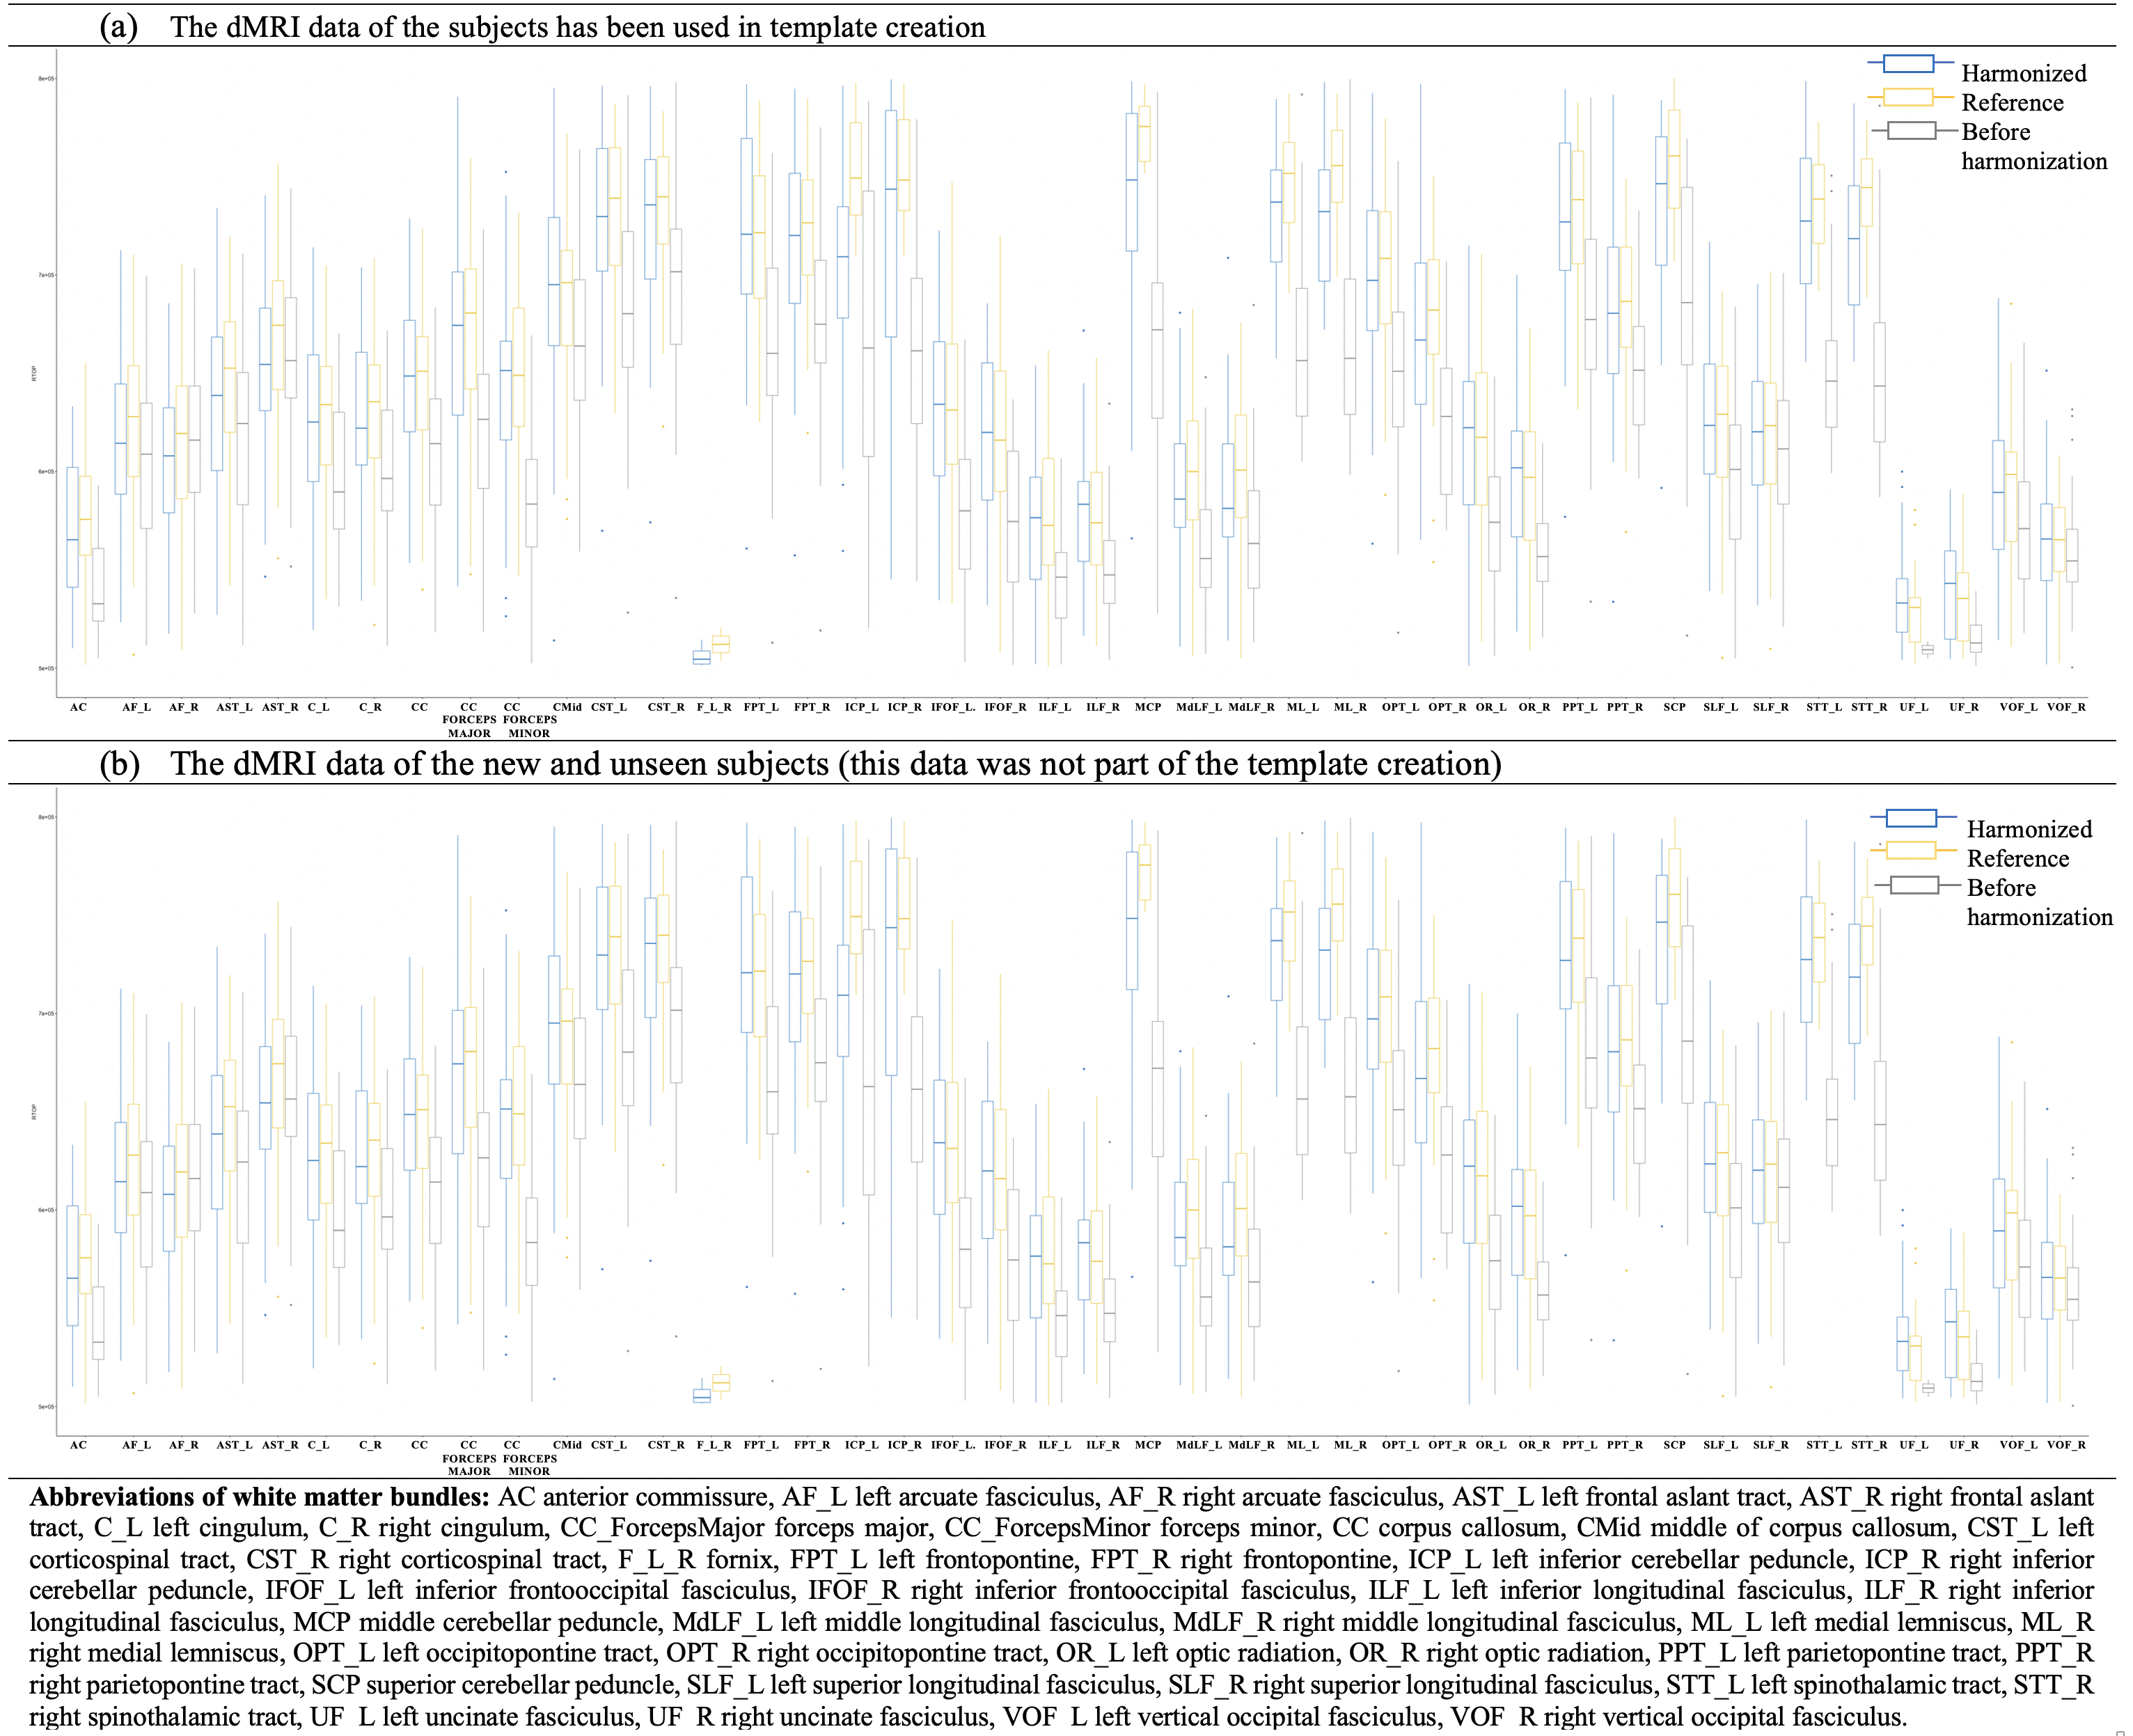
To-date we have harmonized data from ~10,000 subjects (GE, Siemens scanners). A dataset scanned with Siemens Prisma scanner from Site 16 was selected as a reference due to its large sample size and data quality. Other dMRI datasets with different scanner settings were harmonized to the reference individually.(Experiment i). Figure 2 compares the average FA across original (before harmonization), harmonized, and reference datasets for six datasets. The FA was computed over the whole brain white matter skeleton and computed independently for each b value (500, 1000, 2000, 3000 s/mm^2). Figure 3 shows the comparison of the average RTOP, RTAP, RTPP, and MSD measures over the whole brain white matter skeleton for dataset 14 (from GE scanner) and dataset 10 (from Siemens Prisma fir scanner). To better understand the regional pattern of differences, we also compared the diffusion measures in 42 white matter bundles across three groups (harmonized, before harmonization, and reference) (e.g., see Figure 5a for the results of RTOP).
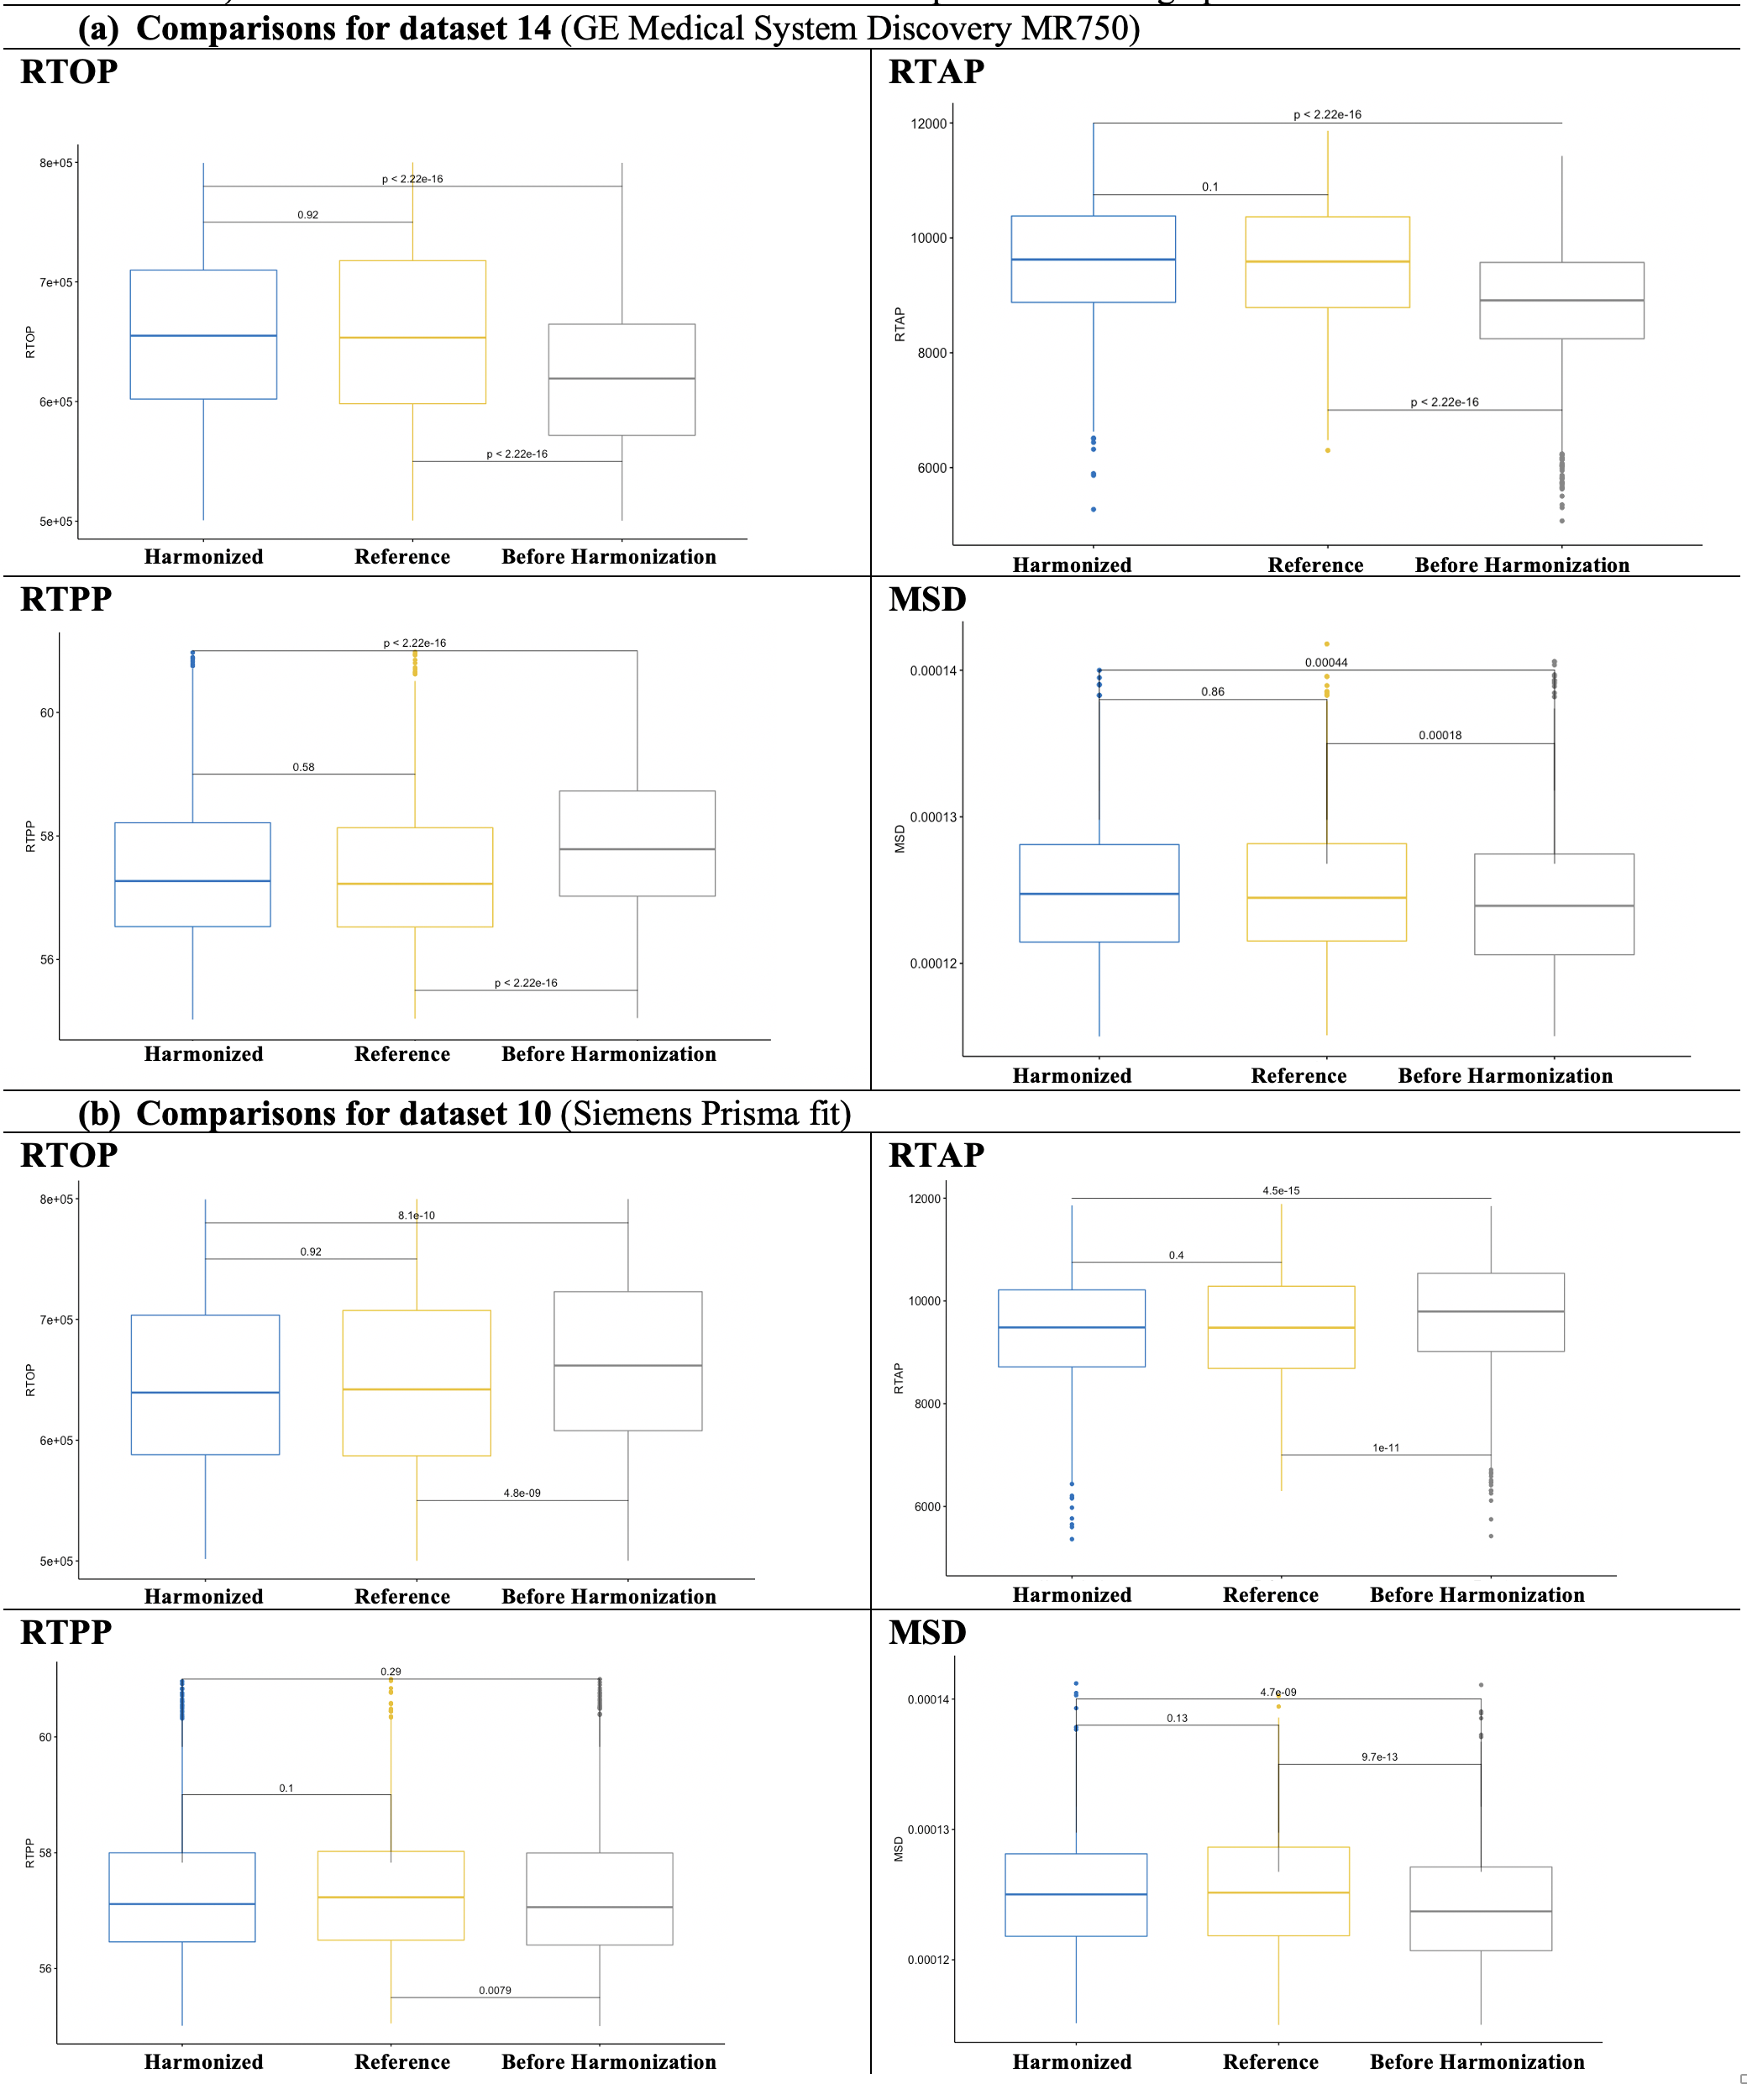
(Experiment ii). Figure 4 and Figure 5b show the comparisons using new and unseen subjects of dMRI datasets, which were again age-, sex- and IQ-matched but were not used in the template creation step. Both experiments demonstrated that harmonization removes the existing global and local scanner-related differences across datasets in both single-shell (FA) and multi-shell measures (RTOP, RTPP, RTAP, MSD). Further, it also showed robust performance on unseen new datasets which were not part of the learning.
Discussion and Conclusion
We presented our large-scale harmonization efforts on the multi-site dMRI data from the ABCD study. We note that the harmonized data will be shared in the NDA soon. This will allow large-scale data analysis as if the data comes from the same scanner, which significantly will increase statistical power with the ability to characterize better the neurodevelopmental changes in the white matter of adolescents.Acknowledgements
The authors have been supported by the following grants: NIH R01 MH119222 (Rathi, O'Donnell) and the BBRF NARSAD Young Investigator Award (PI: Cetin-Karayumak).References
1. Casey, B. J. et al. The Adolescent Brain Cognitive Development (ABCD) study: Imaging acquisition across 21 sites. Dev. Cogn. Neurosci. 32, 43–54 (2018).
2. Cetin Karayumak, S. et al. Retrospective harmonization of multi-site diffusion MRI data acquired with different acquisition parameters. Neuroimage 184, 180–200 (2019).
3. Cetin-Karayumak, S. et al. White matter abnormalities across the lifespan of schizophrenia: a harmonized multi-site diffusion MRI study. Mol. Psychiatry 25, 3208–3219 (2020).
4. Ning, L. et al. Cross-scanner and cross-protocol multi-shell diffusion MRI data harmonization: Algorithms and results. Neuroimage 221, 117128 (2020).
5. Garyfallidis, E. et al. Dipy, a library for the analysis of diffusion MRI data. Front. Neuroinform. 8, 8 (2014).
6. Hatton, S. Preview of the Adolescent Brain Cognitive Development (ABCD) Study Release 3.0. Biological Psychiatry vol. 87 S110–S111 (2020).
7. Garyfallidis, E. et al. Recognition of white matter bundles using local and global streamline-based registration and clustering. Neuroimage 170, 283–295 (2018).
8. Qi, X. & Arfanakis, K. Regionconnect: Rapidly extracting standardized brain connectivity information in voxel-wise neuroimaging studies. Neuroimage 225, 117462 (2021).
Figures