5003
Deep Learning Denoising Reconstruction (DLR) Preserves Quantitative DWI and DCE Signal Intensity Measures in Prostate MRI1Canon Medical Systems USA, Inc., Tustin, CA, United States
Synopsis
Deep Learning Reconstruction (DLR) has recently been translated into clinical practices as a few DLR methods have received FDA 510-k clearance. Given its novelties, rigorous evaluations are essential to ensure the safety and efficacy of DLR before routine clinical use. This work aims to investigate whether DLR preserves quantitative measures from DWI and DCE prostate MRI. The results show that the average signal intensities measured from routine images are similar (less than 1% difference) to those measured from DLR images.
Introduction
Deep Learning Reconstruction (DLR) has the potential to revolutionize MR image reconstruction and to be one of the most impactful technologies in radiology. By intelligently removing the noise, DLR allows achieving higher Signal-to-Noise Ratio (SNR) without increasing the scan time. As the DLR changes the SNR in the image, there is a concern that it also impacts the quantitative measurements. Therefore, a rigorous and comprehensive evaluation must be carried out before the wide adoption of DLR in clinical practice. This work focuses on answering the questions of how DLR affects quantitative measurements of Diffusion Weighted Imaging (DWI) and Dynamic Contrast Enhanced (DCE) in prostate MRI compared to the routine reconstruction method.Methods
A clinical prostate protocol was performed on five subjects on a 3T scanner (Canon Medical Systems, Tochigi, Japan). The images were reconstructed using the conventional reconstruction method (referred to as routine) and using Deep Learning Denoising Reconstruction [1] (referred to as DLR). Region of interest (ROI) was drawn on the center of the prostate on the DWI (b1400, isotropic DWI i.e. isoDWI at b50, isoDWI at b800, isoDWI at b1400, and isoADC images) and the DCE (1st frame, 5th frame, 10th frame, 15th frame, and 20th frame) images. Mean signal intensities and standard deviations of signal intensities within the drawn ROIs were recorded for analysis. The spatial locations of the ROIs placed on the routine images are identical to those placed on the DLR images. SNR was approximately calculated as mean signal intensity divided by standard deviation. A bar plot was used to visualize the mean signal intensities and standard deviation. The student’s t-test was used to evaluate whether there are significant differences between mean signal intensities measured from routine images compared to those measured from DLR images.Results
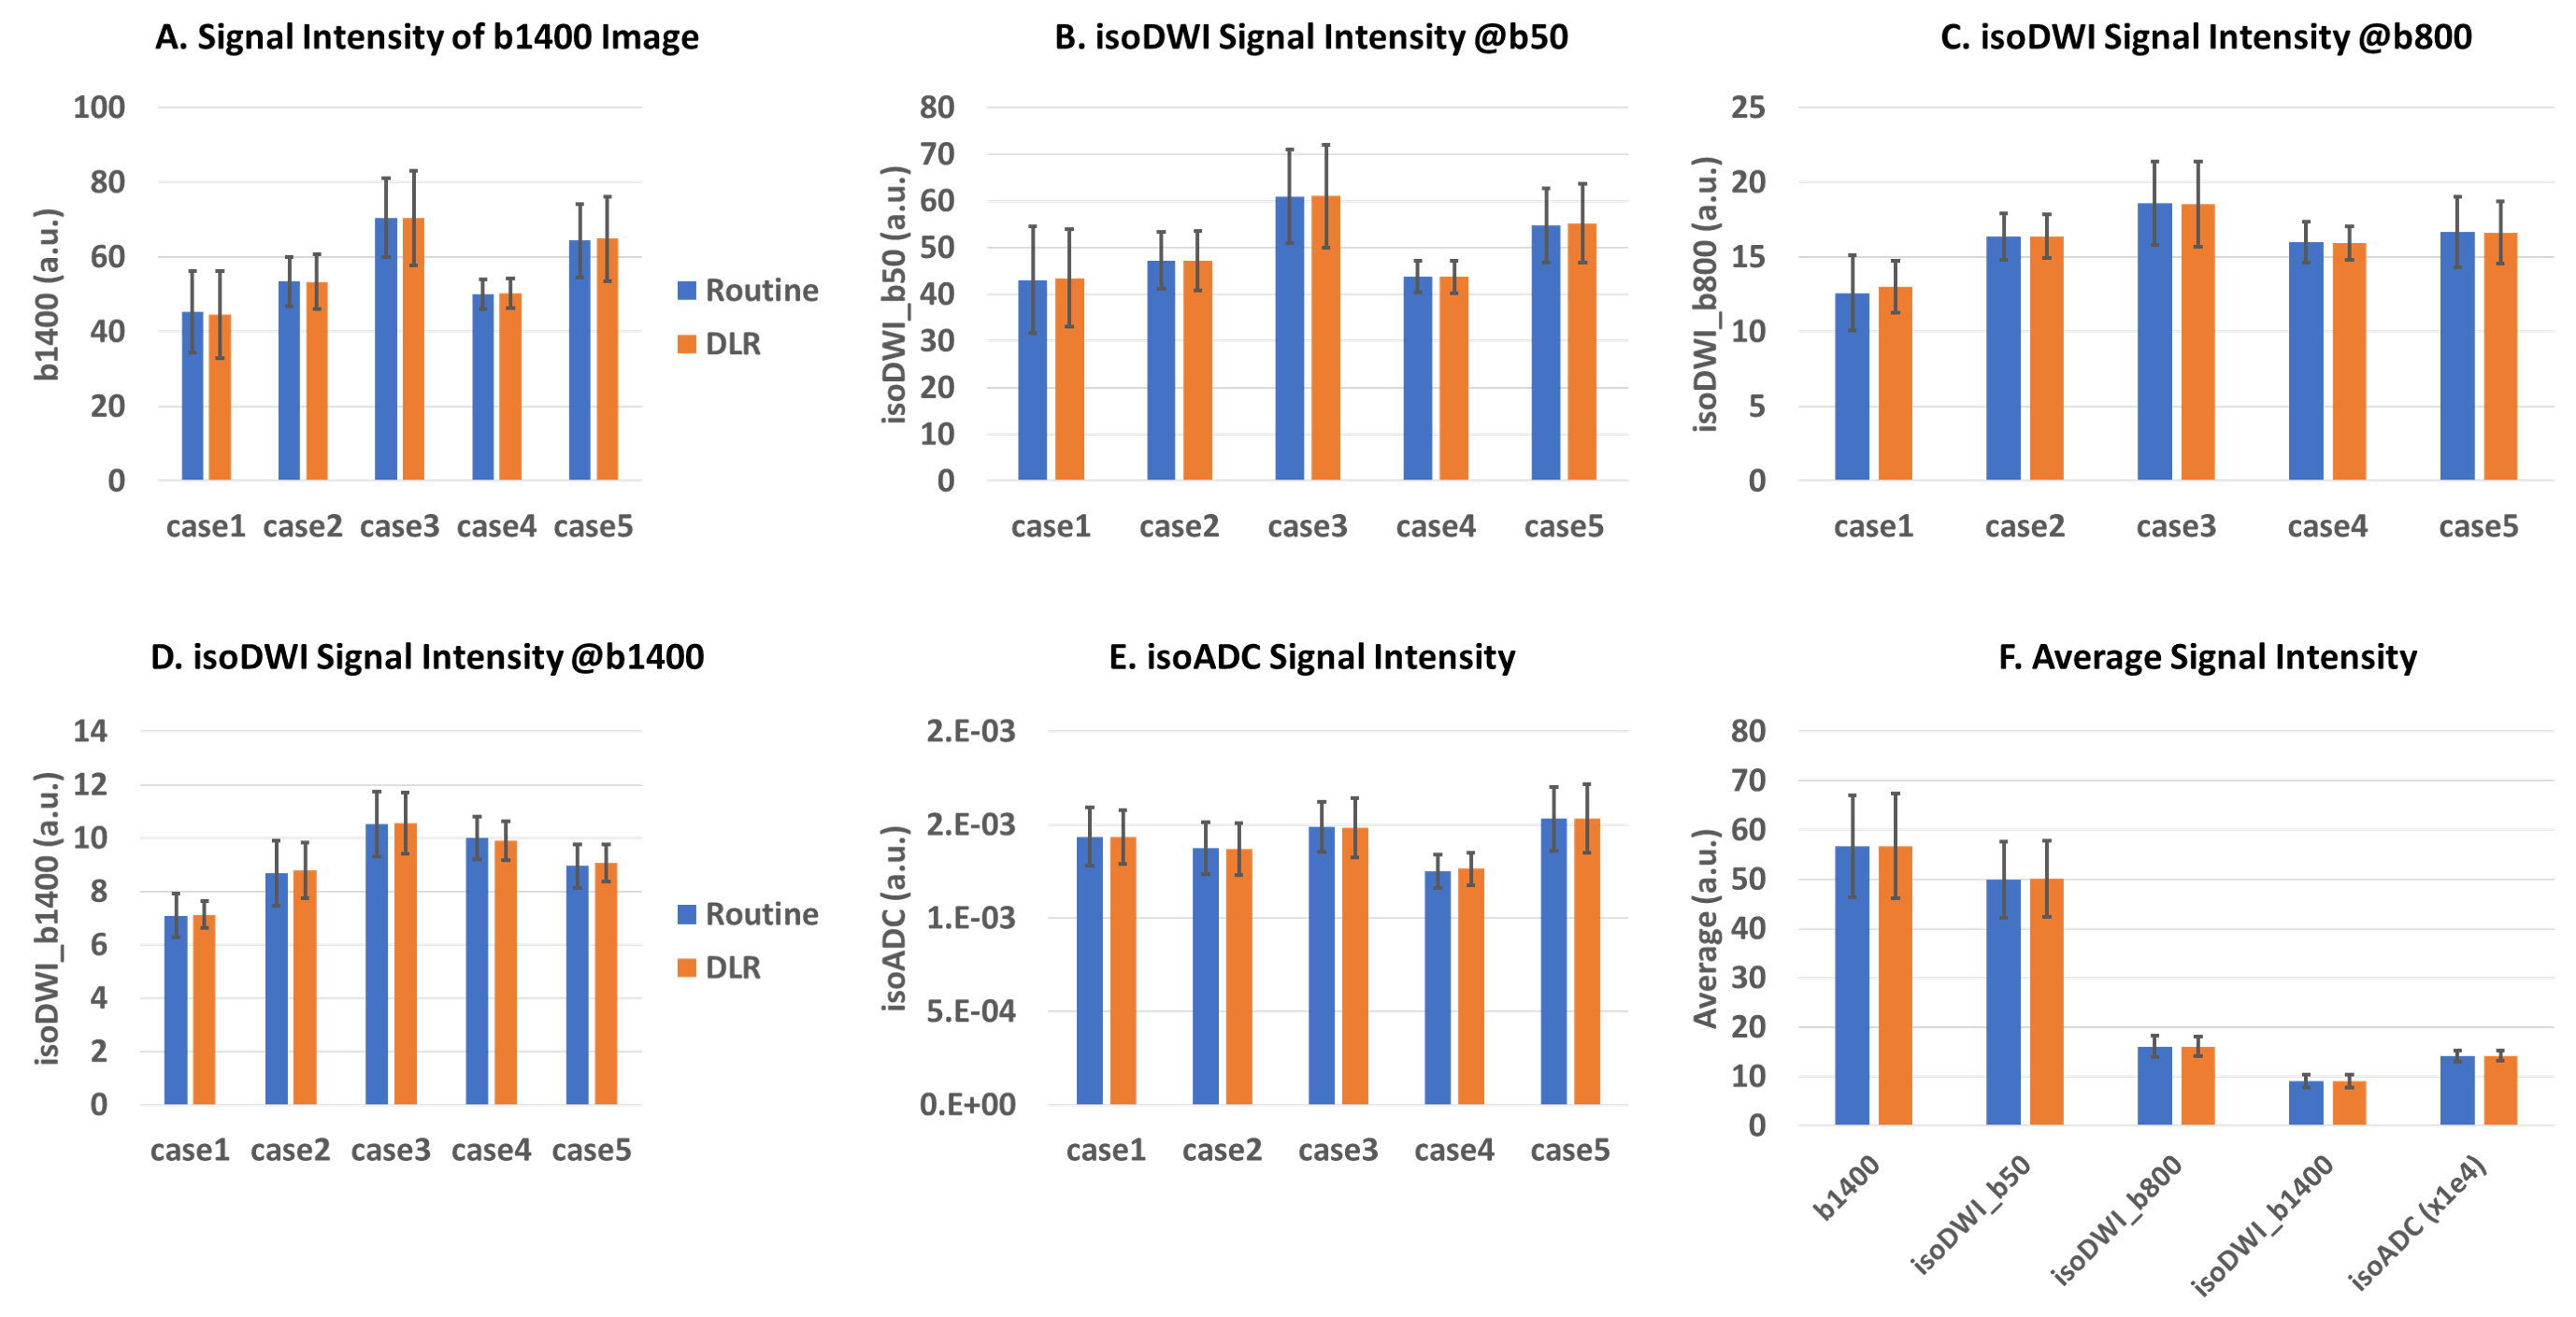
Bar plots in Figure 1 show mean signal intensities measured on routine images (blue) in comparison to the DLR images (orange) on DWI b1400 (Panel A), isoDWI at b50 (Panel B), isoDWI at b800 (Panel C), isoDWI at b1400 (Panel D), and isoADC (Panel E) images from five cases. Error bars represent the standard deviation of signal intensities within the drawn ROIs. Additionally, Figure 1 panel F shows the average signal intensity from five cases measured from routine (blue) and DLR (orange) images. Error bars in Panel F represent standard deviations of mean signal intensities among five subjects.Bar plots in Figure 2 show mean signal intensities measured on routine images (blue) in comparison to the DLR images (orange) on DCE 1sth frame (Panel A), 5th frame (Panel B), 10th frame (Panel C), 15th frame (Panel D), and 20th frame (Panel E) images from five cases. Error bars represent the standard deviation of signal intensities within the drawn ROIs. Additionally, Figure 2 panel F shows average signal intensity from five cases measured from routine (blue) and DLR (orange) images. Error bars in Panel F represent standard deviations of mean signal intensities among five subjects.
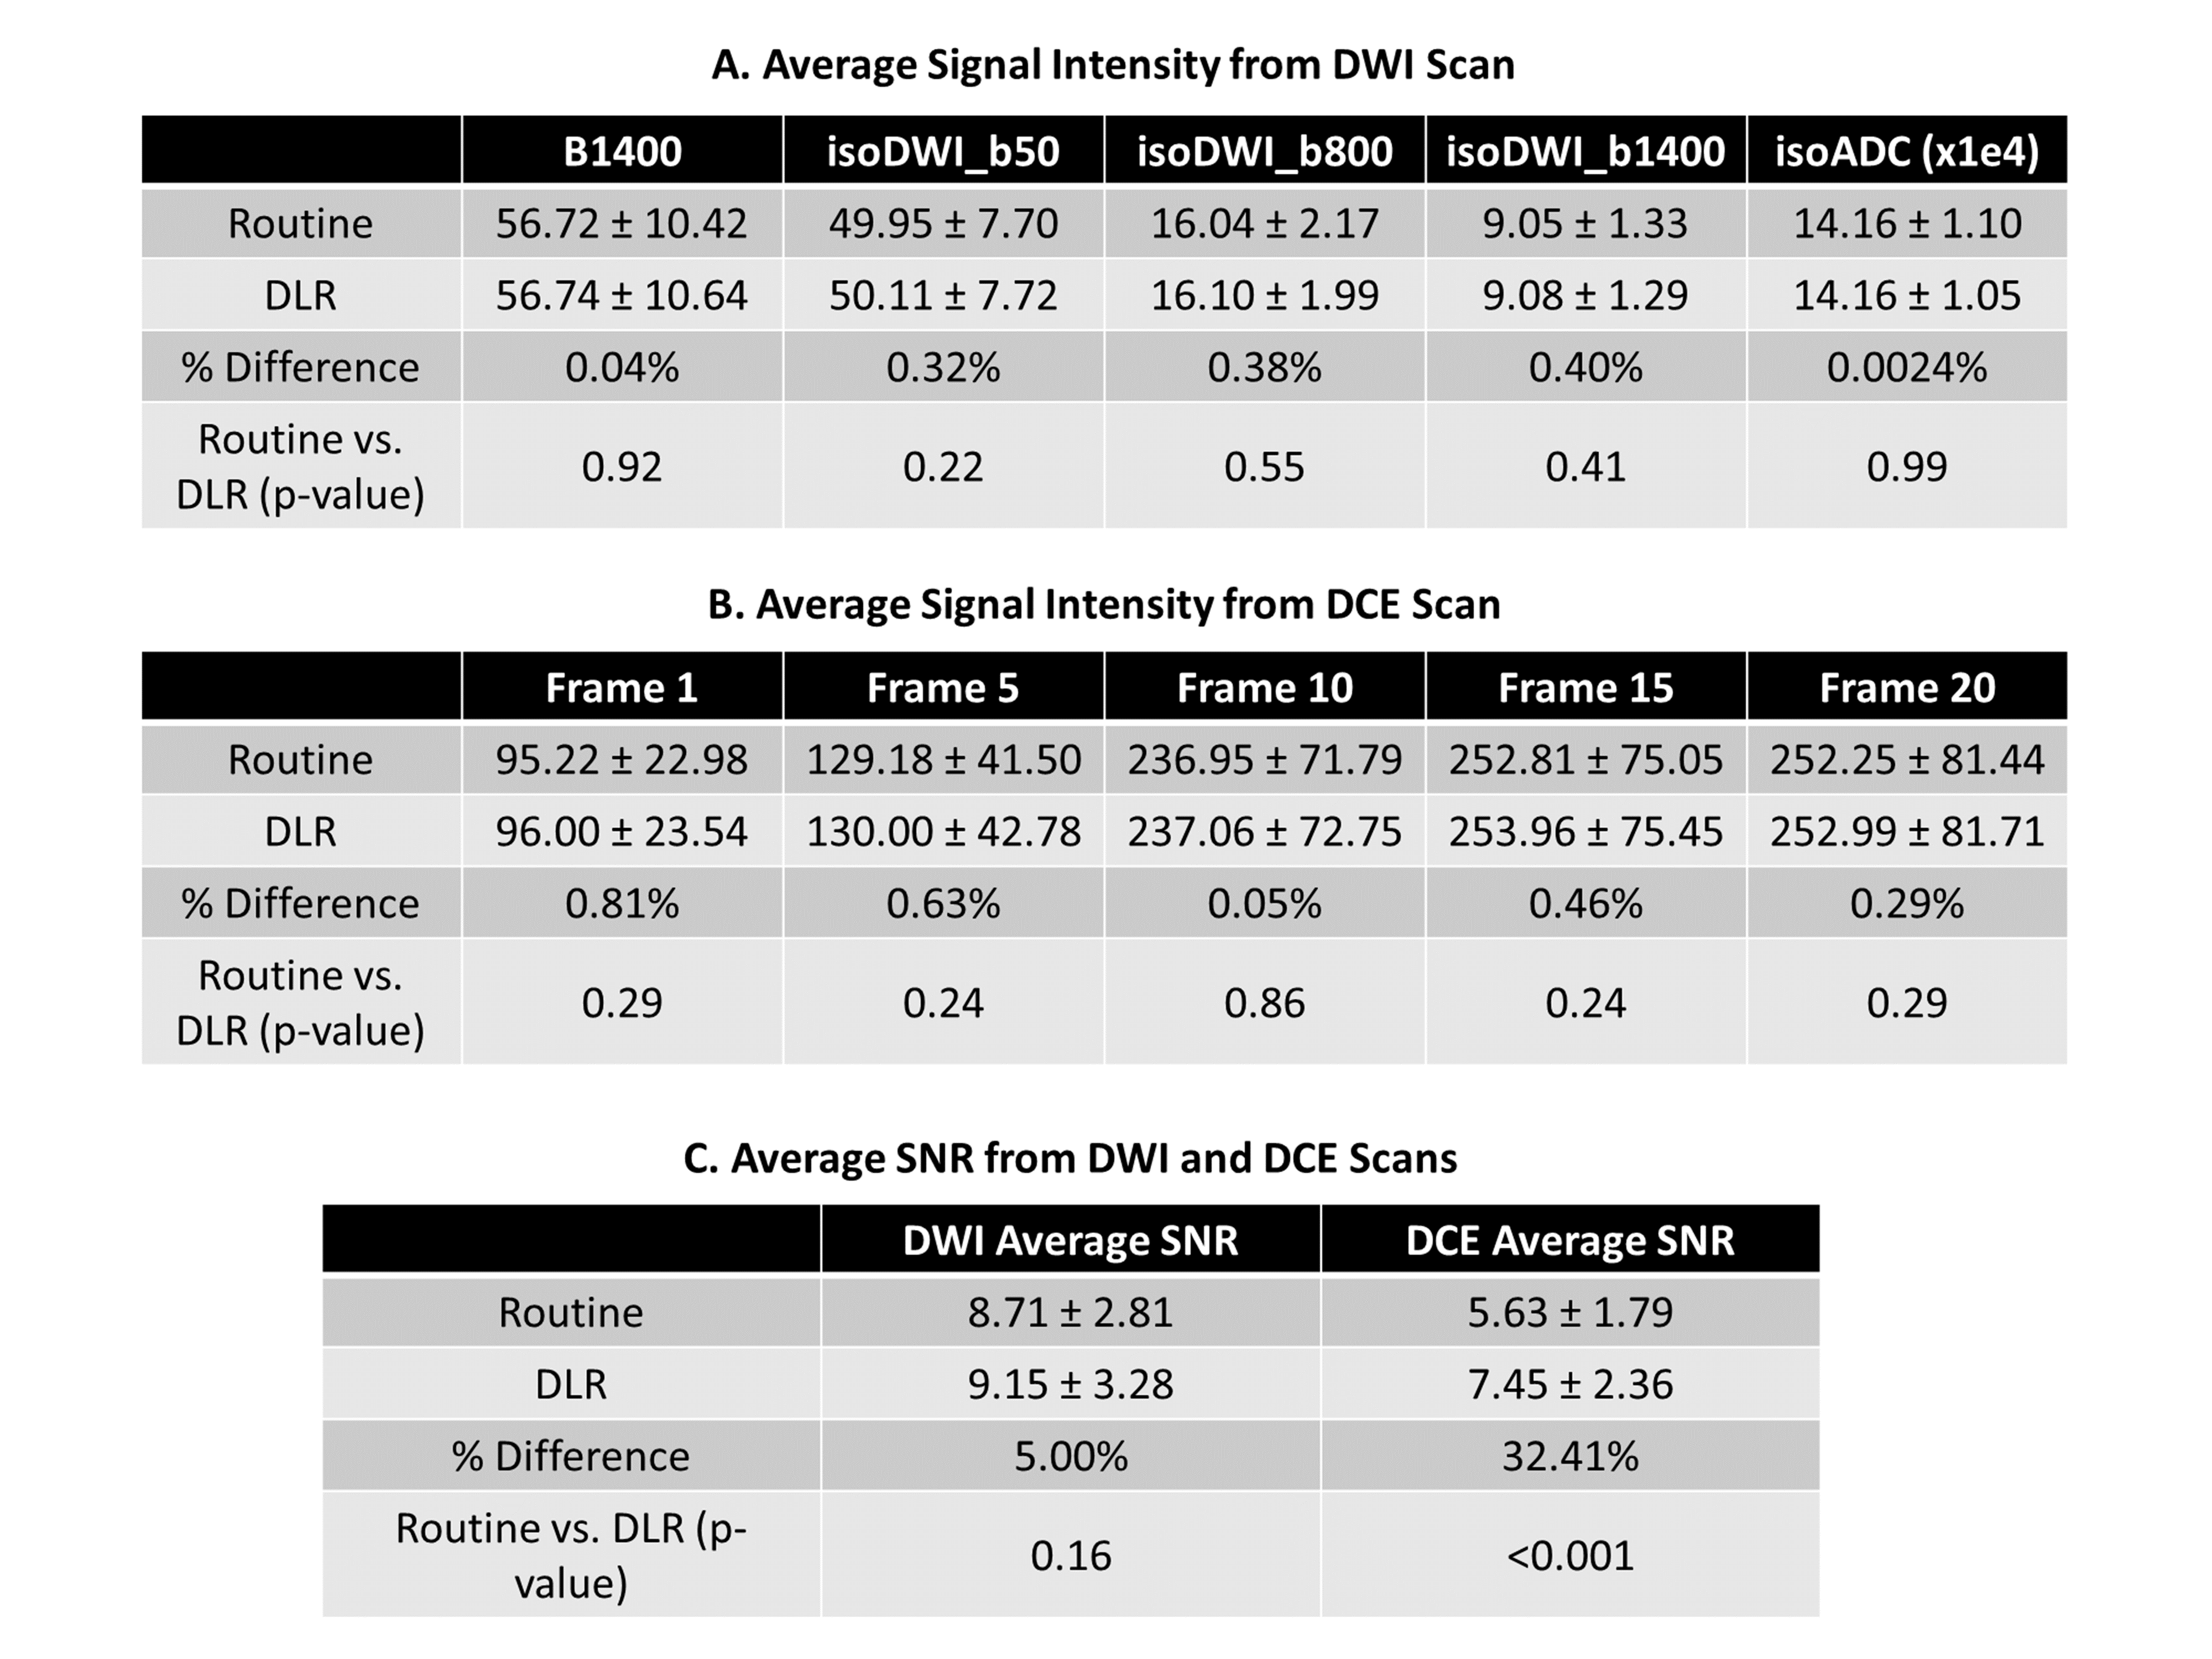
Table 1 shows the mean ± standard deviation of signal intensities (Panel A and B) and SNR (Panel C) from five subjects and 25 ROIs, respectively. There is a less than 1% difference in mean signal intensities measured from routine images compared to the DRL measurements. These results support the hypothesis that DLR improves SNR (see Table 1 Panel C) while maintaining quantitative DWI and DCE measures (see Table 1 Panels A & B).
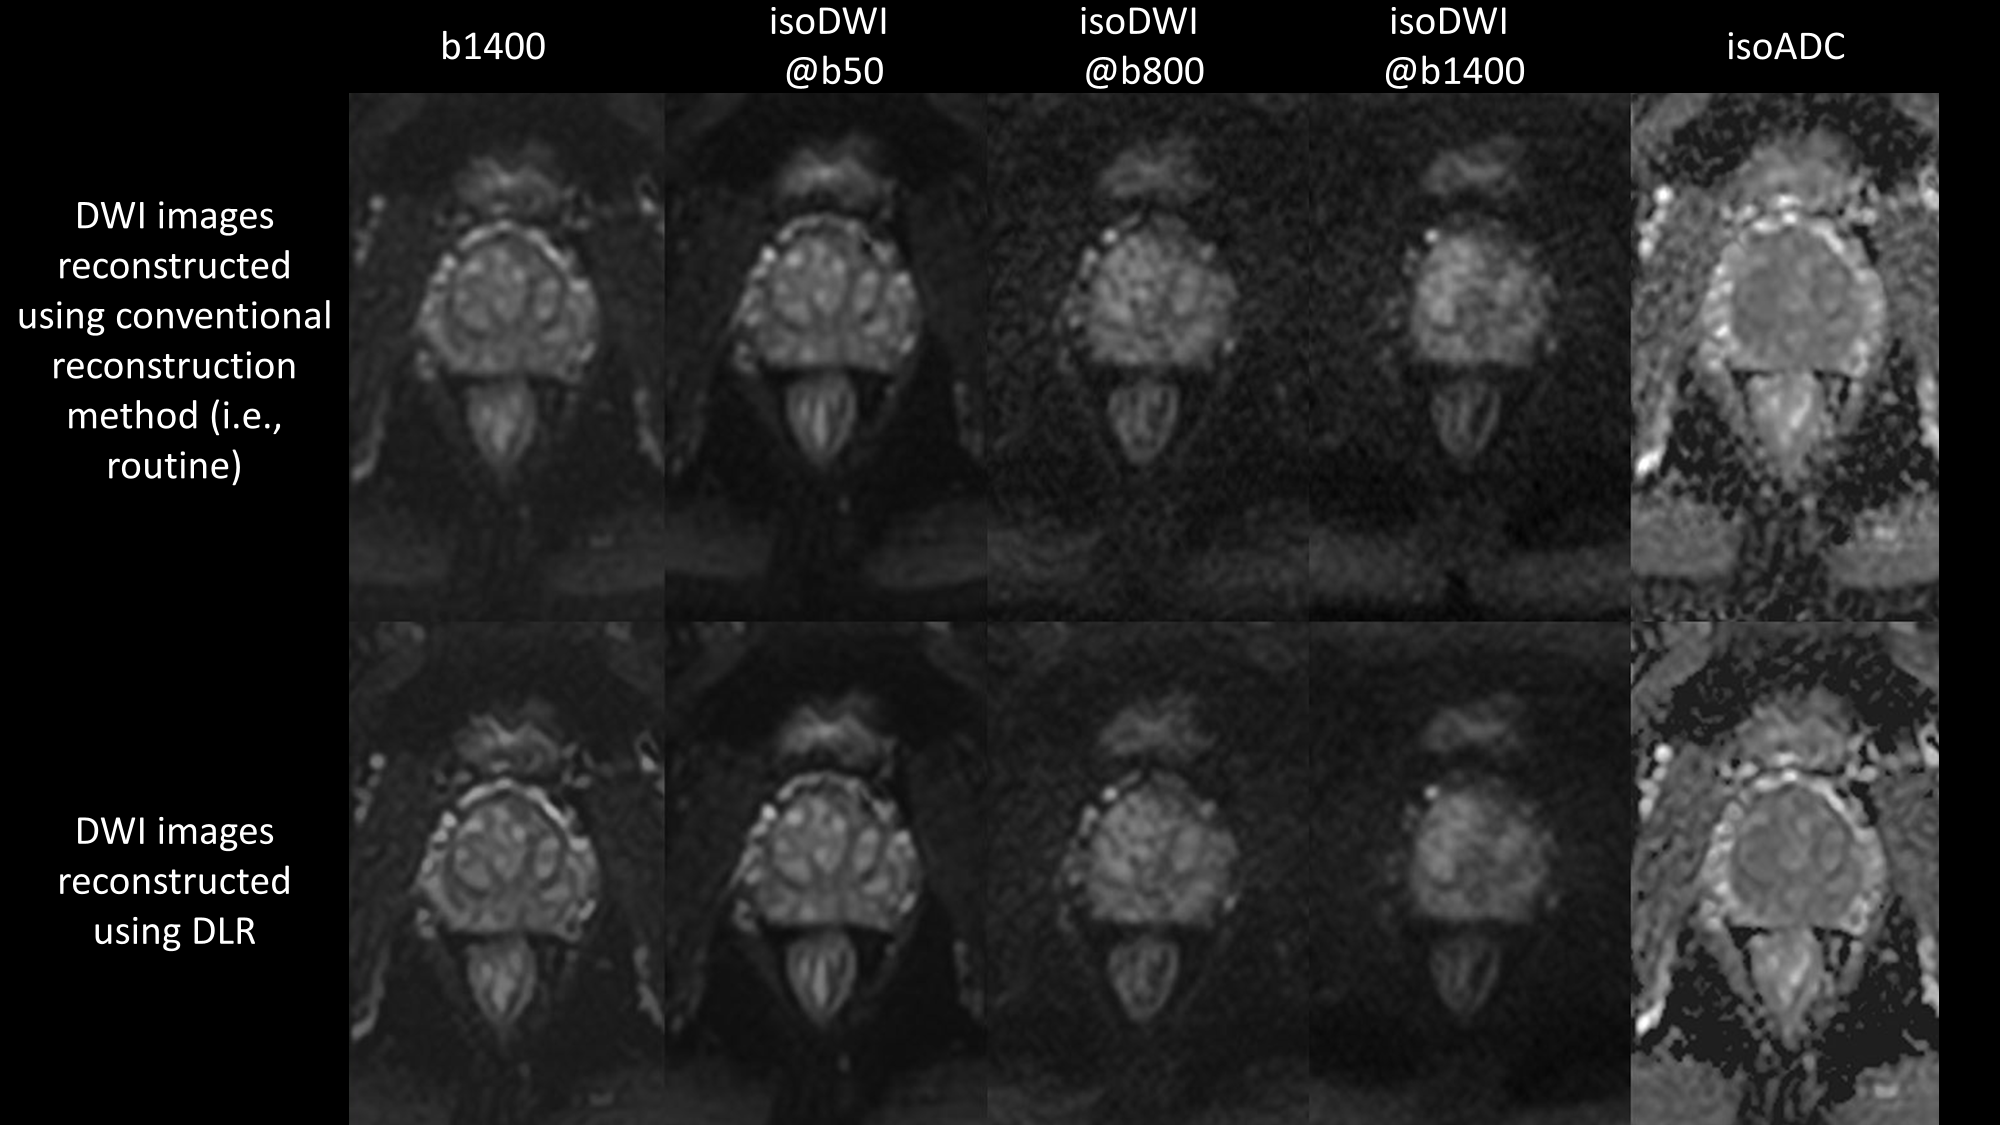
Table 2 shows sequence parameters for DWI and DCE scans. Figure 3 shows representative DWI images reconstructed with the conventional reconstruction (top row) and DLR (bottom row).
Discussion and Conclusion
Rigorous evaluation is essential to ensure the safety and efficacy of DLR for clinical use. The DWI and DCE prostate MRI analysis shows that average signal intensities measured from routine images are similar (less than 1% difference) to those measured from DLR images. These results support the hypothesis that DLR improves SNR (see Table 1, Panel C) while preserving quantitative measurements from DWI and DCE prostate MRI (see Figures 1 & 2, and Table 1 Panels A & B).Acknowledgements
No acknowledgement found.References
[1] Kidoh M, Shinoda K, Kitajima M, Isogawa K, Nambu M, Uetani H, Morita K, Nakaura T, Tateishi M, Yamashita Y, Yamashita Y. Deep learning based noise reduction for brain MR imaging: tests on phantoms and healthy volunteers. Magnetic Resonance in Medical Sciences. 2020;19(3):195.
Figures