5002
Reducing fluctuations in prostate DCE-MRI physiological parameters using muscle as a reference to modulate arterial input function1Radiology, University of Chicago, Chicago, IL, United States, 2Pathology, University of Chicago, Chicago, IL, United States
Synopsis
We introduce a method to modulate arterial input functions (AIFs) using gluteal muscle as reference. The method was tested on a split injection protocol for prostate dynamic contrast enhanced (DCE) MRI: first injecting 30% of the standard dose (30PSD), after two minutes, followed by 70% of the standard dose (70PSD) of gadoterate meglumine. The AIFs were measured from the iliac artery for both doses and used to analyze 70PSD data. By assuming gluteal muscle Ktrans=0.1min-1 and ve=0.1 to modulate AIFs for both doses, the fluctuations of calculated physiological parameters were significantly reduced when compared to using the original AIFs.
INTRODUCTION
PI-RADS_v2.1 recommends using multi-parametric MRI for the diagnosis and staging of prostate cancer (PCa)[1]. Pharmacokinetic models, such as the standard Tofts model[2], are widely used for quantitative analysis of dynamic contrast enhanced (DCE) MRI to extract physiological parameters (Ktrans and ve). However, due to lack of standardization, PI-RADS suggests that DCE-MRI only be analyzed qualitatively. Published literature has demonstrated that there is a large fluctuations of PCa Ktrans values, mainly due to huge variations of arterial input functions (AIFs)[3,4]. It is necessary to standardize physiological parameters for DCE-MRI by minimizing variations of AIFs, so that results can be reasonably compared between different patients and institutions.In this study, we introduced a novel technique to modulate AIFs using the gluteal muscle as reference to reduce variations of measured AIFs. Prostate DCE-MRI was acquired with a split dose injection (30% and 70% of standard dose (30PSD and 70PSD)) of gadoterate meglumine (Dotarem, Guerbet LLC) so that two different AIFs could be obtained. The original AIFs and modulated AIFs were all used to analyze 70PSD DCE data and results of physiological parameters were compared between AIFs.
METHODS
Normally, physiological parameters (Ktrans and ve) are calculated from cancer and normal tissue of contrast agent concentration curve (C(t)) as function of time (t), using Tofts model:$$C(t)=K^{trans}\int_{0}^{t}C_p(τ){\cdot}exp(-(t-τ)K^{trans}⁄v_e)dτ,-----(1)$$
where Cp(t) is AIF. Based on previous studies, it is reasonable to assume that the gluteal muscle of each patient has the same Ktrans=0.1 (min-1) and ve=0.1[5]. Therefore, for gluteal muscle Cm(t), there is a typical AIF (Ĉp(t)) such that:
$$C_m(t)=0.1\int_{0}^{t}C_p(τ)\exp(-(t-τ)0.1/0.1)dτ=0.1\int_{0}^{t}C_p(τ){\cdot}\exp(-(t-τ))dτ.-----(2)$$
Generally, AIF (Cp(t)) obtained from a blood vessel may not satisfy Eq. (2). A simple rational function (fm(t)) was used to modulate Cp(t), so that $$$Ĉ_p(t)=f_m(t)·C_p(t)$$$, where
$$f_m(t)=\frac{η}{1+θ√t}+ε,-----(3)$$
η, θ≥0, and ε are constant and determined by fitting muscle Cm(t), i.e.:
$$C_m(t)=0.1\int_{0}^{t}(\frac{η}{1+θ√t}+ε){\cdot}C_p (τ)\exp(-(t-τ))dτ.-----(4)$$
In this way, modulated AIF (Ĉp(t)) was obtained. To minimize noise effects in the above calculations and to easily compare between AIFs, Cp(t) and Ĉp(t) were fitted by an empirical mathematical model (EMM)[6]:
$$C_p(t)\ {or}\ Ĉ_p(t)=\tan^{-1}(10t)\cdot[1+\sum_{n=1}^2A_n \exp(-(t-τ_n)^2/2σ_n^2)]{\cdot}B\cdot\exp(-βt),-----(5)$$
where An and B are scaling constants, τn and σn (n=1, 2) are the center and width of a Gaussian function, and β is the decay constant. Please note that 30PSD AIF was normalized to the injection dose by multiplying 0.70/0.30, so that it could be used to analyze 70PSD data.
Seventeen patients with biopsy-confirmed PCa were included in this IRB-approved study. MRI data was acquired on a Philips Achieva 3T-TX scanner without an endorectal coil. DCE 3D T1-FFE data was acquired pre- and post- injection of DOTAREM 0.03 mmol/kg (TR/TE=4.153/1.52 ms, FOV=200×200 mm2, matrix size=224×224, flip angle=10°, slice thickness=3 mm, number of slices=24, SENSE factor=1.5, half scan factor=0.675) for 95 dynamic scans with a temporal resolution of 3.01 s/image. After two minutes, the DCE 3D protocol was repeated pre- and post- DOTAREM injection of 0.07 mmol/kg (TR/TE=6.115/1.52 ms) for 150 dynamic scans with a temporal resolution of 4.43 s/image.
Regions-of-interest (ROIs) for PCa (n=30) and normal tissue (n=45) in peripheral zone (PZ), transition zone (TZ), and central zone (CZ) were drawn on T2W images and transferred to DCE images. ROIs for blood vessels on the iliac artery and gluteal muscle were traced on DCE images. Average signal intensity as function of time was calculated for each ROI and used to calculate C(t) and Cp(t) using signal intensity model with literature values of T1(blood)=1.70 s, T1(prostate-tissue)=1.55 s, and T1(muscle)=1.42 s at 3Tesla[7].
One-way ANOVA Test was performed to examine differences for calculated parameters between cancer and normal tissue. The Bland-Altman analysis was performed to evaluate the agreement of physiological parameters obtained between 30PSD and 70PSD modulated AIFs.
RESULTS
Figure 1 shows six examples of AIFs, modulated AIFs and modulation functions obtained for 30PSD and 70PSD data. Figure 2 shows plots of calculated AIFs using average EMM fitting parameters given in the Table. It shows that modulated AIFs were much closer to each other than original AIFs. Figure 3 compares physiological parameter Ktrans obtained between original and modulated AIFs from 30PSD and 70PSD. ANOVA tests shows that PCa Ktrans is significantly (p<0.05) larger than normal tissue in PZ and CZ, but overlapped with normal tissue in TZ. There is no statistical difference for ve between PCa and normal tissue (Fig. 4). Finally, Figure 5 shows scatter plots for all ROIs’ Ktrans and ve obtained between 30PSD and 70PSD modulated AIFs. Bland-Altman analysis showed a good agreement for physiological parameters calculated between modulated AIFs.DISCUSSION
We developed and tested the use of rational function to modulate AIFs with gluteal muscle as reference on two types of AIFs. The fluctuations of physiological parameters obtained with modulated AIFs were much smaller and had better agreement than parameters obtained from original AIFs. Using gluteal muscle Ktrans and ve values, average Ktrans(min-1) calculated from modulated AIFs was approximately 0.70±0.40, 0.35±0.15, 0.60±0.30, and 0.30±0.15 for PCa, and normal tissue in PZ, TZ, and CZ, respectively.CONCLUSION
By using modulated AIF, the fluctuations of physiological parameters for PCa and normal tissue were reduced significantly, and agreed well between different modulated AIFs. This would allow the physiological parameters to be easily compared between different patients and between different institutions.Acknowledgements
This research is supported by National Institutes of Health (R01 CA172801, R01CA218700, 1S10OD018448-01) and Guerbet LLC.
References
[1] Turkbey B, Rosenkrantz AB, Haider MA, Padhani AR, Villeirs G, Macura KJ, Tempany CM, Choyke PL, Cornud F, Margolis DJ, Thoeny HC, Verma S, Barentsz J, Weinreb JC. Prostate Imaging Reporting and Data System Version 2.1: 2019 Update of Prostate Imaging Reporting and Data System Version 2. Eur Urol. 2019; 76(3):340-351.
[2] Tofts PS, Brix G, Buckley DL, Evelhoch JL, Henderson E, Knopp MV, Larsson HB, Lee TY, Mayr NA, Parker GJ, Port RE, Taylor J, Weisskoff RM. Estimating kinetic parameters from dynamic contrast-enhanced T(1)-weighted MRI of a diffusable tracer: standardized quantities and symbols. J Magn Reson Imaging. 1999; 10(3):223-32.
[3] Ziayee F, Müller-Lutz A, Gross J, Quentin M, Ullrich T, Heusch P, Arsov C, Rabenalt R, Albers P, Antoch G, Wittsack HJ, Schimmöller L. Influence of arterial input function (AIF) on quantitative prostate dynamic contrast-enhanced (DCE) MRI and zonal prostate anatomy. Magn Reson Imaging. 2018; 53:28-33.
[4] Klawer EME, van Houdt PJ, Simonis FFJ, van den Berg CAT, Pos FJ, Heijmink SWTPJ, Isebaert S, Haustermans K, van der Heide UA. Improved repeatability of dynamic contrast-enhanced MRI using the complex MRI signal to derive arterial input functions: a test-retest study in prostate cancer patients. Magn Reson Med. 2019; 81(5):3358-3369.
[5] Padhani AR, Hayes C, Landau S, Leach MO. Reproducibility of quantitative dynamic MRI of normal human tissues. NMR Biomed. 2002 Apr;15(2):143-53. doi: 10.1002/nbm.732.
[6] Wang S, Lu Z, Fan X, Medved M, Jiang X, Sammet S, Yousuf A, Pineda F, Oto A, Karczmar GS. Comparison of arterial input functions measured from ultra-fast dynamic contrast enhanced MRI and dynamic contrast enhanced computed tomography in prostate cancer patients. Phys Med Biol. 2018; 63(3):03NT01.
[7] de Bazelaire CM, Duhamel GD, Rofsky NM, Alsop DC. MR imaging relaxation times of abdominal and pelvic tissues measured in vivo at 3.0 T: preliminary results. Radiology. 2004; 230(3):652-9.
Figures

Figure 1. Plots of typical six examples of EMM fitted original AIFs (black lines) from 30PSD (top row) and 70PSD (bottom row), and corresponding modulated AIFs (red lines) obtained by multiplying modulation functions (green lines). Please note that 30PSD AIFs has been normalized by injection dose (0.7/0.3), and top and bottom rows all display different cases. Only one Gaussian function was used for 70PSD AIF since there was no clear second pass.

Figure 2. Plots of AIFs calculated from average EMM fitting parameters (given in Table) obtained from 17 patients for (a) 30PSD data and (b) 70PSD data. The original 30PSD AIF (black line) has significantly higher peak height than modulated AIF (red line); and original 70PSD AIF (black line) has much lower peak height than modulated AIF (red line). Please note that EMM fits were performed on both original and modulated AIFs. Table underneath of figure shows average ± standard deviation of EMM parameters obtained from Eq. 5. Only one Gaussian function was used for 70PSD AIF.

Figure 3. Box-plots of physiological parameters Ktrans obtained from 70PSD data for PCa (black) and normal tissue in PZ (red), TZ (green) and CZ (blue) by using (a) original 30PSD AIF, (b) original 70PSD AIF, (c) modulated 30PSD AIF, and (d) modulated 70PSD AIF. The square (□) indicates mean and the asterisks (*) indicate the upper and lower limits of the data.
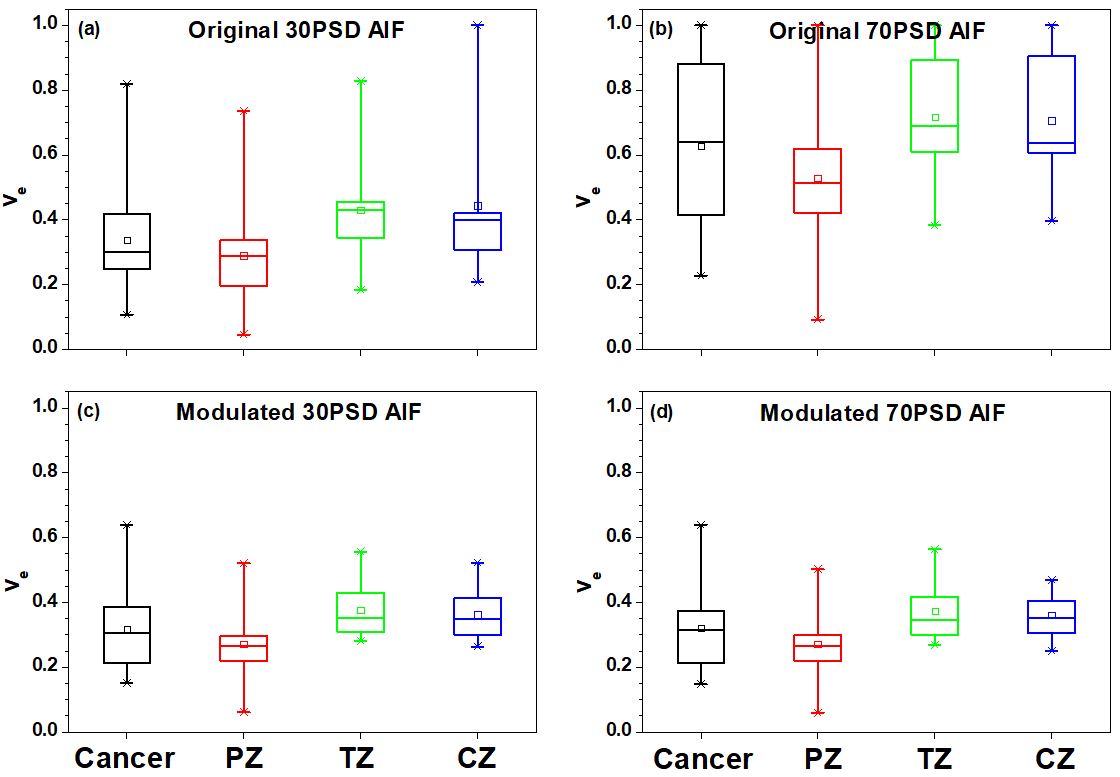
Figure 4. Box-plots of physiological parameters ve obtained from 70PSD data for PCa (black) and normal tissue in PZ (red), TZ (green) and CZ (blue) by using (a) original 30PSD AIF, (b) original 70PSD AIF, (c) modulated 30PSD AIF, and (d) modulated 70PSD AIF. The square (□) indicates mean and the asterisks (*) indicate the upper and lower limits of the data.
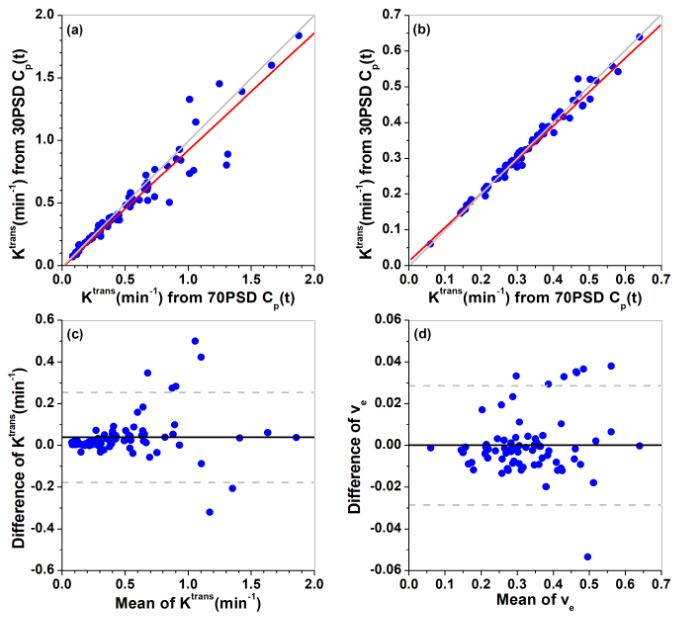
Figure 5. Scatter plots of (a) Ktrans and (b) ve for all PCa and normal tissue ROIs (n = 75) extracted from between modulated 30PSD and 70PSD AIFs. The red lines represent the linear correlations and gray lines represent identity. The corresponding Bland–Altman plots are shown in (c) and (d). The solid line represents the mean difference (30PSD AIF - 70PSD AIF) and the dash gray lines represent the lower and upper limits of agreement, defined by a range of ±1.96×SD (standard deviation) (95% confidence interval) around the mean difference.