5001
High Resolution 3D Ultra-Short Echo Time MRI with Rosette k-Space Pattern for Brain Iron Content Mapping1Weldon School of Biomedical Engineering, Purdue University, West Lafayette, IN, United States, 2Department of Radiology, Medical Physics, University of Freiburg, Freiburg, Germany, 3Health Science Department, Purdue University, West Lafayette, IN, United States, 4Elmore Family School of Electrical and Computer Engineering, Purdue University, West Lafayette, IN, United States, 5Wellcome Centre for Integrative Neuroimaging, University of Oxford, Oxford, United Kingdom
Synopsis
This study aimed to detect brain iron content with a novel high resolution (0.94 mm isotropic voxel) ultra-short echo time (UTE) MRI based on rosette k-space trajectory. Non-invasive monitoring of brain iron content is beneficial, because the iron concentration increases during normal brain development, but is associated with many neurodegenerative diseases. With the ultra-short echo time (TE=20μs), the fast signal decay caused by high iron concentration can be captured. The relationship between iron concentration and signal intensity was quantified based on phantom study, and was used for modulation of the in vivo data to produce images of iron-rich brain regions.
Introduction
Iron is a fundamental element in many normal brain physiological processes, involving neurotransmitter synthesis and metabolism, mitochondrial respiration, and myelin synthesis as components of certain enzymes 1. While iron homoeostasis needs to be maintained, abnormal iron accumulation has been associated with many neurodegenerative diseases, including Parkinson’s2 and Alzheimer’s diseases3. In addition, age-related brain iron accumulation in healthy subjects has been reported within deep brain structures such as the substantia nigra4, putamen5, and globus pallidus6. Since the iron concentration increases during normal brain development and is identified as a risk factor for many neurodegenerative diseases, it is vital to monitor iron concentration in the brain non-invasively.As a non-invasive imaging modality, magnetic resonance imaging (MRI) has been widely used in measuring in vivo brain iron content. Because of the paramagnetic nature of the elemental iron, its presence increases the local magnetic field and accelerates precession, causing phase to accumulate over the echo times (TE) and resulting in a shorter transverse relaxation time (T2*). Previous in vivo attempts to monitor iron in human brain using conventional gradient echo (GRE) techniques are T2*=1/R2* fitting, susceptibility weighted imaging (SWI)5 and quantitative susceptibility mapping (QSM)7, have resulted in inconsistent findings8,9. This could be due to the relatively long TE (on the order of milliseconds (ms) or longer), resulting in degraded sensitivity to quantify high iron concentration (> 25 mg/g)10,11.
Alternatively, ultra-short echo time (UTE) and zero echo time (ZTE) with sweep imaging with Fourier transformation (SWIFT) sequences are capable of acquiring data with TEs in the order of microseconds (μs), which shows the ability to capture fast signal decay caused by high iron concentration12. This study aims to measure brain iron concentration in healthy subjects using a high-resolution (0.94 mm isotropic voxel) UTE (20μs) sequence with a novel 3D rosette k-space trajectory.
Methods
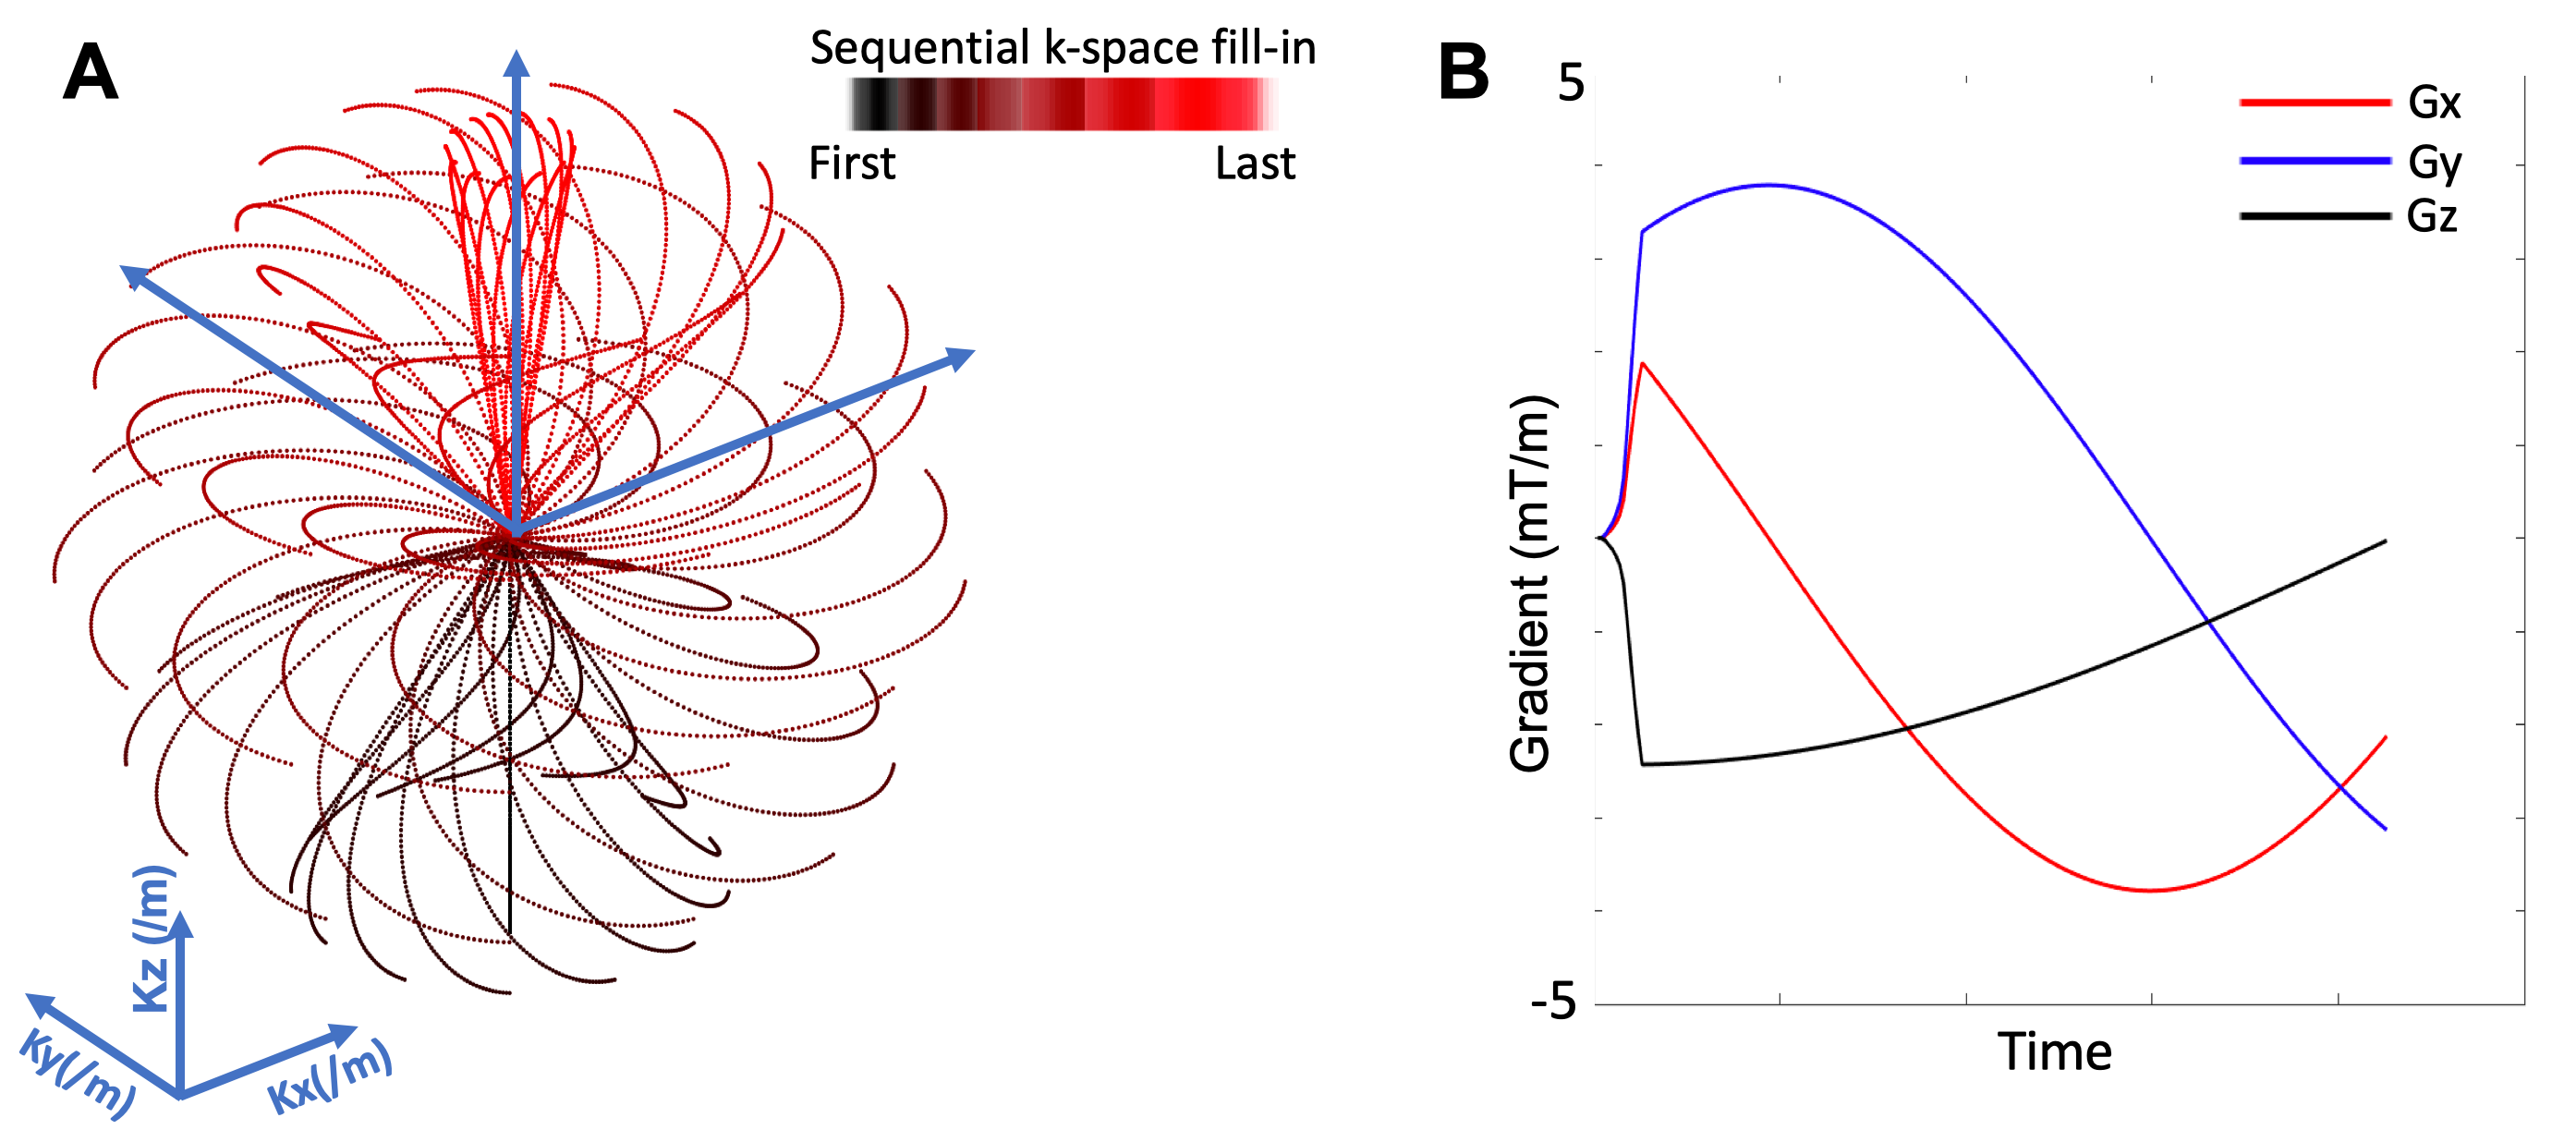
The rosette k-space pattern is shown in Figure 1, and described in the following equations13:Kxy(t)=Kx(t)+i*Ky(t)=(Kmax*cos(φ))*sin(ω1*t)*eiω2t+β
Kz(t)=(Kmax*sin(φ))*sin(ω1*t)
where Kmax is the maximum extent of k-space, ω1 is the frequency of oscillation in the radial direction, ω2 is the frequency of rotation in the angular direction, φ determines the location in the z-axis, and β determines the initial phase in the angular direction.
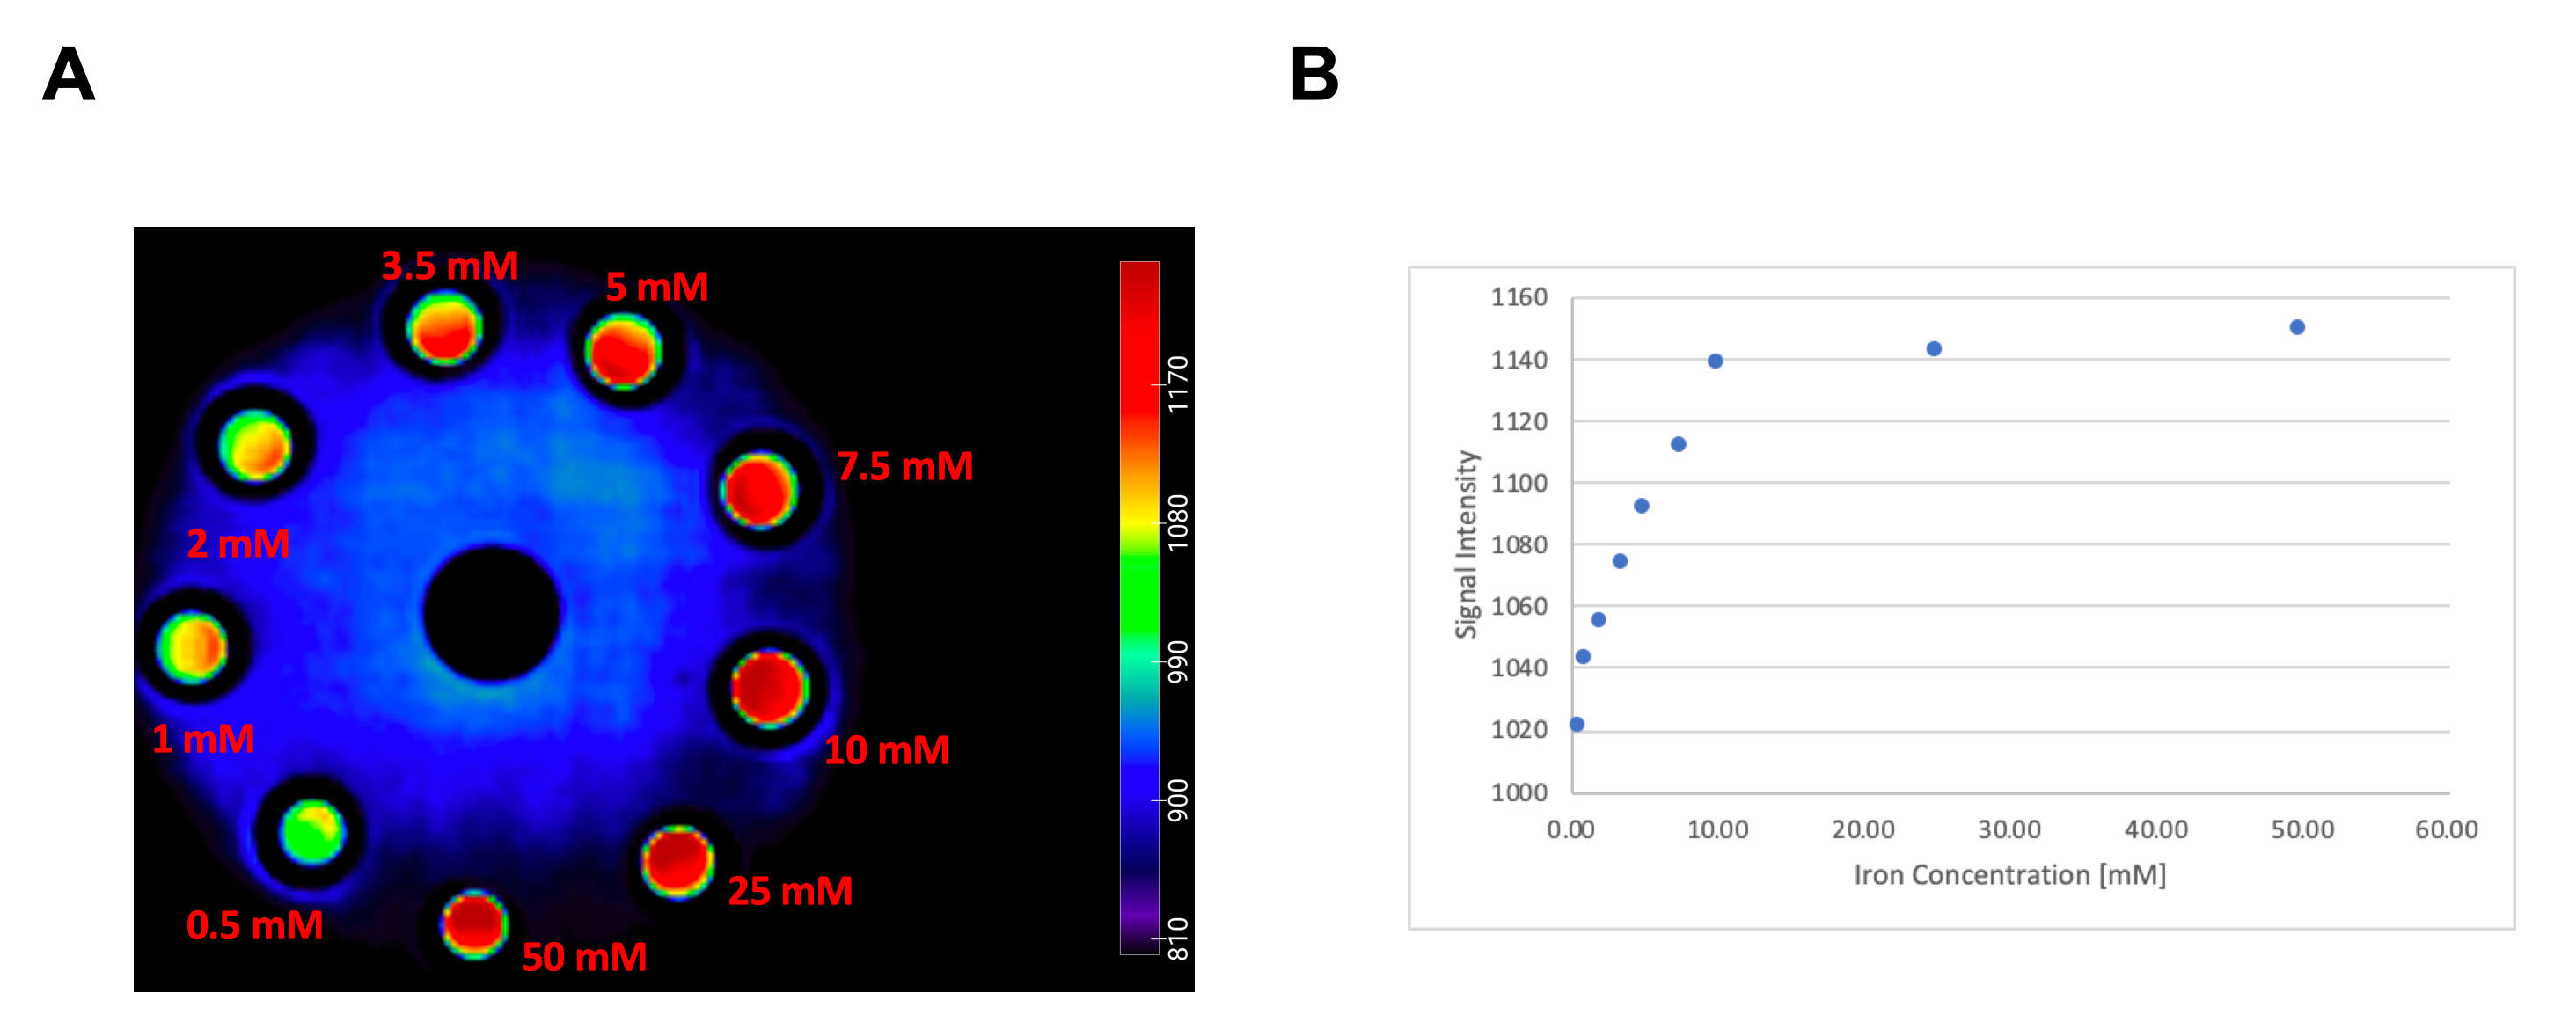
The study was performed with a whole-body 3T MRI scanner (Siemens Healthineers, Erlangen, Germany). A cylindrical phantom containing eight vials of different iron concentrations (iron (II) chloride) from 0.5 millimoles (mM) to 50 mM were scanned with TE=20 μs with the rosette UTE acquisition13. The vials were fixed in an agarose gel phantom (1% agarose by weight). In addition, seven healthy volunteers were recruited for high-resolution rosette UTE scans at TE=20 μs. The parameters for the UTE acquisition were: Kmax=500/m, ω1=ω2=0.766 kHz, number of total petals= 71442 (x2 undersampling pattern for acceleration), samples per petal=425 (only the first half samples were used for reconstruction), φ was sampled uniformly in the range of [-π/2, π/2], and β was sampled uniformly in the range of [0,2π], the field of view (FOV)=240x240x240 mm3, matrix size=256x256x256, readout dwell time=10 μs, flip angle=7-degree, TR=7 ms, readout duration=2.1 ms per echo. The total scan time was 8.7 minutes.
Image reconstruction and post-processing steps were performed in MATLAB (MathWorks, USA) platform. The non-uniform fast Fourier transform (NUFFT)14 and a sparsity constraint on total image variation15 were used for image reconstruction. After image reconstruction, all images were registered to a standard brain atlas (MNI-152) with 3dunifize (AFNI)16 for bias-field correction. The relationship between iron concentration and signal intensity was fitted and applied to modulate the reconstructed in vivo images.
Results
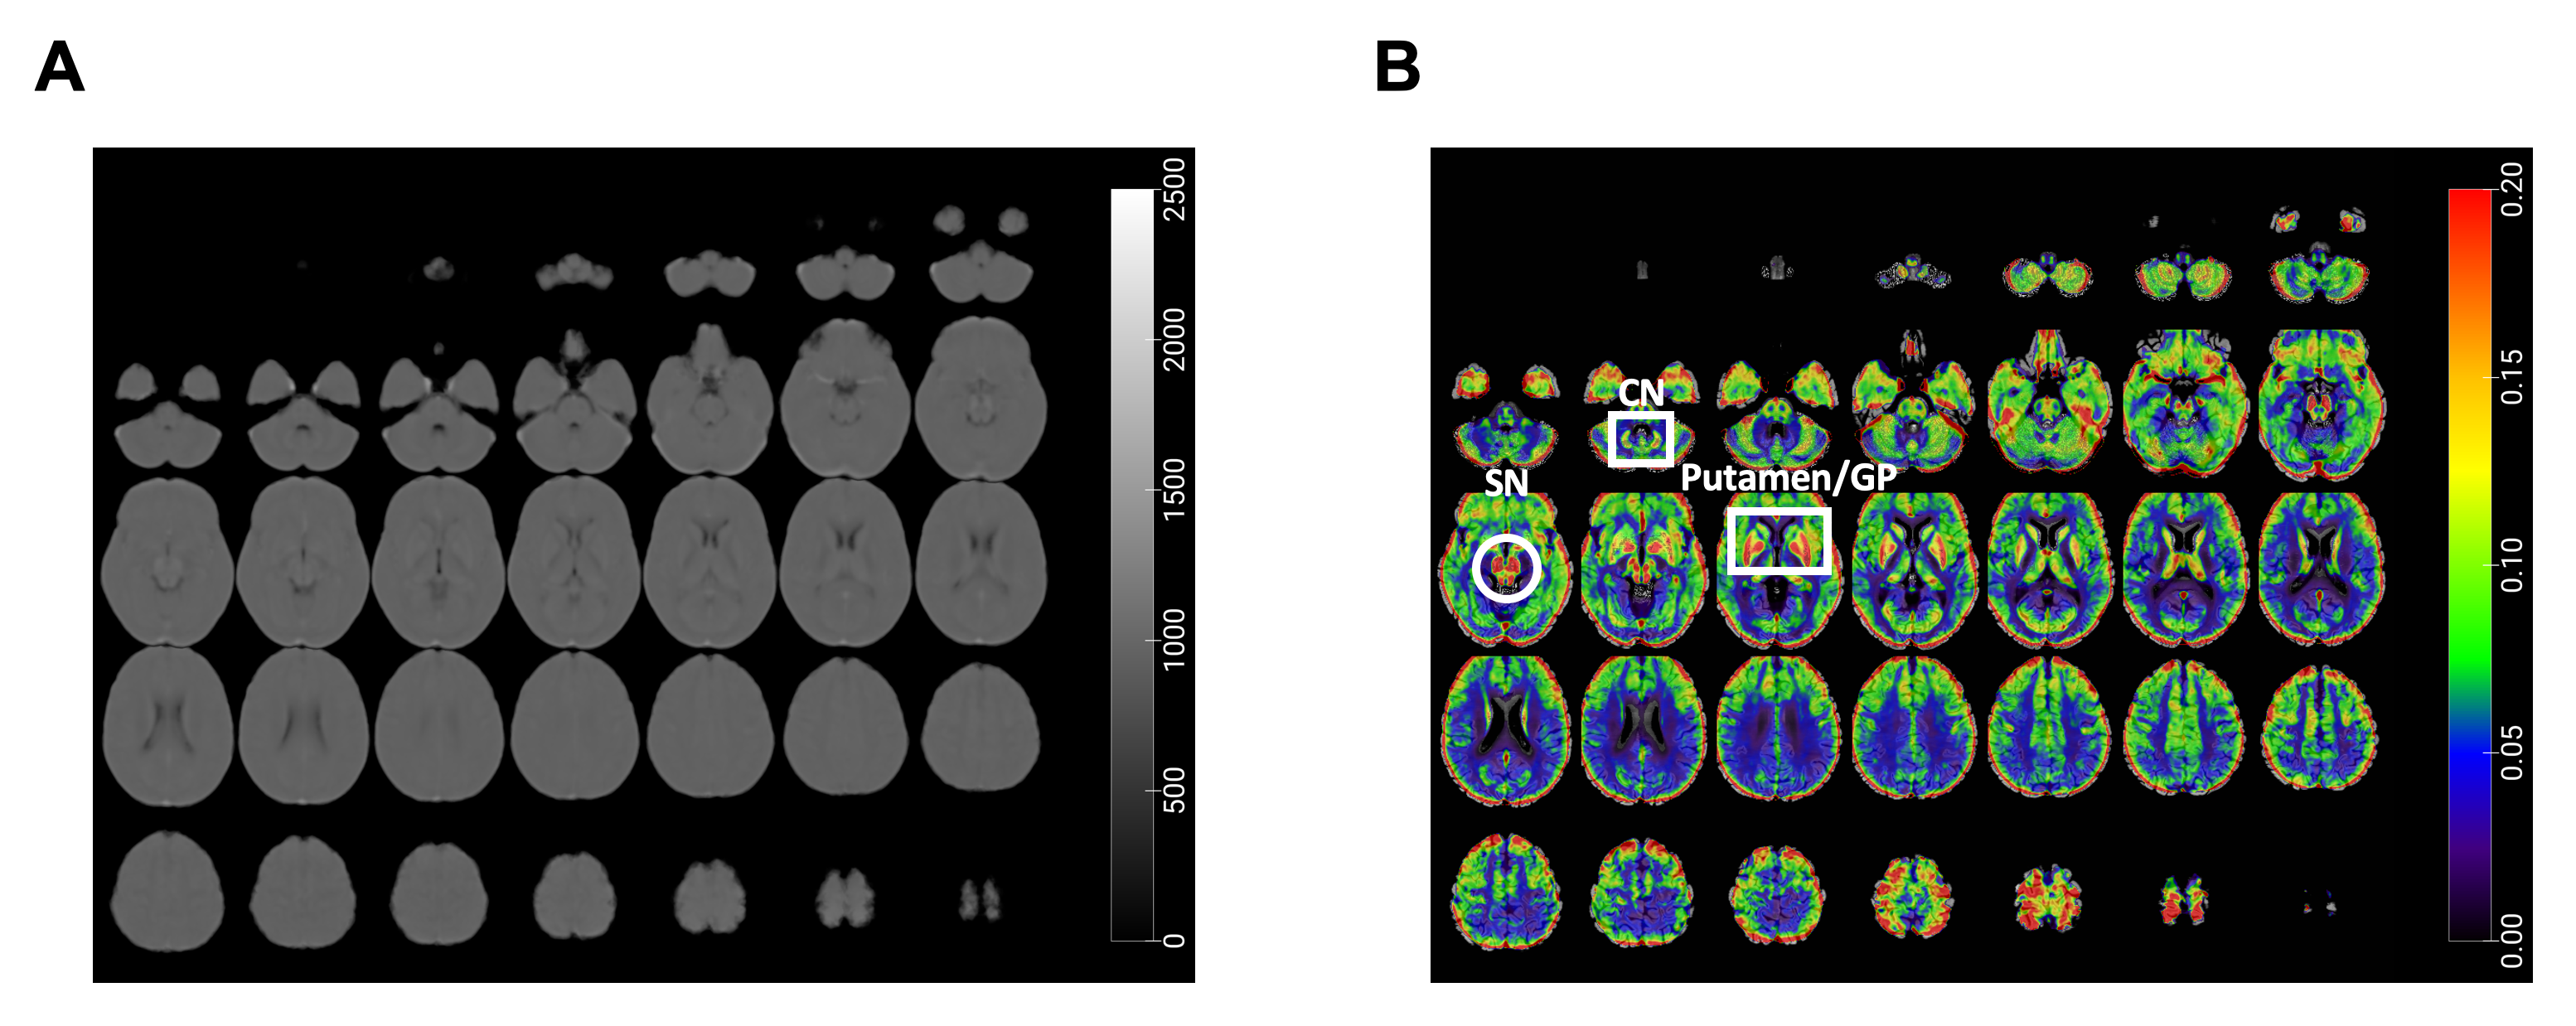
The reconstructed image of the phantom inserted of vials with different iron concentrations is shown in Figure 2A. The relationship between iron concentration and signal intensity is illustrated in Figure 2B. The signal intensity increases with higher iron concentration.The averaged reconstructed images after registration into the MNI-152 atlas are shown in Figure 3A. There was little or no contrast between WM and GM, because of the ultra-short TE (TE=20 μs). After modulating according to the relationship between iron concentration and signal intensity achieved from phantom scan (Figure 2), the GM and other brain regions, such as substantia nigra, putamen, and globus pallidus, were highlighted (Figure 3B).
Discussion
Overall, the results based on the phantom study aligned with previous publications using SWIFT ZTE MRI9. In 3D-UTE images acquired with 7-degree flip angle, the signal-to-noise ratio (SNR) increased up until 10 mM and then remained well above background signal intensity up to 50 mM. In addition, 3D-UTE was able to generate a strong positive contrast for iron accumulated brain tissues using the relationship identified by the phantom experiment.Conclusion
This study achieved high resolution (0.94x0.94x0.94 mm3) brain images with ultra-short TE (TE=20 μs). Furthermore, the modulation of the in vivo data based on relationship between iron concentration and signal intensity was exploited to produce images of iron-rich brain regions with a high spatial resolution in a clinically feasible acquisition duration. Thus, this method might be useful to measure the iron content in the human brain non-invasively.Acknowledgements
Data acquisition was supported in part by NIH grant S10 OD012336- 3T MRI Scanner dedicated to Life Sciences Research.References
1. Ward RJ, Zucca FA, Duyn JH, Crichton RR, Zecca L. The role of iron in brain ageing and neurodegenerative disorders. Lancet Neurol 2014;13(10):1045-1060.
2. Berg D, Youdim MB. Role of iron in neurodegenerative disorders. Top Magn Reson Imaging 2006;17(1):5-17.
3. House MJ, St Pierre TG, Foster JK, Martins RN, Clarnette R. Quantitative MR imaging R2 relaxometry in elderly participants reporting memory loss. AJNR Am J Neuroradiol 2006;27(2):430-439.
4. Snyder AM, Connor JR. Iron, the substantia nigra and related neurological disorders. Biochim Biophys Acta 2009;1790(7):606-614.
5. Daugherty AM, Raz N. Accumulation of iron in the putamen predicts its shrinkage in healthy older adults: A multi-occasion longitudinal study. Neuroimage 2016;128:11-20.
6. Aquino D, Bizzi A, Grisoli M, Garavaglia B, Bruzzone MG, Nardocci N, Savoiardo M, Chiapparini L. Age-related iron deposition in the basal ganglia: quantitative analysis in healthy subjects. Radiology 2009;252(1):165-172.
7. Langkammer C, Schweser F, Krebs N, Deistung A, Goessler W, Scheurer E, Sommer K, Reishofer G, Yen K, Fazekas F, Ropele S, Reichenbach JR. Quantitative susceptibility mapping (QSM) as a means to measure brain iron? A post mortem validation study. Neuroimage 2012;62(3):1593-1599.
8. Hong W, He Q, Fan S, Carl M, Shao H, Chen J, Chang EY, Du J. Imaging and quantification of iron-oxide nanoparticles (IONP) using MP-RAGE and UTE based sequences. Magn Reson Med 2017;78(1):226-232.
9. Zhang J, Chamberlain R, Etheridge M, Idiyatullin D, Corum C, Bischof J, Garwood M. Quantifying iron-oxide nanoparticles at high concentration based on longitudinal relaxation using a three-dimensional SWIFT Look-Locker sequence. Magn Reson Med 2014;71(6):1982-1988.
10. Doyle EK, Toy K, Valdez B, Chia JM, Coates T, Wood JC. Ultra-short echo time images quantify high liver iron. Magn Reson Med 2018;79(3):1579-1585.
11. Krafft AJ, Loeffler RB, Song R, Tipirneni-Sajja A, McCarville MB, Robson MD, Hankins JS, Hillenbrand CM. Quantitative ultrashort echo time imaging for assessment of massive iron overload at 1.5 and 3 Tesla. Magn Reson Med 2017;78(5):1839-1851.
12. Magnitsky S, Zhang J, Idiyatullin D, Mohan G, Garwood M, Lane NE, Majumdar S. Positive contrast from cells labeled with iron oxide nanoparticles: Quantitation of imaging data. Magn Reson Med 2017;78(5):1900-1910.
13. Zahneisen B, Grotz T, Lee KJ, Ohlendorf S, Reisert M, Zaitsev M, Hennig J. Three-dimensional MR-encephalography: fast volumetric brain imaging using rosette trajectories. Magn Reson Med 2011;65(5):1260-1268.
14. Fessler JA, Sutton BP. Nonuniform fast Fourier transforms using min-max interpolation. Ieee T Signal Proces 2003;51(2):560-574.
15. Knoll F, Bredies K, Pock T, Stollberger R. Second order total generalized variation (TGV) for MRI. Magn Reson Med 2011;65(2):480-491.
16. Cox RW. AFNI: software for analysis and visualization of functional magnetic resonance neuroimages. Comput Biomed Res 1996;29(3):162-173.
Figures