5000
3D Tissue Oxygenation Level Dependence MRI on head and neck cancers by using 3D Stack of Star acquisition and Variable Flip Angle T1 method1UCAIR, Department of Radiology and Imaging Sciences, University of Utah, Salt Lake City, UT, United States, 2Department of Biomedical Engineering, Johns Hopkins University, Baltimore, MD, United States, 3Department of Radiation Oncology, University of Utah, Salt Lake City, UT, United States
Synopsis
Hypoxia is a common feature of most solid tumors, reflecting an imbalance of oxygen delivery and consumption. Tumor hypoxia is an indicator of a treatment resistance and overall poor prognosis in head and neck cancer. Change in tissue oxygen concentration level (TOLD) induced by breathing pure oxygen produces proportional change in tissue T1 relaxivity. The proposed technique, a motion insensitive 3D TOLD MRI using 3D VFA T1 Stack of Star sampling, has obvious advantages over conventional 3D VFA technique for reliable and accurate T1 measurements and a great potential for the assessment of tumor hypoxia in HNC patients.
PURPOSE
Hypoxia is a common feature of most solid tumors, reflecting an imbalance of oxygen delivery and consumption(1). Tumor hypoxia is an indicator of a treatment resistance and overall poor prognosis in head and neck cancers (HNC)(2). Early preclinical and clinical studies have used MRI in an attempt to monitor tumor hypoxia and oxygenation status(3, 4). Change in tissue oxygen concentration level (TOLD) induced by breathing pure oxygen produces proportional change in tissue T1 relaxivity. A well-oxygenated area shows a decreased T1 value, but T1 of a non-oxygenated area remains unchanged. Variable flip angle (VFA) technique is widely used to acquire 3D T1 maps in a clinically feasible time(5). VFA T1 mapping in HNC patients is challenging due to severe artifacts induced by fluid pulsation, susceptibility artifacts from adjacent air and bone, and motion related to respiration and swallowing. In this work, we propose a motion insensitive 3D TOLD MRI using 3D VFA Stack of Star (SOS) technique in the phantom and clinical studies(6).METHODS
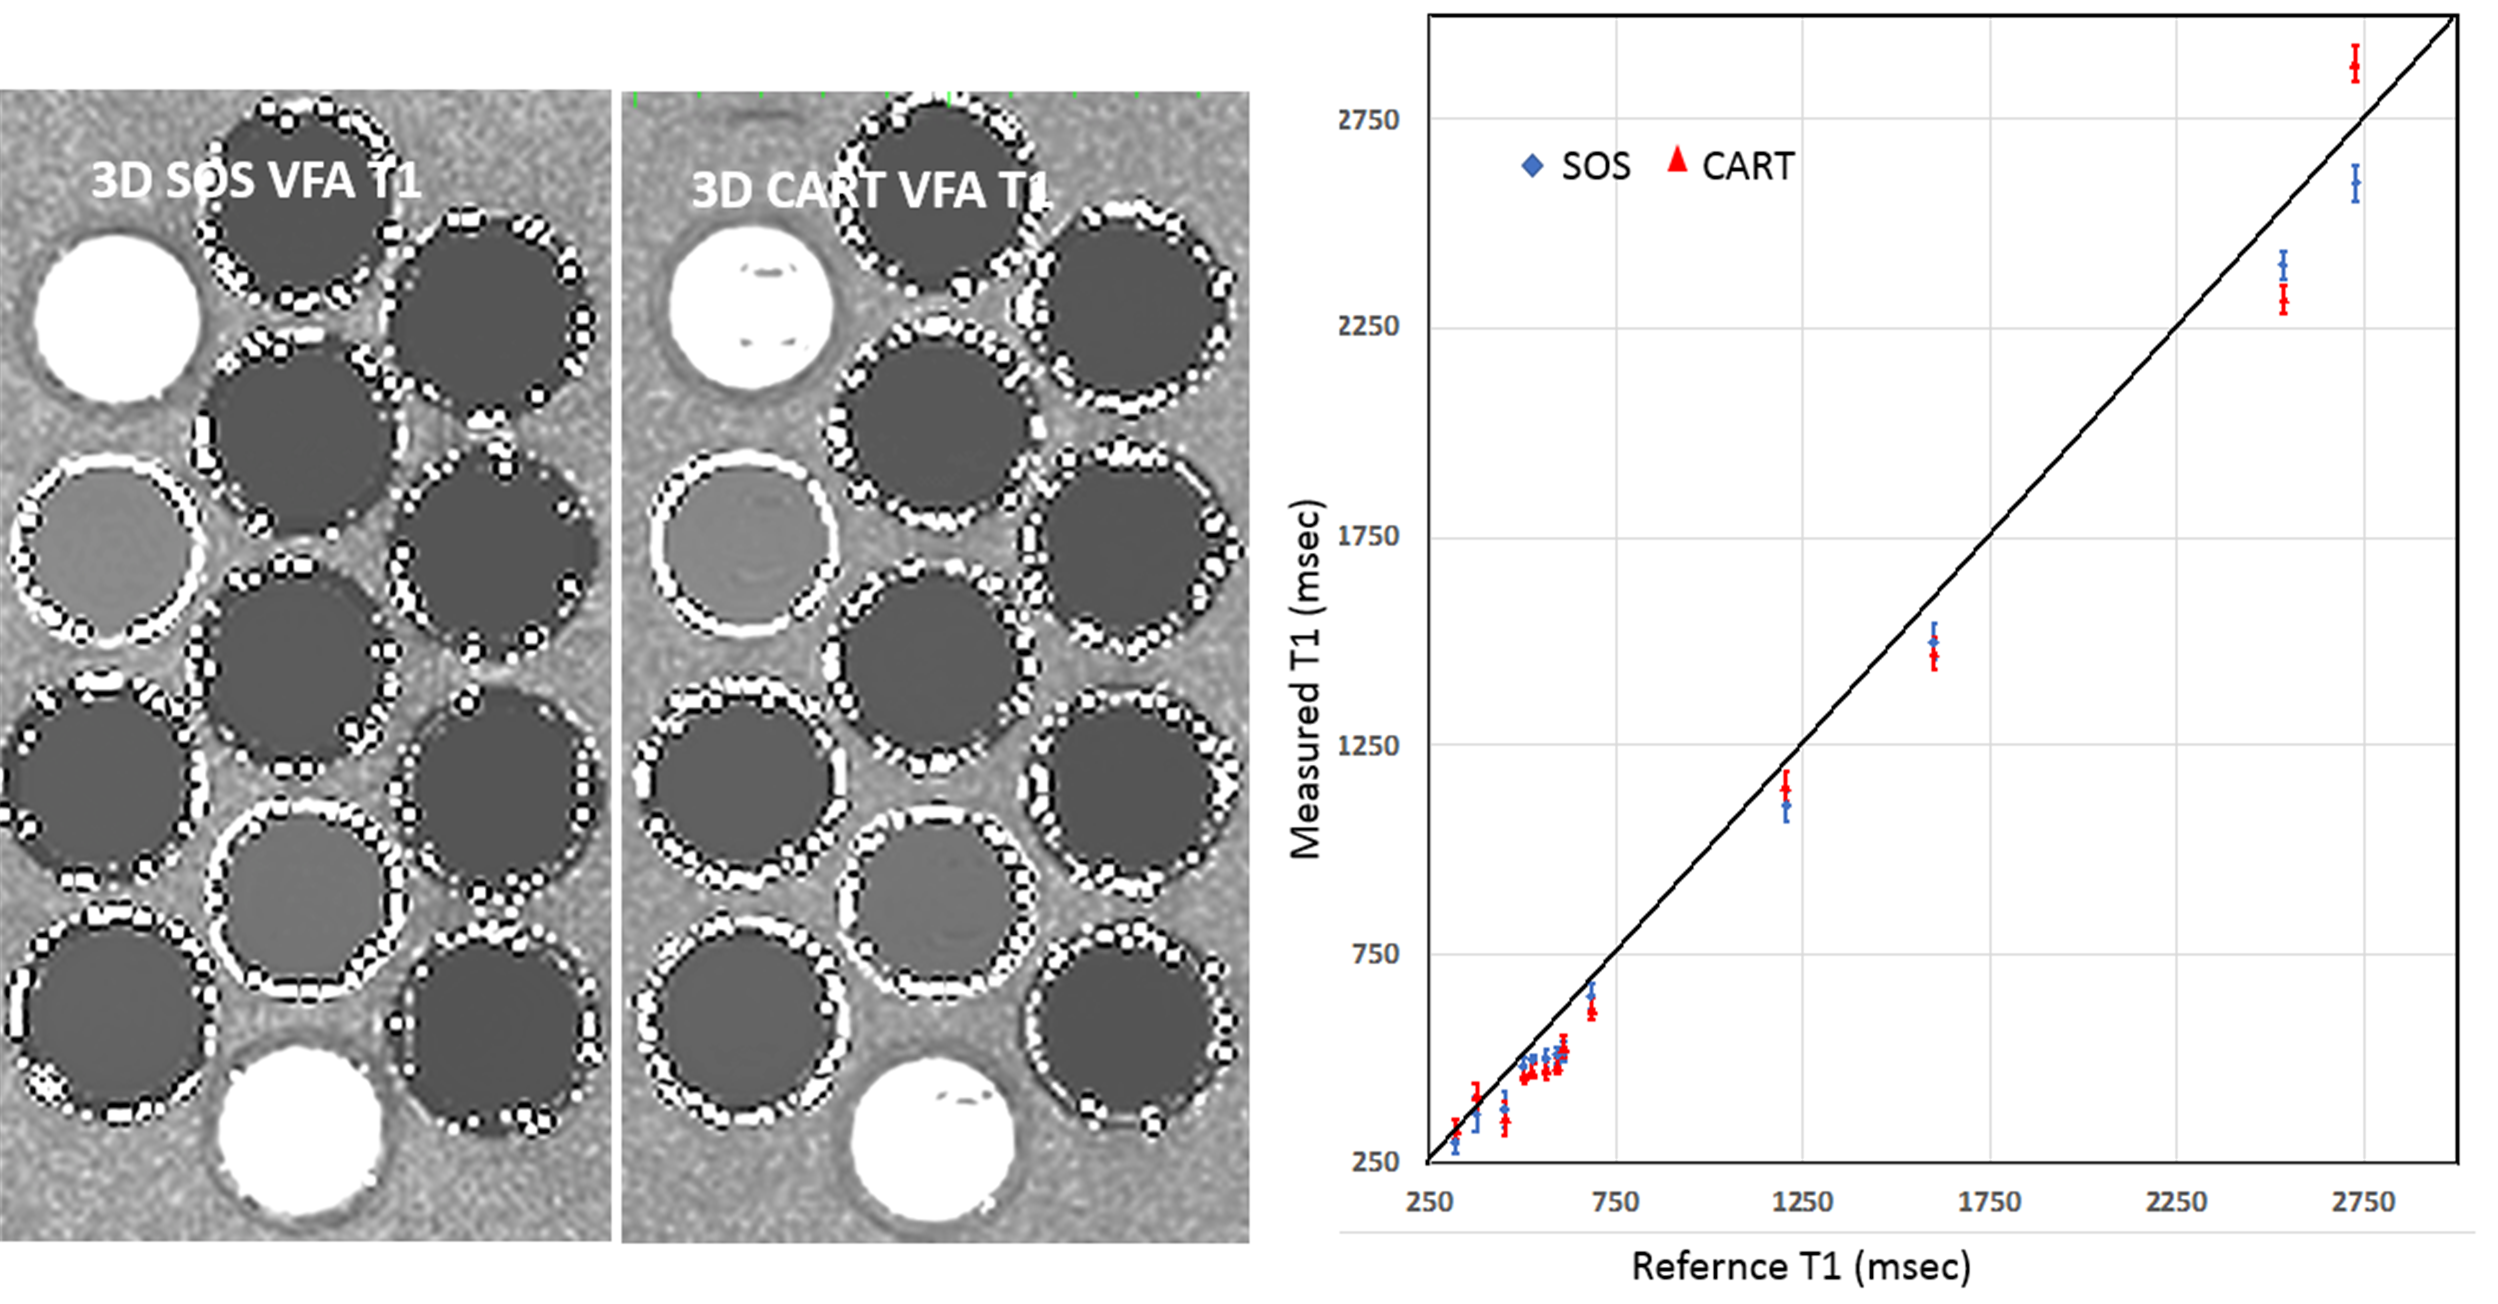
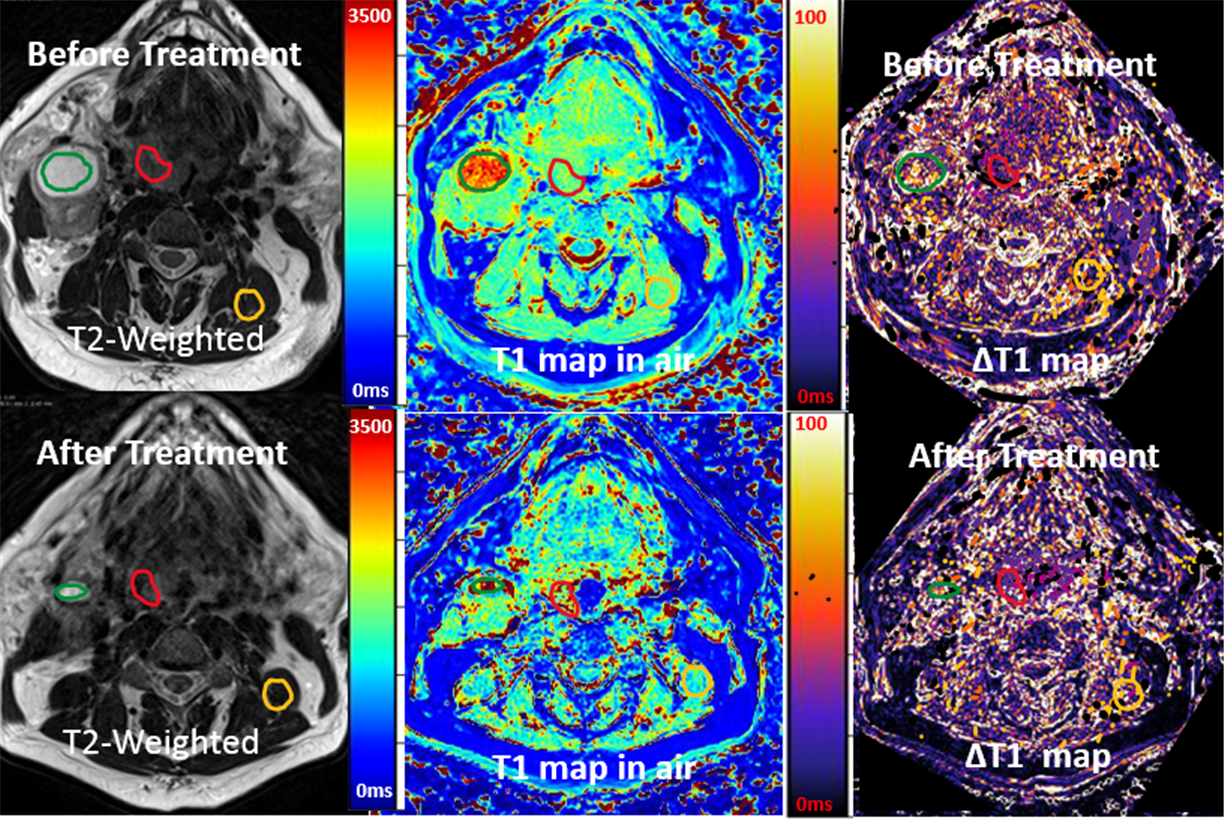
All of MRI studies were performed on a 3T MRI system (Prisma, Siemens) with 20 channel head and neck coils. A phantom was constructed with 13 vials filled with solutions of different Gd concentrations. 3D VFA T1 datasets were acquired from the phantom using a 3D SPGR sequence capable of both Cartesian (CART) and SOS samplings with same scan time and parameters. The parameters were FAs= 5o,10o,15o, resolution =1.0x1.0x2mm, TE/TR=2.5/6.7ms. 2D inversion recovery turbo spin echo (TSE) images were acquired and used for the reference T1. The CART and SOS 3D VFA T1 mapping were tested in the prospective IRB approved clinical hypoxia MR study in three patients. Subjects underwent two 3D T1 mapping before and after standard chemoradiation therapy. 3D VFA T1-MRI was performed without and with inhalation of 100% oxygen for at least 10 minutes through the face mask. The sequences and imaging parameters were similar to the phantom study parameters. The B1 maps was used to correct T1 map calculations. T1 maps with breathing air (T1air) and 10 minutes of oxygen (T1oxygen) were computed offline with custom written Python script based on the standard MR signal equation(5). Before T1 calculation, all sets of VFA images were co-registered. Changes in TOLD was evaluated by the subtraction of two T1 maps (∆T1=T1air - T1oxygen).RESULTS
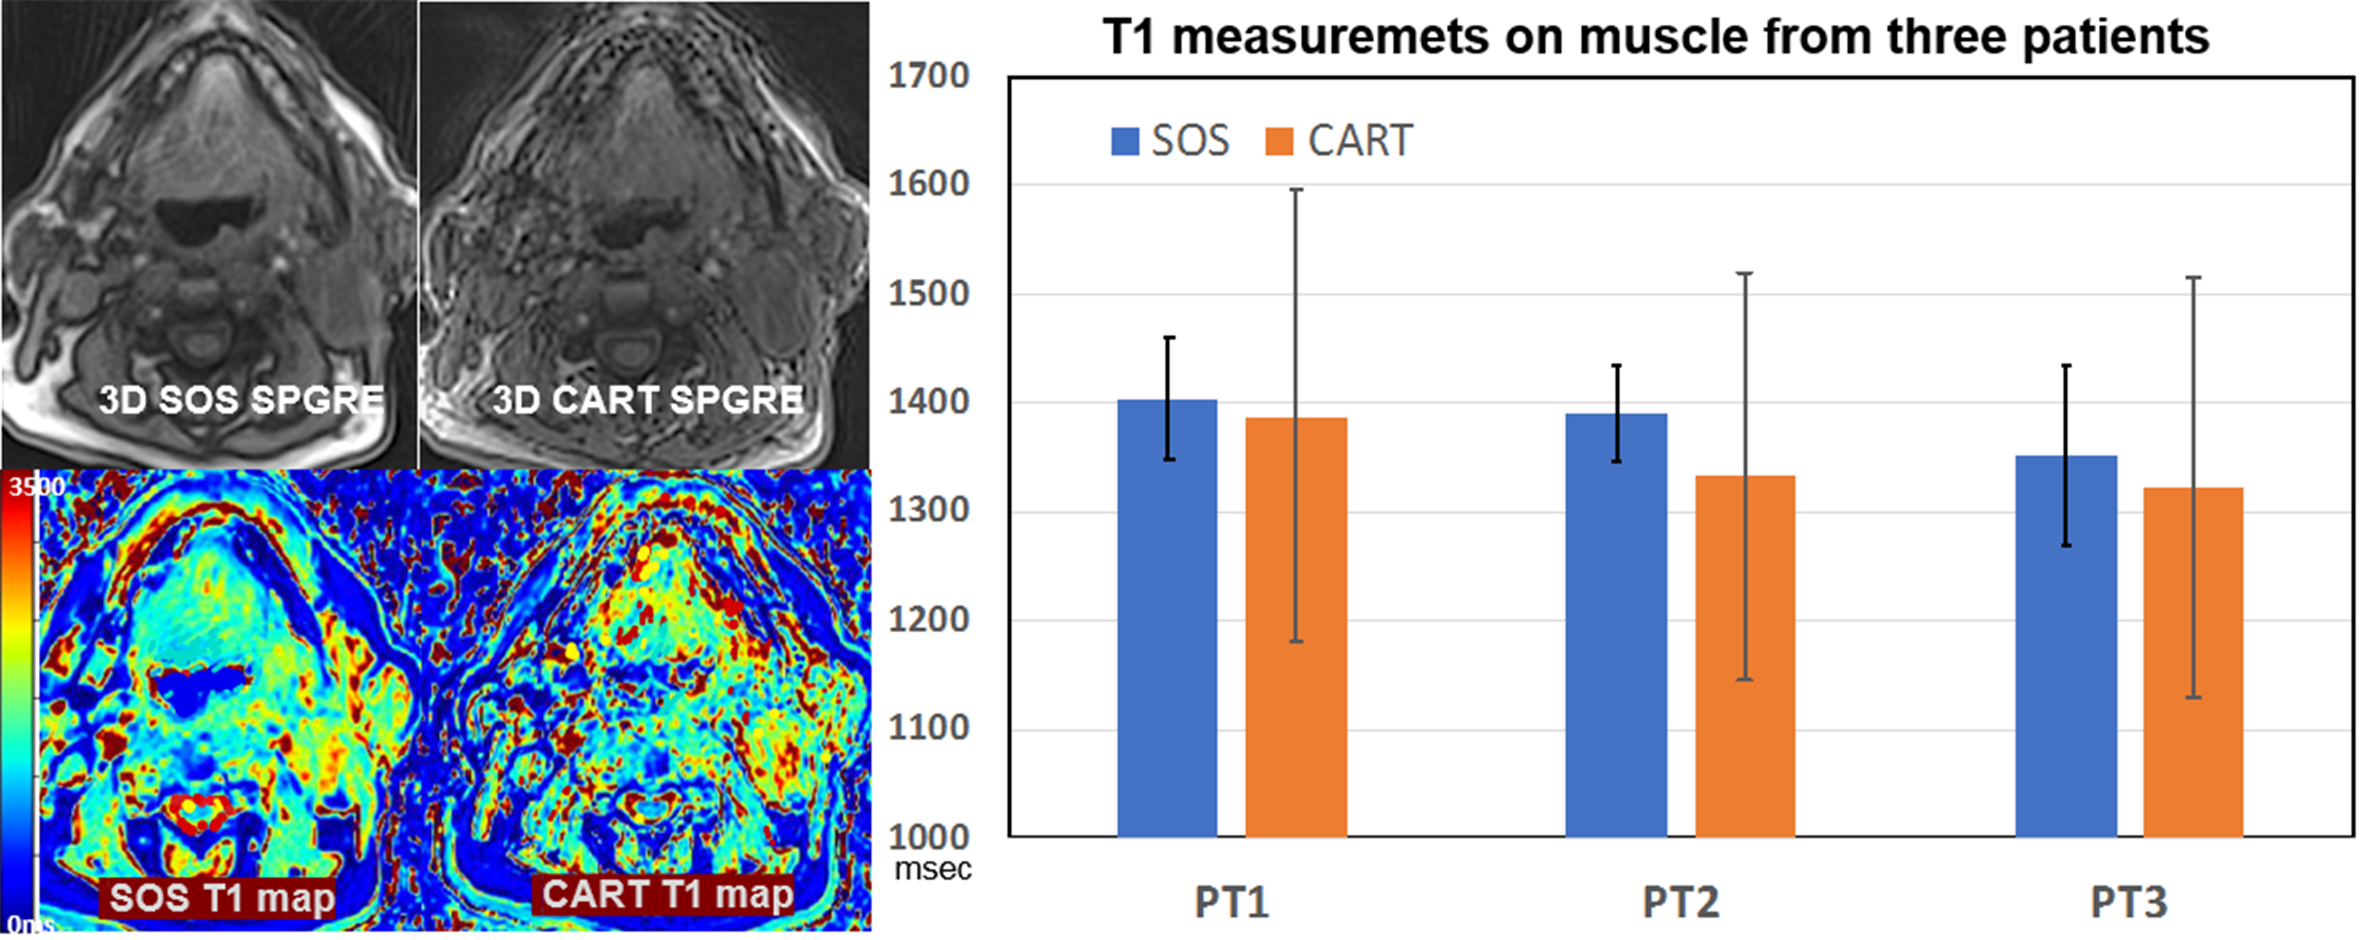
Fig 1 shows T1 measurements from the phantom study. 3D SOS ( we should use a consistent term) sampling showed less motion sensitivity in comparison with CART. T1 values measured from both acquisitions well match to the reference T1 with less than 10% error. Fig 2 shows 3D SPGRE images of a patient acquired with SOS and CART sampling (FA=8o) and the corresponding T1 maps. 3D SOS SPGRE image and T1 map clearly demonstrated sharper image features with less motion artifacts in comparison with CART sampling. The plot shows T1 values for the muscle during air breathing before treatment. The mean values of T1 of muscle measured from SOS sampling (1404.6±89ms) was in agreement with the previously reported value(1420ms)(7), while the mean value of T1 (1368.4±198ms) form CART sampling data was lower than the reported value. Furthermore, standard deviation of T1 measurements of muscle was significantly lower for SOS scans than that for CART scans indicating higher precision of T1 mapping using SOS VFA. For quantitative assessment of TOLD changes, ROIs were drawn for primary tumor, lymph node and muscle regions using T2-weighted anatomical images and copied into ΔT1 maps (Figure 3). Fig 4 demonstrates ∆T1 measurements from three patients. One patient did not undergo the 2nd scan. ∆T1s of primary tumors of all three patients were lower than ∆T1s of lymph node or muscle before treatment. After treatment TOLD changes of the primary tumors were slightly higher for patient 1 and 2.DISCUSSION
Oxygen level related changes in T1 relaxivity is relatively small. High accuracy and precision of T1 measurements are essential to detect TOLD changes. Our preliminary study demonstrated a feasibility of 3D VFA SOS sequence to detect TOLD effects of inhalation of oxygen in HNC tumors. There was a noticeable improvement in T1 maps calculated from SOS data in comparison with T1 maps from CART data. The variability in the T1 values of muscle and lymph node estimated from SOS data was noticeably smaller than variability in T1 values of these tissues from CART data. The intrinsic technical limitations such as motion sensitivity of CART sampling could be attributed to wide variations of ∆T1 measurements of HNC. Technical improvement to detect subtle oxygen enhancement effect and higher spatial resolution is critical for further advancement of hypoxia MR Imaging (8). We suggest further investigation of the multiparametric imaging incorporating the proposed TOLD MRI with DCE and BOLD to aid in the evaluation of treatment response.Acknowledgements
The study was funded by the National Center for Advancing Translational Sciences of the National Institutes of Health Pilot grant under Award Number1UL1TR002538.ReferenceReferences
1. M H, P V: Tumor hypoxia: definitions and current clinical, biologic, and molecular aspects. J Natl Cancer Inst 2001; 93:266–276.
2. Nordsmark M, Bentzen SM, Rudat V, et al.: Prognostic value of tumor oxygenation in 397 head and neck tumors after primary radiation therapy. An international multi-center study. Radiother Oncol 2005; 77:18–24.
3. JP O, JH N, GJ P, et al.: Preliminary study of oxygen-enhanced longitudinal relaxation in MRI: a potential novel biomarker of oxygenation changes in solid tumors. Int J Radiat Oncol Biol Phys 2009; 75:1209–1215.
4. SP R, FA H, JR G: Noninvasive monitoring of carbogen-induced changes in tumor blood flow and oxygenation by functional magnetic resonance imaging. Int J Radiat Oncol Biol Phys 1995; 33:855–859.
5. Cheng H-LM, Wright GA: Rapid high-resolution T1 mapping by variable flip angles: Accurate and precise measurements in the presence of radiofrequency field inhomogeneity. Magn Reson Med 2006; 55:566–574.
6. Block KT, Chandarana H, Milla S, et al.: Towards Routine Clinical Use of Radial Stack-of-Stars 3D Gradient-Echo Sequences for Reducing Motion Sensitivity. J Korean Soc Magn Reson Med 2014; 18:87–106.
7. Gold GE, Han E, Stainsby J, Wright G, Brittain J, Beaulieu C: Musculoskeletal MRI at 3.0 T: relaxation times and image contrast. AJR Am J Roentgenol 2004; 183:343–351.
Figures