4999
MR T1ρ preparations: B1 and B0 inhomogeneity and T2ρ evaluation with Bloch equation-based simulation1Program of Advanced Musculoskeletal Imaging (PAMI), Cleveland Clinic, Cleveland, OH, United States, 2Department of Biomedical Engineering, Cleveland Clinic, Cleveland, OH, United States, 3Department of Electrical Engineering, Case Western Reserve University, Cleveland, OH, United States, 4Department of Radiology, Albert Einstein College of Medicine and Montefiore Medical Center, Bronx, NY, United States, 5Department of Medical Physics, Memorial Sloan Kettering Cancer Center, New York, NY, United States, 6Department of Diagnostic Radiology, Cleveland Clinic, Cleveland, OH, United States
Synopsis
Quantitative T1ρ mapping is a promising biomarker for detecting tissue compositional changes at early stages of diseases. For reliable and reproducible measurements, T1ρ preparation pulses should be robust to B0 and B1 inhomogeneity. In this work, a Bloch equation based numerical simulation tool was developed and validated. The performance of six different T1ρ preparation schemes were evaluated in terms of their responses to B0 and B1 inhomogeneities using the simulation tool and in phantoms and human subjects. T2ρ measured in phantoms and human subjects were used during simulation.
Introduction
Quantitative T1ρ mapping is a promising technique in detecting tissue compositional changes at the early stages of diseases such as Osteoarthritis.1 For this method to be successfully implemented in clinical routines, the imaging technique should be stable and robust, including responses to B0 and B1 inhomogeneities. This is especially important in body parts that are off-center, and in situations such as with metal-induced inhomogeneities due to surgeries. In the previous study, we compared 6 different preparation schemes in phantoms and in-vivo acquisitions.2 However, a numerical simulation was needed to better quantify the response to B0/B1 inhomogeneities in larger ranges. Furthermore, T2ρ needs to be considered during simulation. However, T2ρ measures are scarce and inconsistent (regarding its relationship to T1ρ values) in the literature.3,4 Therefore, the aim of this study was to investigate 6 T1ρ preparation schemes using Bloch equation-based numerical simulation, validate it by phantom acquisition, and evaluate the performance in in-vivo acquisitions. T2ρ values were measured and used in both phantoms and in-vivo.Methods
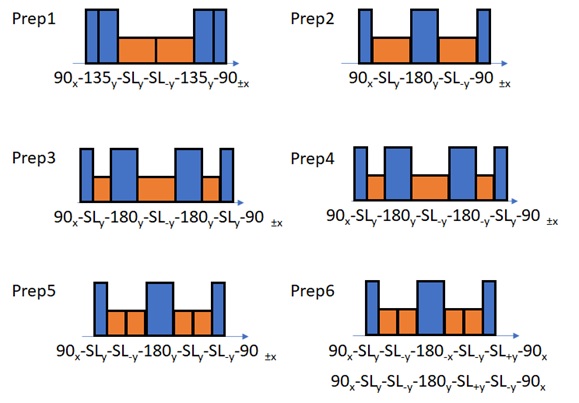
Bloch equation-based simulationA time-series Bloch equation-based simulation was developed for the 6 preparation schemes (Figure 1). The simulator follows the RF profile created for each preparation with 0.1us time steps (dT).2,5-8 When creating RF profile, B1 inhomogeneity was translated as a constant applied on RF field, and B0 inhomogeneity was translated as an B1 in z-axis (B0 direction). For all non-spinlock pulses, the RF strength was equivalent to 400us 90 degrees pulse, which matches how the preparations were implemented in the MR scanner. During a non-spinlock RF pulse, the change in magnetization (dM) was calculated by Bloch equation. During a spinlock RF pulse, dM was calculated with a slightly modified Bloch equation, where T1/T2 were changed to T1ρ/T2ρ, and T1 recovery term removed. 500Hz spinlock frequency was used in both simulation and acquisition.
Evaluation of T1ρ preparation schemes with simulation
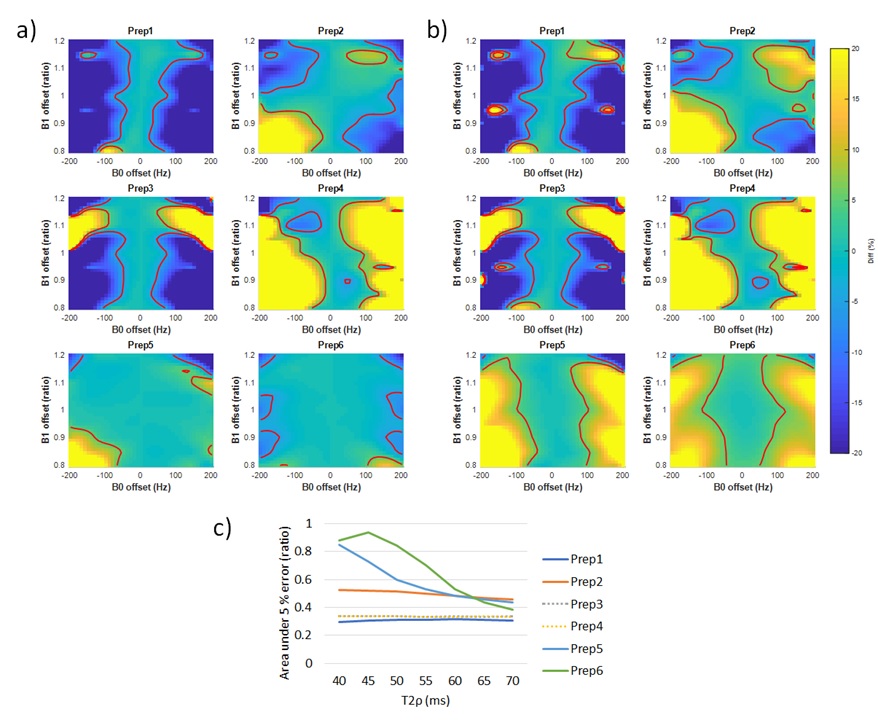
The simulation was used evaluate the performance of preparations in various B0 and B1 conditions. First, the decay curve with regards to Spinlock time (TSL=0-70ms) was generated with B0/B1 inhomogeneity of -100~+100Hz/0.8~1.2. In the curve, T1ρ/T2ρ were set to 40ms. Second, a heatmap of preparation error was drawn from B0/B1 inhomogeneity of -200~+200Hz/0.8~1.2. In the heatmap, T1ρ was locked in 40ms while changing T2ρ (40-70ms). Area under 5% quantification error was calculated by deriving the ratio of the area that has smaller than 5% T1ρ difference to evaluate the robustness of preparation regarding B0/B1 inhomogeneity.
Phantom Imaging and Simulation Validation
A 3% agarose phantom was imaged using a 3T Prisma MR scanner (Siemens Healthcare AG, Erlangen, Germany) with 1Tx/15Rx knee coil (QED, Mayfield, OH). 3D magnetization-prepared angle-modulated partitioned k-space spoiled gradient-echo snapshots (MAPSS) sequence9,10 was used to quantify T2ρ and T1ρ with different preparations. TSLs of 0,10,20,30ms were used. During acquisition, a 300uT/m gradient was used to apply ±250Hz inhomogeneity in 4cm range. The B0 was measured by double-echo gradient-echo sequence, and B1 was measured by Bloch-Siegert shift B1 mapping.11 To validate the simulation, B0/B1 maps and reference T1ρ/T2ρ values of phantom acquisition (43/70ms for T1ρ/T2ρ as measured in the phantom without B0/B1 offset) were used. The calculated T1ρ values from the simulation were compared with phantom acquisition values at all positions.
Human Subject Imaging
A healthy volunteer was scanned with all T1ρ preparations and T2ρ. TSL of 0,10,30,70ms was used, and an additional dual-echo steady-state image was collected for cartilage segmentation using Deep Learning-based automatic segmentation.12 Six compartments were segmented, and average T1ρ/T2ρ were reported.
Results
Figure 2 shows the T1ρ curves generated by simulation. The oscillation in the curve increases with increased B0/B1 inhomogeneities, and these oscillations result in banding artifacts in the acquisition. Among the preparations, Prep6 showed the least amount of oscillation.Figure 3 shows the heatmap of T1ρ quantification error with different B0/B1 inhomogeneities. The trend changed with different combinations of T1ρ/T2ρ, and in this setup, Prep6 showed the best result when T2ρ was smaller than 65ms.
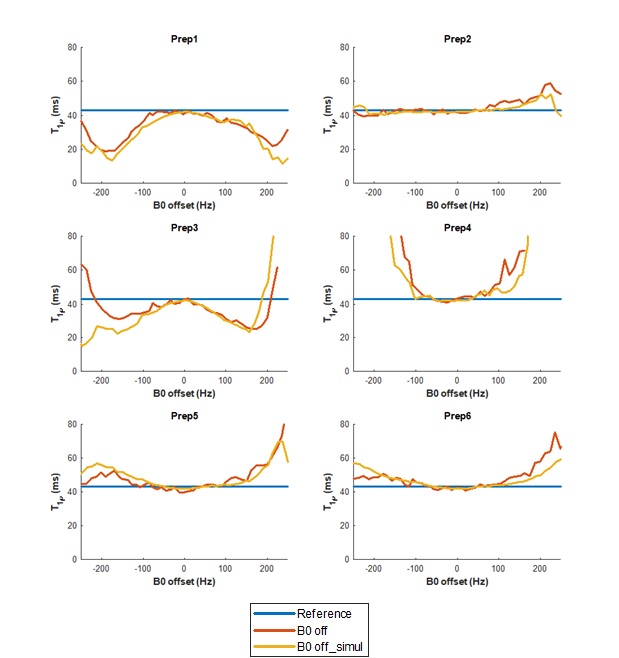
Figure 4 shows the validation of simulation to the acquisition. It clearly shows the simulation reflects the actual acquisition, verifying that the simulation can be used to evaluate different preparations.
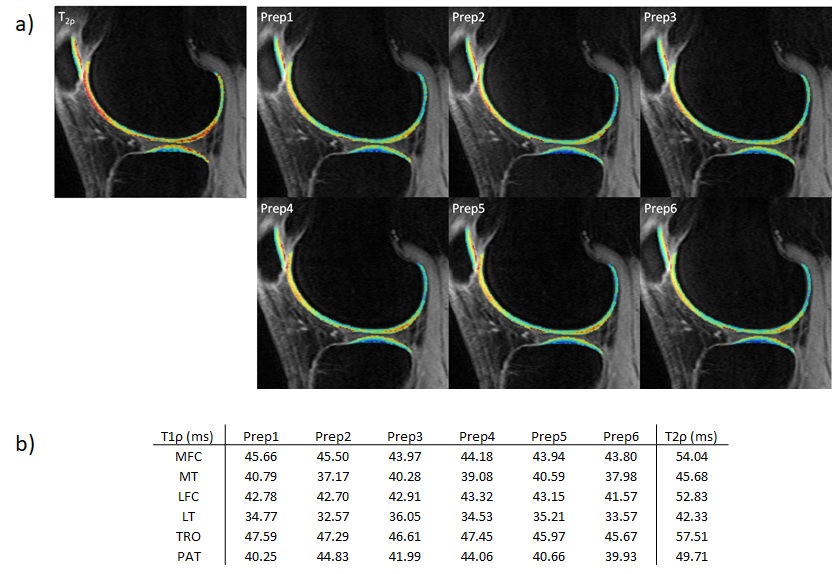
Figure 5 shows the T1ρ/T2ρ values acquired from a healthy volunteer. Even with the change in preparation methods, the quantitative values were close in general. Also, T2ρ was longer by 10ms than T1ρ in general.
Discussion
We have developed and validated a simulation tool for evaluating responses of T1ρ preparation schemes to B0/B1 inhomogeneity. Such tools will be helpful for future continuous optimization of T1ρ preparation design. According to the simulation, Prep6 showed the least oscillation in signal curve with B0/B1 offset. This characteristic does not only decrease the banding artifact easily seen in areas with large inhomogeneity but also decreases the variability of T1ρ quantification caused by different choices of TSLs. Also, Prep6 was most robust to B0/B1 inhomogeneity unless T2ρ was 30ms longer than T1ρ. According to the in-vivo measurement, T2ρ was different by 10ms. Therefore, we expect Prep6 to show the best performance in in-vivo. The sequence will be evaluated in more human subjects for responses to B0/B1 inhomogeneity, scan-rescan repeatability, and inter-vendor inter-site variations in future studies.Acknowledgements
The study was supported by NIH/NIAMS R01 AR077452References
1. MacKay JW, Low SBL, Smith TO, et al. Systematic review and meta-analysis of the reliability and discriminative validity of cartilage compositional MRI in knee osteoarthritis. Osteoarthritis and cartilage. 2018;26(9):1140-52
2. Kim J, Peng Q, Wu C, et al. MR T1rho preparations: B1 and B0 inhomogeneity response on 3T and 7T systems. International Society for Magnetic Resonance in Medicine. 2021
3. Wheaton AJ, Borthakur A, Kneeland JB, et al. In vivo quantification of T1rho using a multislice spin-lock pulse sequence. Magnetic resonance in medicine. 2004;52(6):1453-8
4. Casula V, Nissi MJ, Podlipská J, et al. Elevated adiabatic T(1ρ) and T(2ρ) in articular cartilage are associated with cartilage and bone lesions in early osteoarthritis: A preliminary study. Journal of magnetic resonance imaging : JMRI. 2017;46(3):678-89
5. Chen W. Errors in quantitative T1rho imaging and the correction methods. Quantitative imaging in medicine and surgery. 2015;5(4):583-91
6. Pang Y. A self-compensated spin-locking scheme for quantitative R1ρ dispersion in articular cartilage. International Society for Magnetic Resonance in Medicine. 2020
7. Gram M, Seethaler M, Gensler D, et al. Balanced spin-lock preparation for B(1) -insensitive and B(0) -insensitive quantification of the rotating frame relaxation time T(1ρ). Magnetic resonance in medicine. 2021;85(5):2771-80
8. Mitrea BG, Krafft AJ, Song R, et al. Paired self-compensated spin-lock preparation for improved T1ρ quantification. Journal of magnetic resonance (San Diego, Calif : 1997). 2016;268:49-57
9. Li X, Han ET, Busse RF, et al. In vivo T(1rho) mapping in cartilage using 3D magnetization-prepared angle-modulated partitioned k-space spoiled gradient echo snapshots (3D MAPSS). Magnetic resonance in medicine. 2008;59(2):298-307
10. Li X, Pedoia V, Kumar D, et al. Cartilage T1rho and T2 relaxation times: longitudinal reproducibility and variations using different coils, MR systems and sites. Osteoarthritis and cartilage. 2015;23(12):2214-23
11. Sacolick LI, Wiesinger F, Hancu I, et al. B1 mapping by Bloch-Siegert shift. Magnetic resonance in medicine. 2010;63(5):1315-22
12. Gaj S, Yang M, Nakamura K, et al. Automated cartilage and meniscus segmentation of knee MRI with conditional generative adversarial networks. Magnetic resonance in medicine. 2020;84(1):437-49
Figures