4998
High-Resolution Brain Metabolite T2 Mapping Using Optimized Multi-TE MRSI1Department of Bioengineering, University of Illinois at Urbana-Champaign, Urbana, IL, United States, 2Beckman Institute for Advanced Science and Technology, Urbana, IL, United States
Synopsis
Metabolite T2 is recognized as an important physiological and disease biomarker, whose measurement also benefits metabolite quantification. However, the SNR challenge of MRSI and prolonged scan time for multi-TE acquisition limit the imaging resolution. This work presents an optimized multi-TE MRSI strategy to achieve high-resolution 3D brain metabolite T2 mapping. Specifically, estimation-theoretic TE selection was analyzed for optimized metabolite T2 estimation. An enhanced parameter estimation strategy was proposed. Both simulation and invivo studies were conducted to evaluate our method. The exciting capability of simultaneous high-resolution metabolite, neurotransmitter and T2 mapping is demonstrated for the first time.
Introduction
The relaxation parameters of brain metabolites, e.g., T2, are important physiological and disease biomarkers 1-4. Estimation of molecule-specific T2 can also be beneficial for metabolite quantification.5-6 However, due to the inherent SNR challenge of MRSI and prolonged scan time for acquiring data at multiple TEs to encode the T2 decays, existing metabolite T2 estimation studies are restricted to single voxels or low-resolution 2D acquisitions (around 1 cm3 voxels)2-9. In this work, we present a novel method that synergizes recent developments in rapid, high-resolution MRSI acquisition10,11, estimation-theoretic optimization of nonuniform TE selection, and subspace-based reconstruction and quantification, to enable high-resolution mapping of brain metabolite T2. Theoretical analysis, simulations, and experimental studies were performed to evaluate the effectiveness of optimized TE selection in improving the T2 estimation and our processing methods in achieving high-resolution brain metabolite T2 mapping. The capability of simultaneous 3D metabolite, neurotransmitter, and T2 mapping is demonstrated for the first time.Theory and Methods
Optimized experiments for multimolecular T2 estimation:It has been shown that uniform, many-TE acquisitions are suboptimal for metabolite quantification in multi-TE MRSI10,12,13, while investigation on optimal MRSI experimental design for T2 mapping is scarce. We developed a Cramer-Rao bound (CRB) analysis to optimize MRSI acquisitions for T2 mapping. We consider the following signal model with an explicit representation of metabolite T214:
$$
s_{TE}[m] = e^{i \varphi_{0}}\left(\sum_{n=1}^{N} c_{n} \phi_{n,TE}(m \Delta t) e^{-[TE+m\Delta t]/T_{2,n}} e^{\left(-[m\Delta t]/T_{2,n}^{\prime}\right)} e^{\left(-[m\Delta t]^{2}g\right)}\right)+\xi_{TE}[m],(1)
$$
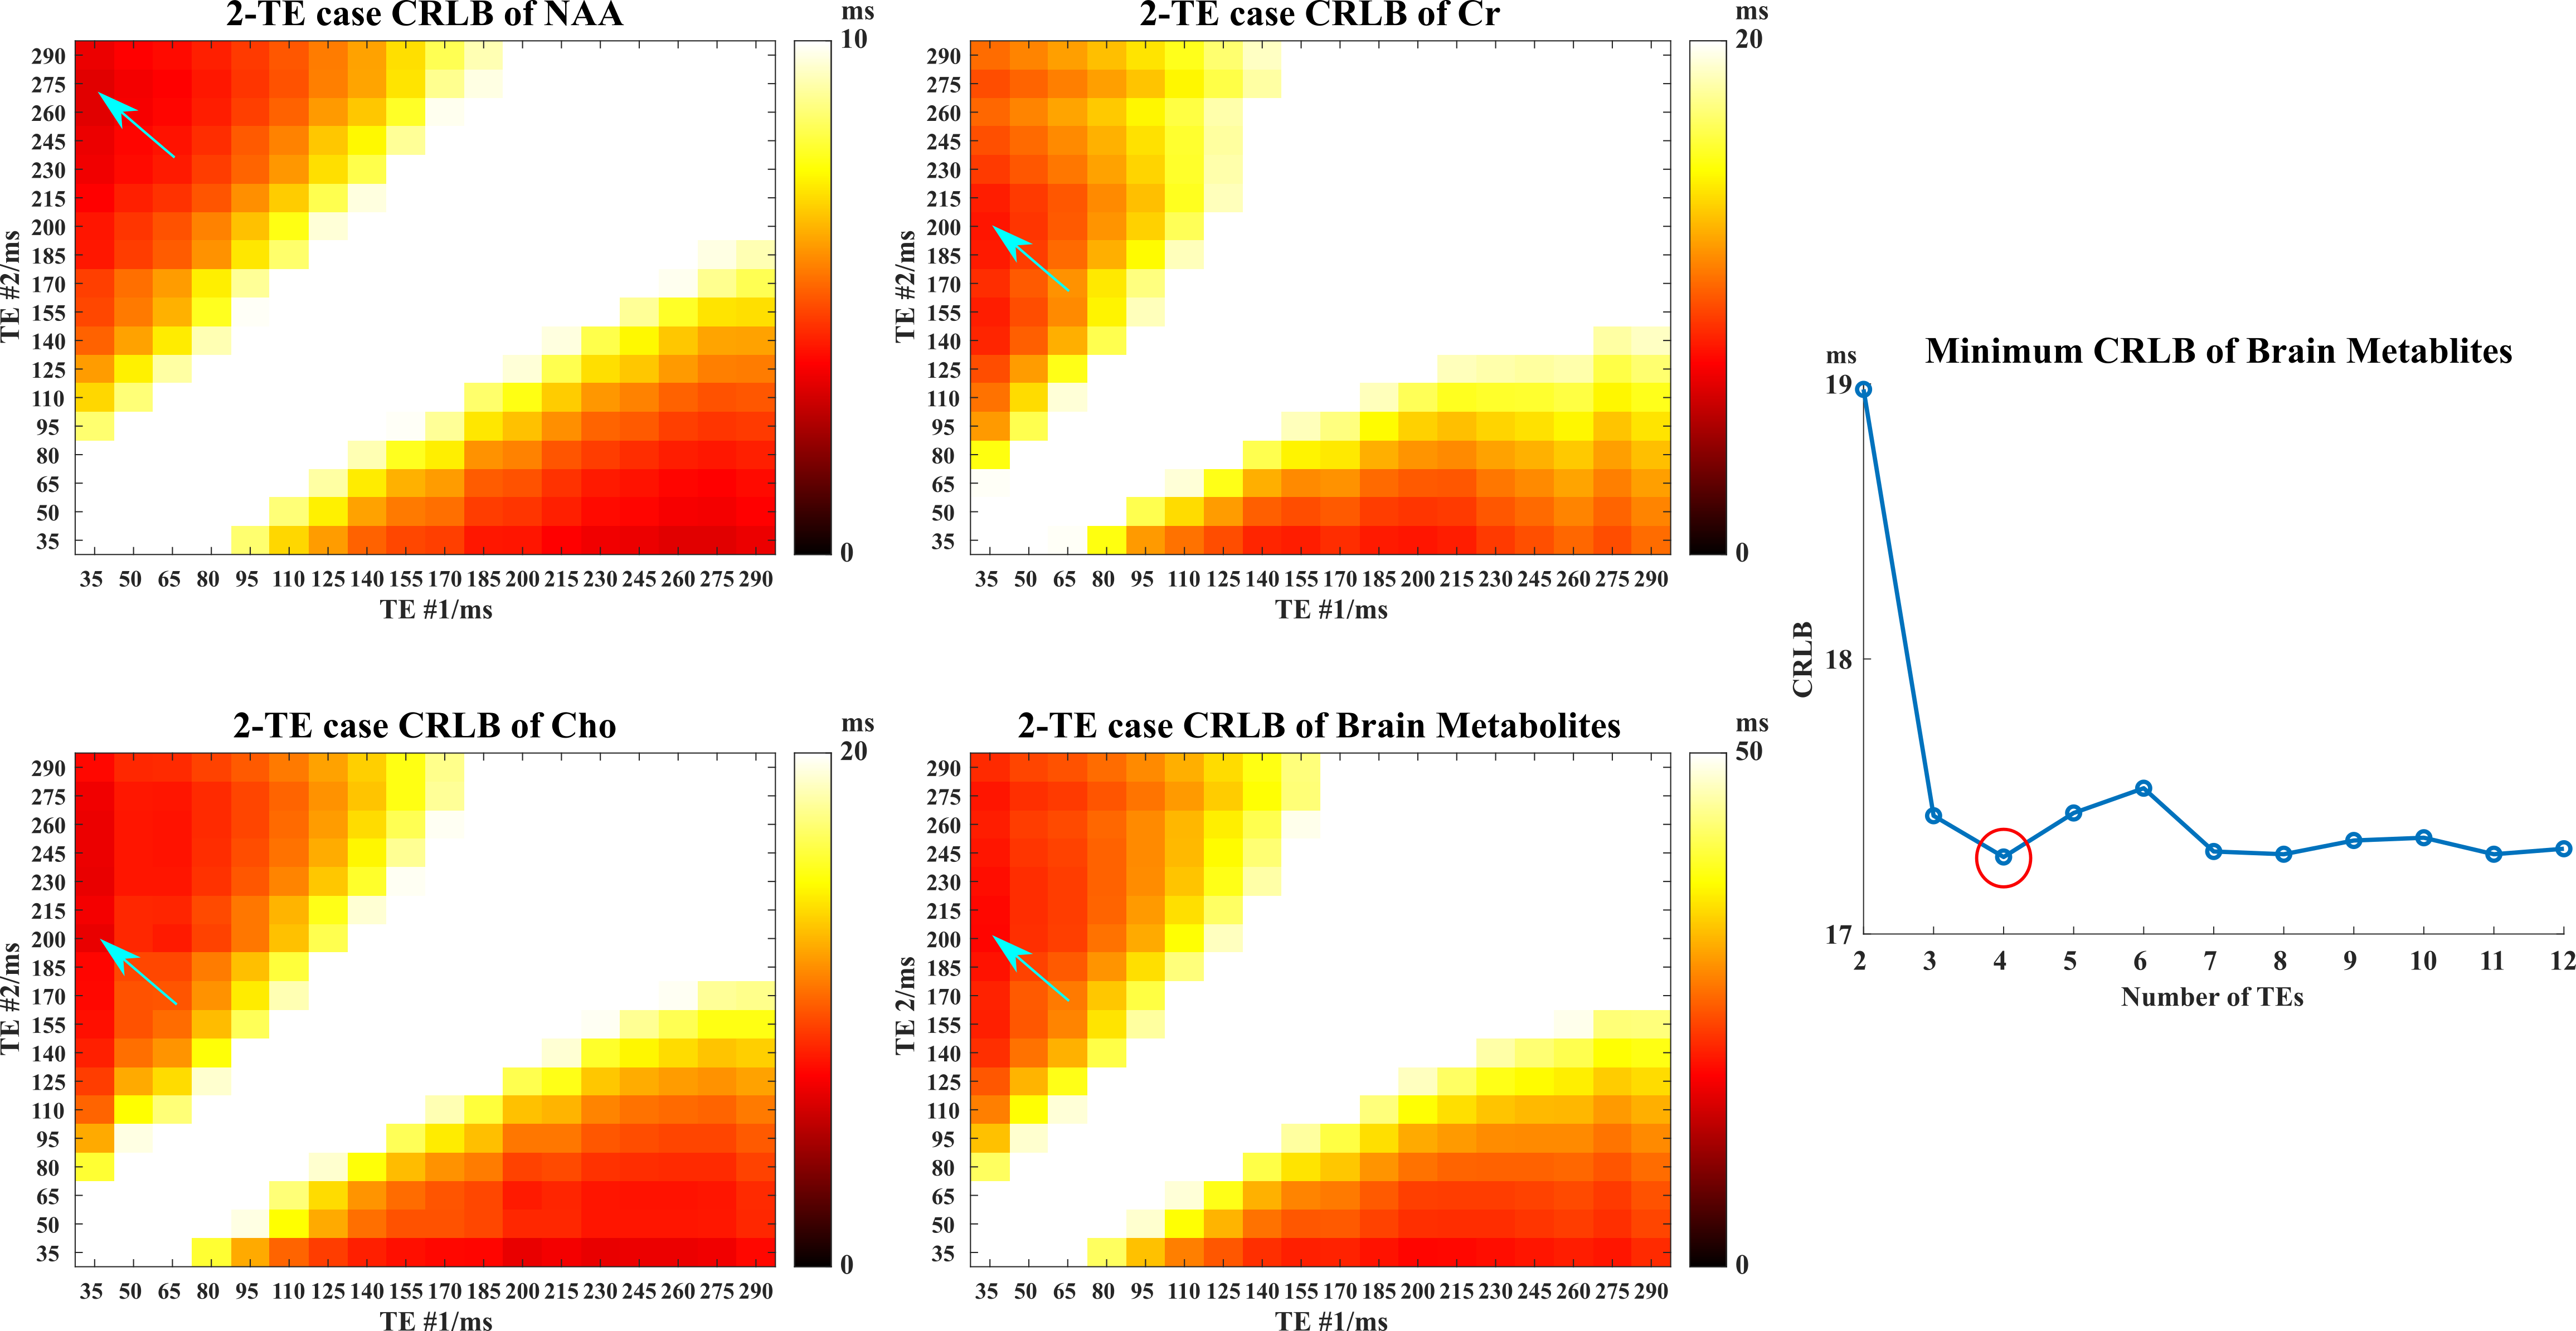
where $$$s_{TE}[m]$$$and $$$\xi_{TE}[m]$$$ represent the TE-dependent FIDs and noise, $$$\Delta t $$$ denotes sampling interval with $$$m$$$ the index, $$$\phi_{n,TE}$$$ the TE-dependent metabolite basis, $$$c_{n}$$$ the concentrations, $$$T_{2,n}$$$and $$$T_{2,n}^{\prime}$$$ the relaxation and lineshape parameters, $$$\varphi_{0}$$$ a global zeroth-order phase and $$$g$$$ captures the Gaussian lineshape. Using Eq(1), the TE-number and TE-value-dependent Fisher Information Matrix (FIM) for all the unknown parameters $$$\boldsymbol{\theta}=\left[c_{1}, \ldots c_{N}, T_{2,1}, \ldots, T_{2, n}, T_{2,1}^{\prime}, \ldots, T_{2, n}^{\prime}, \varphi_{0}, g\right]^{T}$$$ can be calculated15(details omitted). The CRB of target parameters can be computed from inverse FIM and minimized. With this flexibility, we chose here to minimize the T2 estimation variances for NAA, Cr, and Cho. Specifically, we minimize CRB under an equivalent-time constraint for fair comparisons. Since fitting T2 from single TE is extremely ill-conditioned, we performed the CRB calculation from 2 to 12 TEs (exhausted combinatorial search for the first 2 optimal TEs and greedy search for additional TEs). This allowed us to identify an optimized 4-TE combination (Fig.1).
Spatiospectral reconstruction and parameter estimation:
The fast sequence described in [11] is used to acquire data at selected TEs. Nuisance removal was performed using a multi-TE adapted union-of-subspaces (UoSS) model11,16. A subspace constrained reconstruction was done using a learned multi-TE metabolite subspace to generate TE-dependent spatiospectral functions11,17.
An enhanced multi-TE subspace approach is proposed to improve the parameter estimation, inspired by [18]. Specifically, a targeted multi-TE UoSS fitting was applied to separate different molecular components of interest from the reconstruction12, e.g.,
$$ \hat{\rho}(\mathbf{r},t_1,t_2)=\sum_{l_{NAA}=1}^{L_{NAA}}c_{l_{NAA}}(\mathbf{r})v_{l_{NAA}}(t_1,t_2)+\sum_{l_{Cr}=1}^{l_{Cr}}c_{l_{Cr}}(\mathbf{r})v_{l_{Cr}}(t_1,t_2)+\sum_{l_{{Cho}}=1}^{L_{{Cho}}}c_{l_{Cho}}(\mathbf{r})v_{l_{Cho}}(t_1,t_2)+\sum_{l_{{other}}=1}^{L_{{other}}}c_{l_{other}}(\mathbf{r}) v_{l_{other}}(t_1,t_2),(2) $$
where $$$t_2$$$ and $$$t_1$$$ denote the chemical shift and TE dimensions, respectively. The multi-TE basis $$$\{v_{l_{x}}(t_2,t_1)\}$$$ with component-specific orders $$$l_x$$$ are learned subspaces with lineshape-adapted to $$$\hat{\rho}(\mathbf{r},t_1,t_2)$$$. Spatial constraints were used during a regularized least-squares fitting of the coefficients in Eq(2). Task-specific parameter can then be estimated by parametric fitting (e.g.,ProFit14) of the separated components.
Results
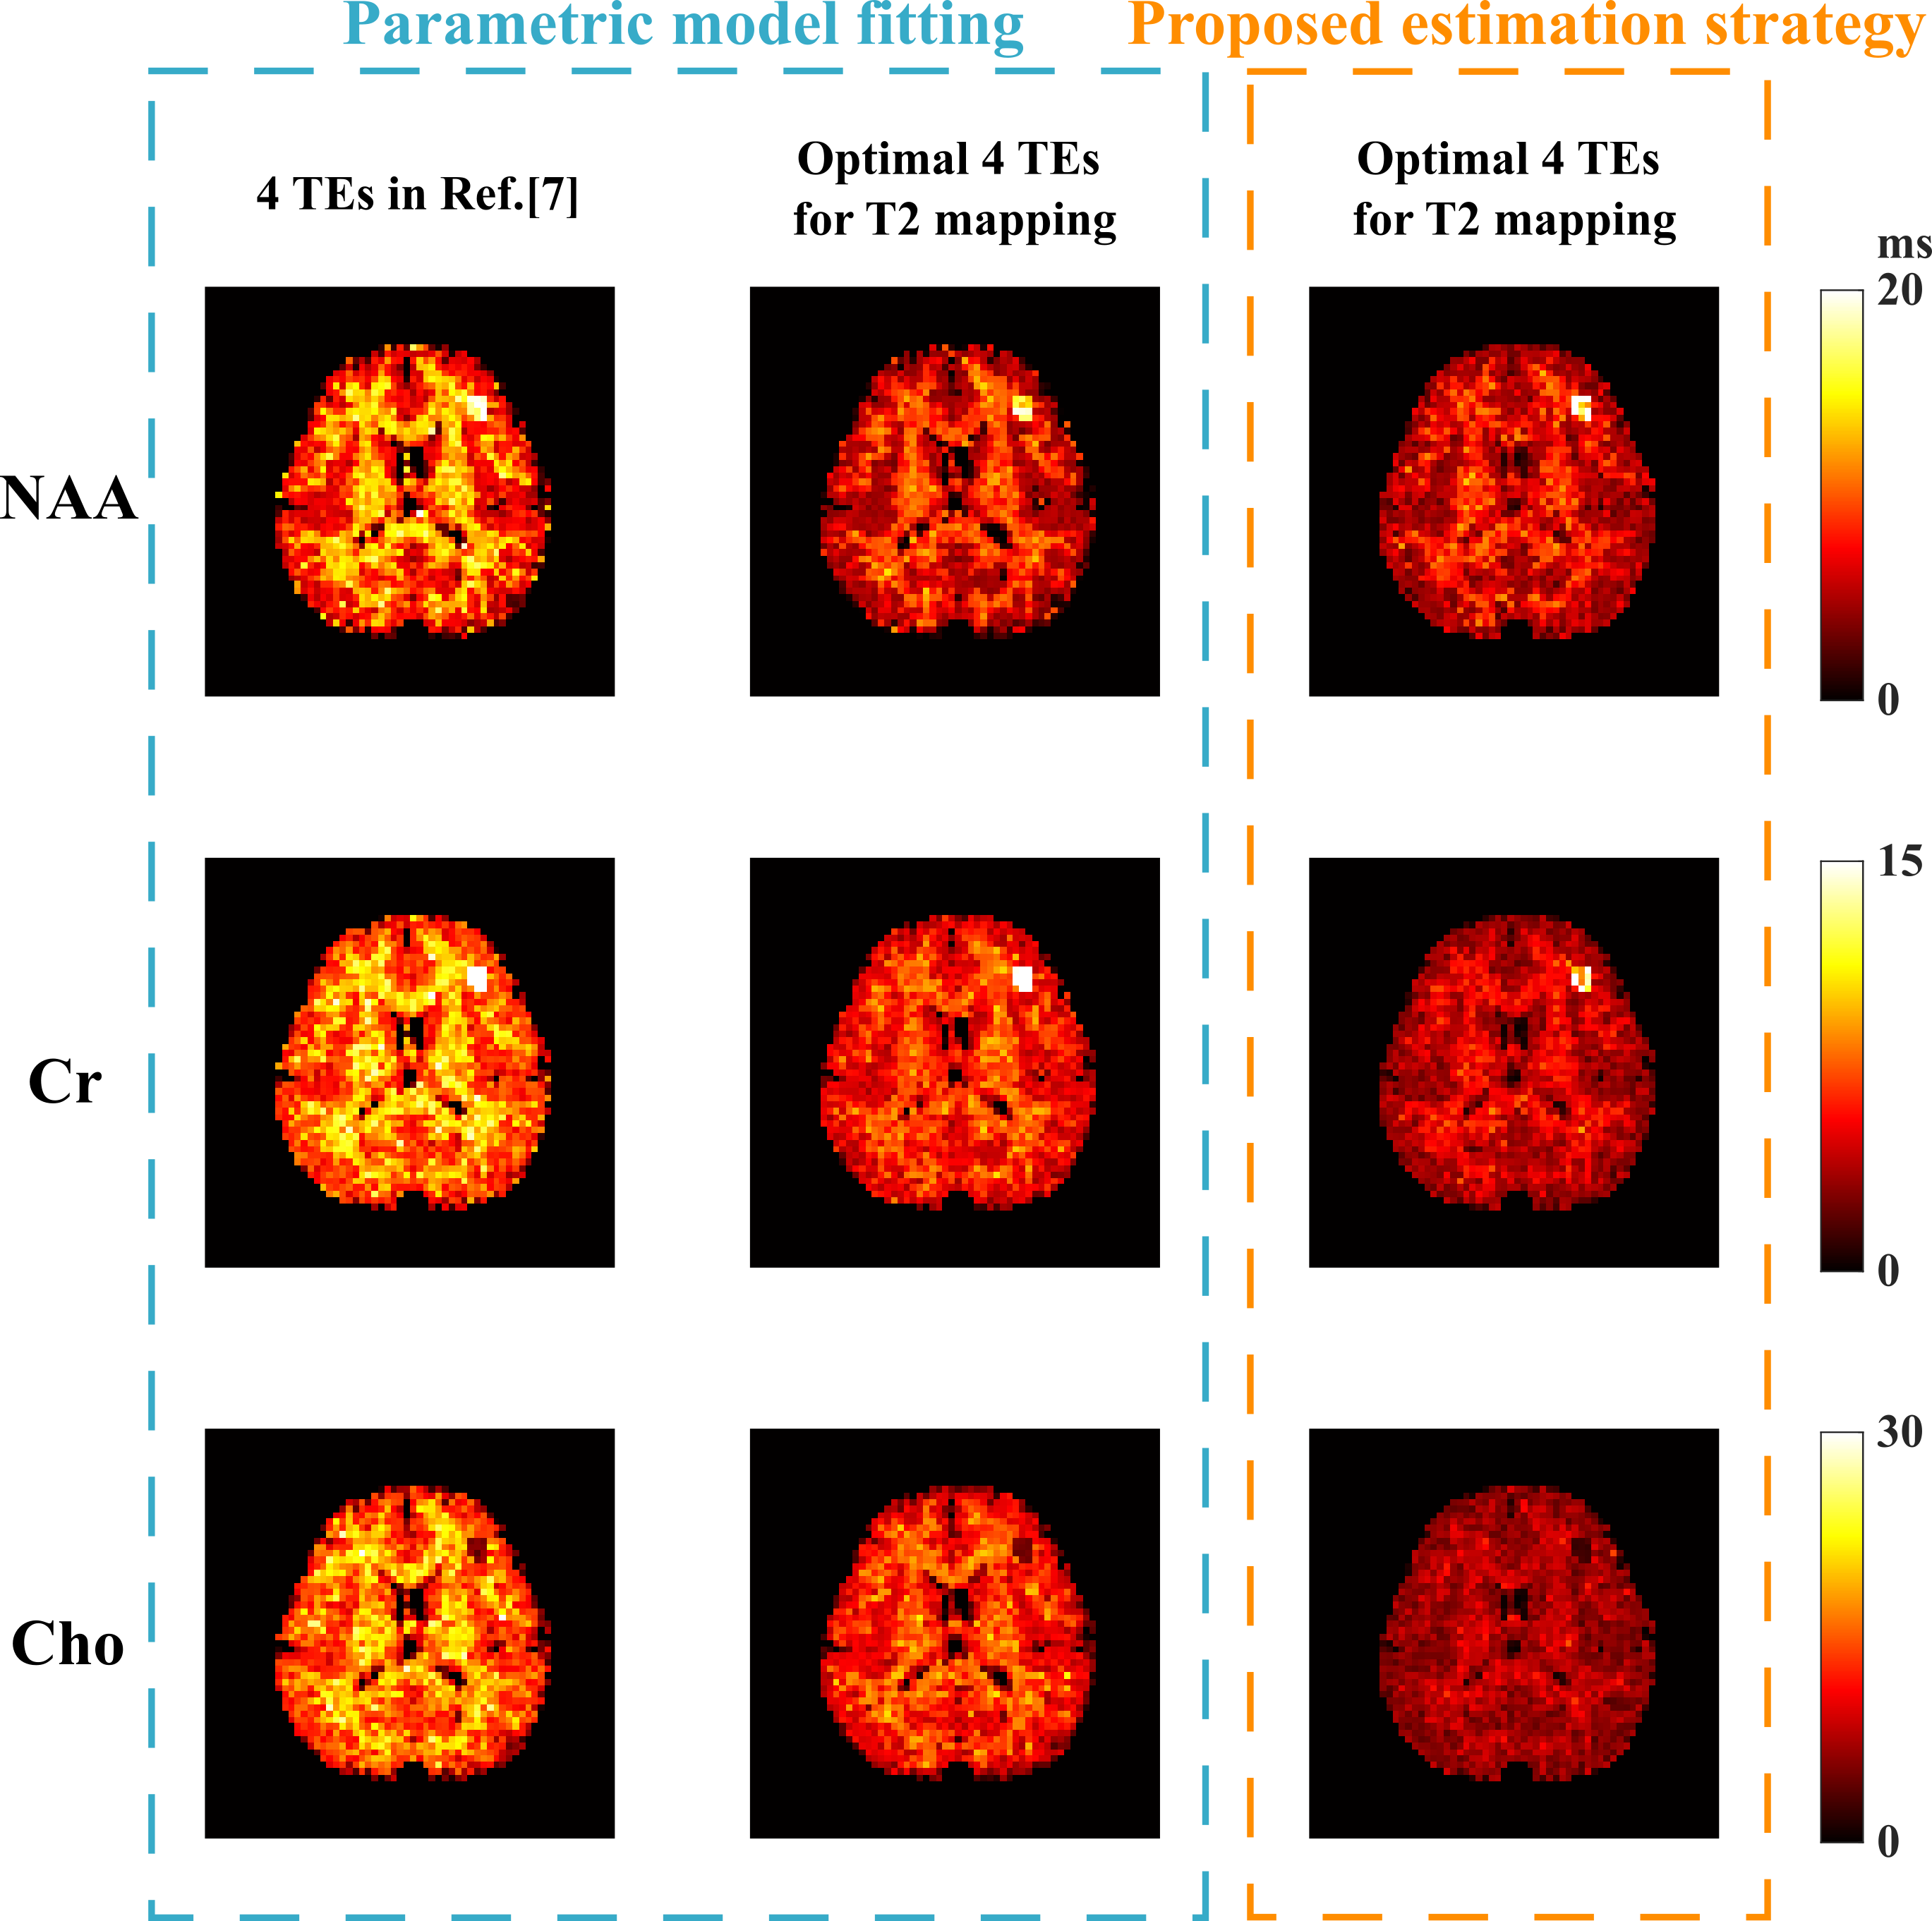
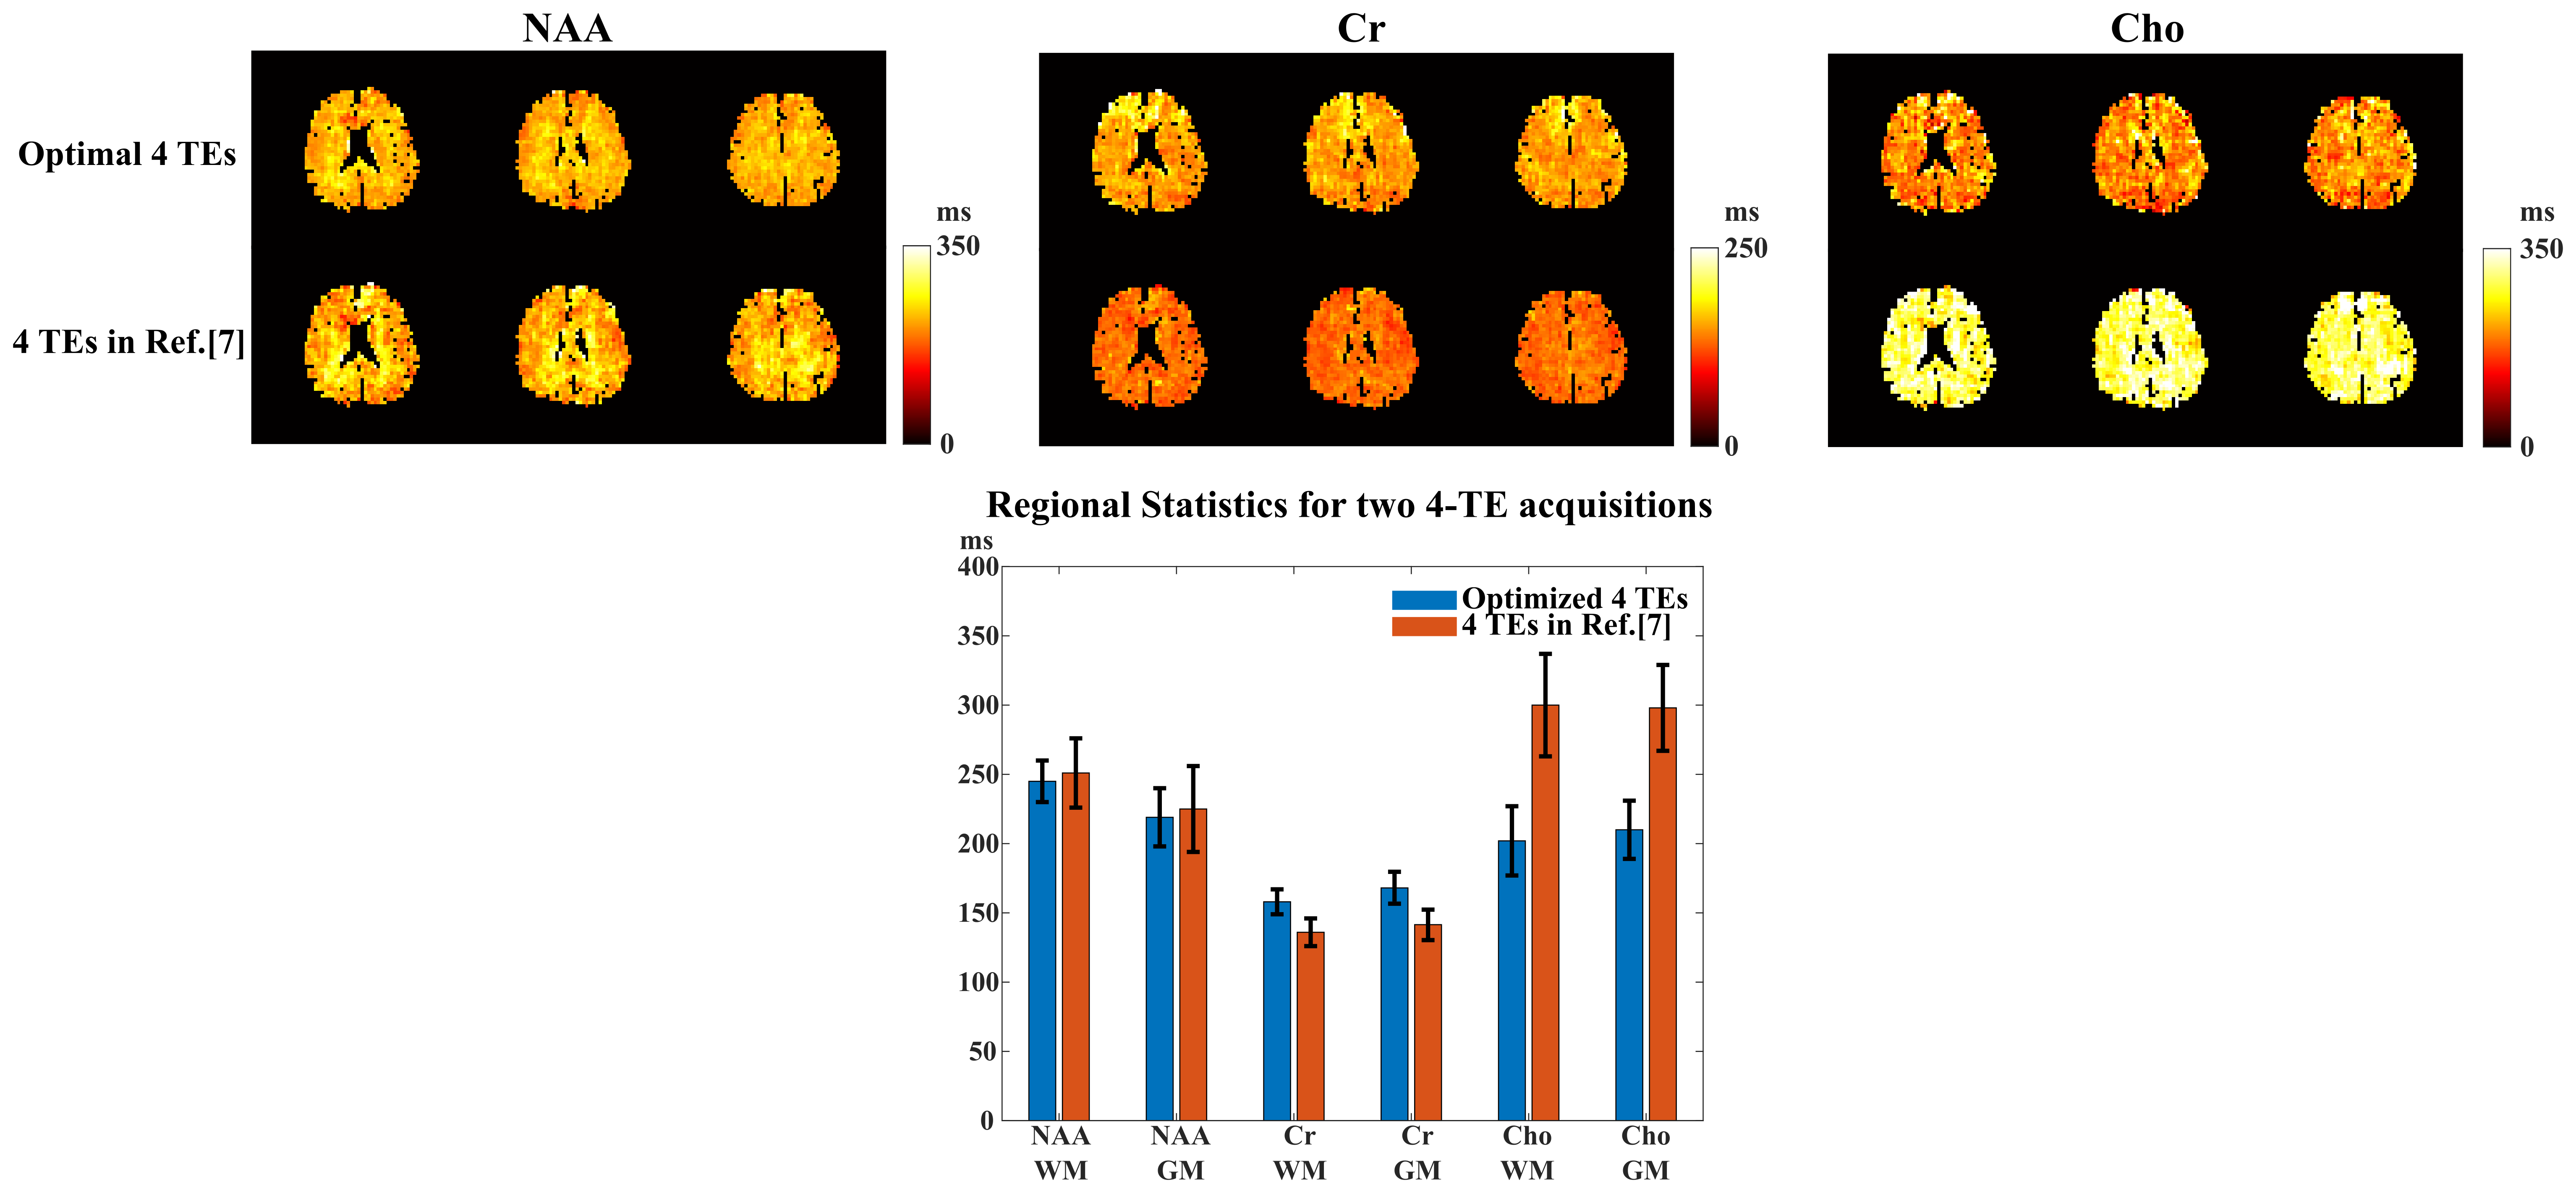
The computational multi-TE MRSI phantom in [12] was extended to include T2 spatial variations for Monte-Carlo analysis of our TE optimization and estimation strategies. In vivo data were acquired on a 3T Prisma (IRB approved) with TE-dependent (ky,kz)-undersampling to extend the k-space coverage. The total acquisition time is ~ 24 mins for 4 TEs at a 3.4×3.4×6.4 mm3 nominal resolution. An equivalent-time scan with literature TEs was also performed for comparison. Figure 1 shows the T2 CRBs of NAA, Cr, Cho, and their combination (denoted as brain metabolite) for all 2-TE combinations and more TE numbers. The brain metabolite CRB is driven by the component with higher variances (i.e, Cr and Cho) and reaches the minimum (~17ms) at 4 TEs while acquiring more TEs is not necessarily reducing estimation variance. The standard deviation maps from Monte-Carlo simulations clearly demonstrate the reduced variance achieved by our optimized 4-TE selection compared to literature 4 TEs (Fig.2), both from the same parametric fitting. Moreover, the proposed strategy further improves the estimation with the same TE selection. High-resolution 3D in vivo T2 maps for NAA, Cr, and Cho were produced using our optimized 4-TE acquisition and processing strategies (Fig.3). White/gray matter contrast in NAA T2 map can be observed, consistent with prior data. Reduced estimation variance for all metabolites can be seen for the optimized acquisition using a regional analysis (Fig.4). Results from the non-optimized TE set yielded over-estimated T2 of Cho and larger variances. The capability of simultaneously mapping metabolites, neurotransmitters, and T2s is demonstrated in Fig.5. These results suggest the task-specific optimization flexibility of the proposed method.Conclusion
A new method is proposed to achieve high-resolution brain metabolite T2 mapping. Estimation-theoretic analysis, simulations and experimental studies validate the proposed method and support the exciting capabilities of simultaneously 3D mapping of brain metabolites and their T2 parameters.Acknowledgements
This work was supported in part by NSF-CBET-1944249 and NIH-NIBIB-1R21EB029076A.References
[1] Isobe T et al. Quantification of cerebral metabolites in glioma patients with proton MR spectroscopy using T2 relaxation time correction. Magn Reson Imaging. 2002; 20:343-9.
[2] Li Y et al. Comparison of T1 and T2 metabolite relaxation times in glioma and normal brain at 3T. J. Magn Reson Imaging. 2008; 28:342-50.
[3] Walker PM et al. Time course of NAA T2 and ADCw in ischaemic stroke patients: 1H MRS imaging and diffusion-weighted MRI. J. Neurol. Sci. 2004; 220:23-8.
[4] Kirov I et al. Potential clinical impact of multiparametric quantitative MR spectroscopy in neurological disorders: A review and analysis. Magn Reson Med. 2020; 83:22-44.
[5] Mlynárik V et al. Proton T1 and T2 relaxation times of human brain metabolites at 3 Tesla. NMR Biomed. 2001; 14:325-31.
[6] Träber F et al. 1H metabolite relaxation times at 3.0 tesla: Measurements of T1 and T2 values in normal brain and determination of regional differences in transverse relaxation. J Magn Reson Imaging. 2004; 19:537-45.
[7] Tsai SY et al. Fast mapping of the T2 relaxation time of cerebral metabolites using proton echo‐planar spectroscopic imaging (PEPSI). Magn Reson Med. 2007; 57:859-65.
[8] Sijens PE et al. 1H chemical shift imaging characterization of human brain tumor and edema. European radiology. 2002; 12:2056-61.
[9] Zaaraoui W et al. Human brain‐structure resolved T2 relaxation times of proton metabolites at 3 tesla. Magn Reson Med. 2007; 57:983-9.
[10] Tang L et al. Accelerated J-resolved 1 H-MRSI with limited and sparse sampling of (k,t1,t2) -space. Magn Reson Med. 2021; 85:30-41.
[11] Wang Z et al. High-resolution, 3D multi-TE 1H-MRSI using fast spatiospectral encoding and subspace imaging, Magn Reson Med. In Press, 2021. DOI:10.1002/mrm.29015
[12] Wang Z et al. Optimized subspace-based J-resolved MRSI for simultaneous metabolite and neurotransmitter mapping, In Proc. of ISMRM, 2021, pp. 72.
[13] Bolliger CS et al, On the use of Cramér–Rao minimum variance bounds for the design of magnetic resonance spectroscopy experiments. NeuroImage, 2013; 83:1031-1040.
[14] Schulte RF et al. ProFit: two‐dimensional prior‐knowledge fitting of J‐resolved spectra. NMR Biomed. 2006; 19:255-63.
[15] Ning Q et al. Spectral quantification for high-resolution MR spectroscopic imaging with spatiospectral constraints. IEEE. Trans. Biomed. Eng. 2016; 64:1178-86.
[16] Ma C et al. Removal of nuisance signals from limited and sparse 1H MRSI data using a union-of-subspaces model. Magn Reson Med. 2016; 75:488‐ 497.
[17] Lam F et al. Ultrafast magnetic resonance spectroscopic imaging using SPICE with learned subspaces. Magn Reson Med. 2020; 83:377-390.
[18] Li Y et al. A subspace approach to spectral quantification for MR spectroscopic imaging. IEEE. Trans. Biomed. Eng. 2017; 64:2486-2489.
Figures