4996
Visualizing 4,230 White Matter Tracts at Once1Department of Intelligent SystemsEngineering, School of Informatics, Computing, and Engineering, Indiana University Bloomington, Bloomington, IN, United States, 2Imaging Genetics Center, Mark and Mary Stevens Neuroimaging and Informatics Institute, Keck School of Medicine, University of Southern California, Marina Del Rey, CA, United States, 3Imaging Genetics Center, Mark and Mary Stevens Neuroimaging and Informatics Institute, Keck School of Medicine, University of Southern California, Marina del Rey, CA, United States, 4Department of Intelligent Systems Engineering, School of Informatics, Computing, and Engineering, Indiana University Bloomington, Bloomington, IN, United States
Synopsis
We propose a dimensionality reduction method, based on the bundle-based minimum distance metric and the UMAP technique, to disentangle and visualize clusters in whole-brain tractography. In multishell diffusion MRI data from 141 elderly subjects, 30 tracts were extracted per subject using auto-calibrated RecoBundles in DIPY. A (141x30)x(141x30) bundle distance matrix was calculated and fed into UMAP. Embedding space maps showed that the same bundles were consistently mapped across subjects, making it easier to identify outliers and define clusters for population-based statistical analysis.
Introduction
Visual inspection of tractography is a crucial part of white matter tract analysis pipelines. Even so, visualizing 100+ tracts at once is not convenient in streamline space. Tracts overlap and intersect in 3D space, and it is difficult to comprehend all the bundles at once and disentangle them. Additionally, streamlines present a large amount of data that can be challenging to render. In this work, we propose a dimensionality reduction approach to visualize 30 white matter tracts extracted from each of 141 subjects (yielding 4,230 tracts in total) by embedding them in a lower-dimensional latent space.Methods
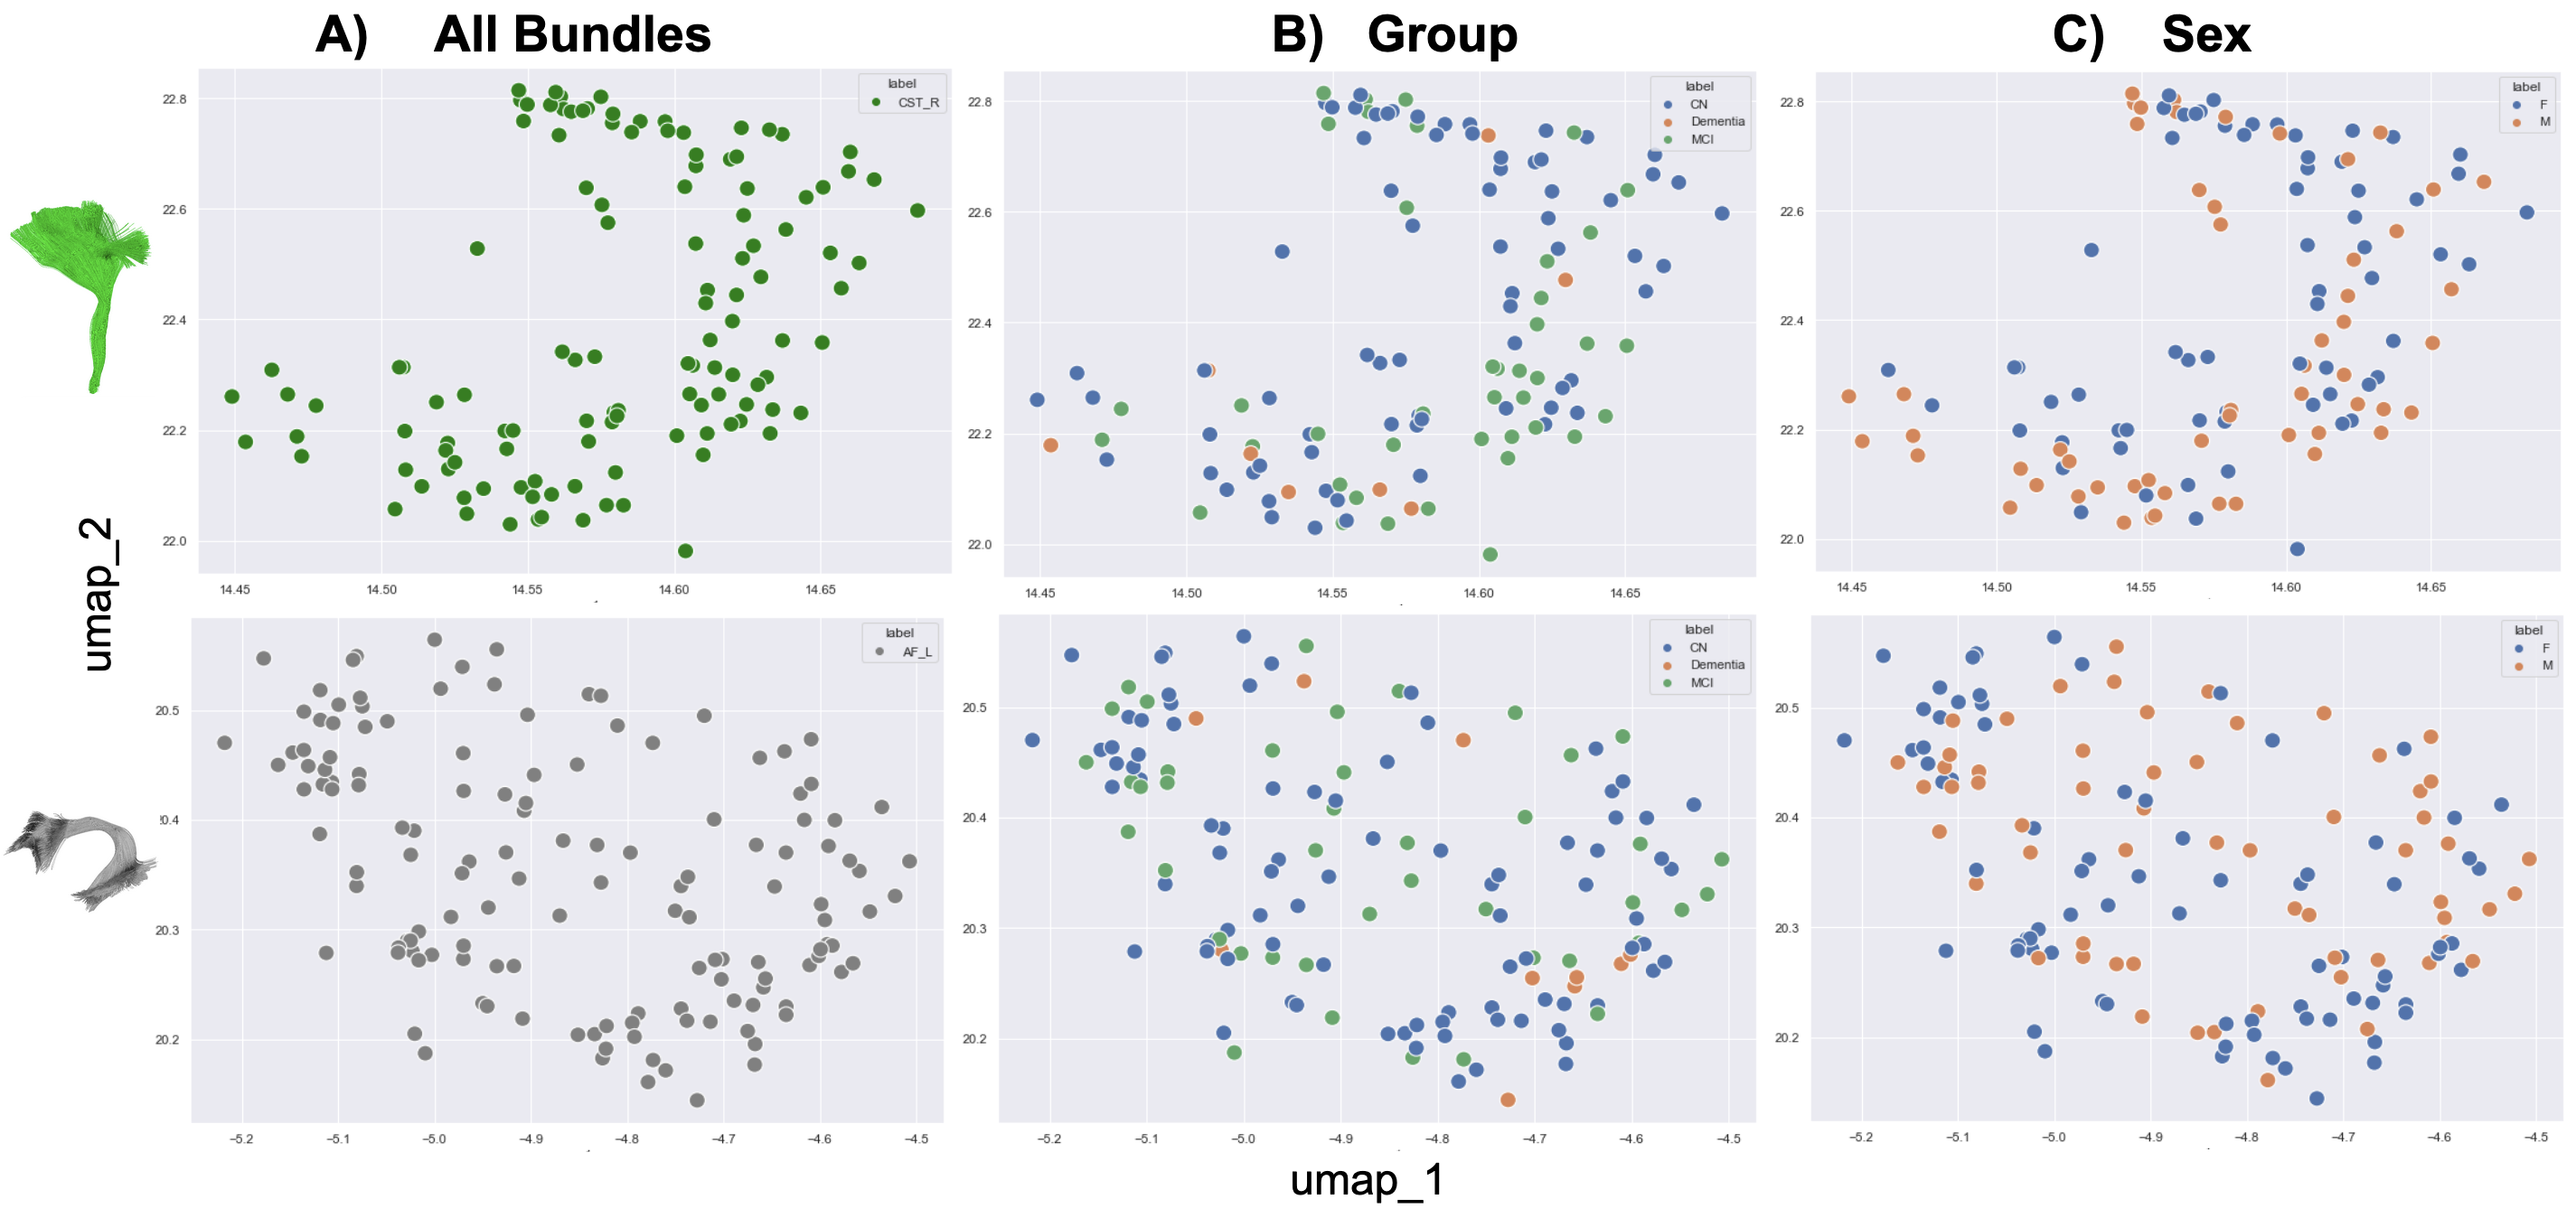
We analyzed tractography data computed from multi-shell diffusion MRI data of 141 Alzheimer’s Disease Neuroimaging Initiative (ADNI) [1] participants (age: 55-91 years, 80F, 61M) scanned on 3T Siemens scanners. dMRI consisted of 127 volumes; 13 b0, 48 b=1,000, 6 b=500 and 60 b=2,000 s/mm2 volumes with voxel size of 2.0×2.0×2.0 mm. Participants included 10 with dementia, 44 with mild cognitive impairment (MCI), and 87 cognitively normal controls (CN). dMRI were pre-processed using the ADNI3 dMRI protocol, correcting for artifacts including noise [2-5], Gibbs ringing [6], eddy currents, bias field inhomogeneity, and echo-planar imaging distortions [7-9]. We applied multi-shell multi-tissue constrained spherical deconvolution (MSMT-CSD) [10] and probabilistic particle filtering tracking algorithm [11] to generate whole-brain tractograms. 30 white matter tracts were extracted from all subjects in MNI space using DIPY’s [2] auto-calibrated RecoBundles [12,13]; the 30 tracts are listed in Fig. 1B. We start by calculating distances among N=4,230 bundles using the Bundle-based Minimum Distance (BMD) [14] metric. BMD is calculated between each bundle and every other bundle populating the NxN square distance matrix (Fig. 1A). This precalculated distance matrix is provided to the dimensionality reduction method, UMAP (Uniform Manifold Approximation and Projection) [15]. Bundles close in streamline space (i.e., the same type of bundles) are placed closer in the 2D latent space (Fig. 1B). Here, each point corresponds to a bundle. UMAP places the same types of bundles together and from an overall point of view, they seem to be overlapping. However, after zooming in on the clusters of bundles, a within-cluster structure appears. In Fig. 2A, we zoom in and visualize corticospinal tracts in the right hemisphere (CST_R) from Fig. 1B. We can further visualize tracts based on the participants’ diagnostic group (Fig. 2B) or sex (Fig. 2C).Results
We analyzed 4,230 white matter tracts, with 30 bundles per subject (30x141) in standard MNI space. A 4230x4230 bundle distance matrix was calculated and visualized in Fig. 1A. Here, each pixel represents a BMD distance between two bundles in streamline space. The bundle distance matrix was provided to UMAP and its output is visualized in Fig. 1B. Here, each point is a bundle and colored based on its type. Note we did not perform clustering. UMAP tends to place the same types of bundles together in the 2D embedding space. A cluster of mixed bundles is observed at the right bottom of the plot in Fig. 1B. These bundles were either not found in some subjects or, if found, were too thin or differed from the typical shape of that bundle type. UMAP 2D embedding helps us locate these anomalous bundles. We zoom in on a cluster of an optic radiation bundle in the right hemisphere (OR_R) in Fig. 1C, on a cluster of mixed bundles in Fig. 1D. We observe sub-clusters of different bundles in the cluster of mixed bundles and one of those sub-clusters of OR_R is further zoomed in and visualized in Fig. 1E. We observe that two clusters of the OR_R bundles were made and placed further from each other in 2D embedding space. We further investigated two OR_R clusters by coloring each bundle based on the diagnostic group the subject belongs to - i.e., CN, MCI, or dementia, as visualized in Fig. 1F and Fig. 1G.In Fig. 2A, we zoom into two tract clusters, CST_R in the first row and AF_L in the second row to further analyze them in 2D embedding. We color each bundle based on its diagnostic group in Fig. 2B. Bundles are also colored and visualized based on the participants’ sex in Fig. 2CDiscussion and Conclusion
Visualizing a huge number of white matter tracts together is impractical, verging on impossible. It requires significant human labor and skills to inspect and analyze N>100 tracts at once, or even one by one. In this work, we propose a dimensionality reduction technique to visualize N=4,230 tracts in a lower-dimensional latent space, which is more convenient to view. The arrangement of bundles is based on their distance from each other. 2D bundle embedding makes it possible to examine all the tracts at once. We obtain a holistic view of how different types of bundles are placed together. We find a cluster of mixed bundles is placed far from other clusters and it carries sub-clusters of outliers. Other covariates/characteristics of subjects can also be incorporated into the visualization such as age, sex, or diagnostic status (Fig. 2). The embedding can be used to measure the reliability of tract extraction methods and further assist the processing of white matter tracts [16].Acknowledgements
This research was supported by the NIH (National Institutes of Health) under the AI4AD project grant U01 AG068057, grant numbers P41 EB015922, and RF1 AG057892. We would like to acknowledge the National Institute of Biomedical Imaging and Bioengineering under award number R01 EB027585. Paul M Thompson received a research grant from Biogen, Inc. for research unrelated to this manuscript.References
[1] Zavaliangos-Petropulu, A., Nir, T.M., Thomopoulos, S.I., Reid, R.I., Bernstein, M.A., Borowski, B., Jack Jr, C.R., Weiner, M.W., Jahanshad, N. and Thompson, P.M., 2019. Diffusion MRI indices and their relation to cognitive impairment in brain aging: the updated multi-protocol approach in ADNI3. Frontiers in Neuroinformatics, 13, p.2.
[2] Garyfallidis, E., Brett, M., Amirbekian, B., Rokem, A., van der Walt, S., Descoteaux, M. and Nimmo-Smith, I., “Dipy, a library for the analysis of diffusion MRI data,” Front. Neuroinform. 8, 8 (2014).
[3] Manjón, J. V, Coupé, P., Concha, L., Buades, A., Collins, D. L. and Robles, M., “Diffusion weighted image denoising using overcomplete local PCA,” PLoS One 8(9), e73021 (2013).
[4] Veraart, J., Fieremans, E. and Novikov, D. S., “Diffusion MRI noise mapping using random matrix theory,” Magn. Reson. Med. 76(5), 1582–1593 (2016).
[5] Veraart, J., Novikov, D. S., Christiaens, D., Ades-Aron, B., Sijbers, J. and Fieremans, E., “Denoising of diffusion MRI using random matrix theory,” Neuroimage 142, 394–406 (2016).
[6] Kellner, E., Dhital, B., Kiselev, V. G. and Reisert, M., “Gibbs-ringing artifact removal based on local subvoxel-shifts,” Magn. Reson. Med. 76(5), 1574–1581 (2016).
[7] Andersson, J. L. R. and Sotiropoulos, S. N., “An integrated approach to correction for off-resonance effects and subject movement in diffusion MR imaging,” Neuroimage 125, 1063–1078 (2016).
[8] Andersson, J. L. R., Graham, M. S., Zsoldos, E. and Sotiropoulos, S. N., “Incorporating outlier detection and replacement into a non-parametric framework for movement and distortion correction of diffusion MR images,” Neuroimage 141, 556–572 (2016).
[9] Andersson, J. L. R., Graham, M. S., Drobnjak, I., Zhang, H., Filippini, N. and Bastiani, M., “Towards a comprehensive framework for movement and distortion correction of diffusion MR images: Within volume movement,” Neuroimage 152, 450–466 (2017).
[10] Tournier, J.-D., Calamante, F. & Connelly, A. Robust determination of the fibre orientation distribution in diffusion MRI: non-negativity constrained super-resolved spherical deconvolution. NeuroImage 35, 1459–1472 (2007).
[11] Girard, G., Whittingstall, K., Deriche, R., & Descoteaux, M. Towards quantitative connectivity analysis: reducing tractography biases. NeuroImage, 98, 266-278, 2014.
[12] Garyfallidis, E., Côté, M.A., Rheault, F., Sidhu, J., Hau, J., Petit, L., Fortin, D., Cunanne, S. and Descoteaux, M., 2018. Recognition of white matter bundles using local and global streamline-based registration and clustering. NeuroImage, 170, pp.283-295.
[13] Chandio, B.Q., Risacher, S.L., Pestilli, F., Bullock, D., Yeh, F.C., Koudoro, S., Rokem, A., Harezlak, J. and Garyfallidis, E., 2020. Bundle analytics, a computational framework for investigating the shapes and profiles of brain pathways across populations. Scientific Reports, 10(1), pp.1-18.
[14] Garyfallidis, E., Ocegueda, O., Wassermann, D. and Descoteaux, M., 2015. Robust and efficient linear registration of white-matter fascicles in the space of streamlines. NeuroImage, 117, pp.124-140.
[15] McInnes, L., Healy, J. and Melville, J., 2018. Umap: Uniform manifold approximation and projection for dimension reduction. arXiv preprint arXiv:1802.03426.
[16] Chandio, B.Q., Chattopadhyay, T., Owens-Walton, C., Villalon Reina, J.E., Nabulsi, L., Thomopoulos, S.I., Garyfallidis, E., and Thompson, P.M., 2021. “FiberNeat: unsupervised streamline clustering and white matter tract filtering in latent space,” bioRxiv 2021. doi: 10.1101/2021.10.26.465991.
Figures