4991
Localization of Prostate Cancer at 3-T Multiparametric Magnetic Resonance Imaging using Prostate Sector Map1Radiology, University of California, Los Angeles, Los Angeles, CA, United States, 22Department of Diagnostic and Therapeutic Radiology, Ramathibodi Hospital, Bangkok, Thailand, 3Urology, University of California, Los Angeles, Los Angeles, CA, United States
Synopsis
Multiparametric magnetic resonance imaging (mpMRI) has a significant impact on prostate cancer (PCa) diagnosis. However, it is important to realize its accuracy for PCa detection. In this study, we compare mpMRI with whole-mount histopathology (WMHP) images as a reference to discover the limitation of mpMRI for PCa lesion localization. The results are presented as a spatial probability map, corresponding to the prostate sector map used in Prostate Imaging Reporting and Data System version 2.1 (PI-RADSv2.1), to highlight the regions on the prostate glands that require further attention from clinicians for a more accurate diagnosis of PCa and its treatment planning.
Introduction
Multiparametric MRI (mpMRI) has been shown to be accurate for the diagnosis of clinically significant prostate cancer (csPCa) that requires treatment [1-3]. Previously, several studies determined the performance of mpMRI based on the tumor size, Gleason score (GS), index, etc. [4], compared with whole-mount histopathology (WMHP) as an ideal reference standard for correlating individual prostate lesions to mpMRI. Sector map is a canonical model of the prostate, consisting of forty-one sectors, to enable clinicians to easily localize MRI findings [5-6], described by the PI-RADS v2 [7]. The purpose of this study is to illustrate the sector-based performance of mpMRI for PCa detection as a form of spatially localized probabilities to provide a useful roadmap for mpMRI-based PCa diagnosis and prognosis. In particular, we investigate the distribution of false-negative (FN) mpMRI findings for csPCa and index lesions on the per sector basis to provide a visual aide for clinicians, drawing their attention to the areas where the probability of FN csPCa and index lesions is higher.Method
This HIPAA compliant study was approved by the review board of our local institute. A total of 776 consecutive men underwent 3T mpMRI prior to radical prostatectomy at a single institution between 2010 and 2020. 3T mpMRI was compared with thin-section WMHP prepared by experienced genitourinary (GU) pathologists. Patient-specific 3D-printed molds were used to section prostate specimens in the axial plane in 5-mm steps from the base to the apex perpendicular to the urethral plane to approximate the acquired imaging plane. The GU pathologists delineated all PCa lesions, where the largest diameter, location, and primary and secondary GS of each lesion were recorded.GU radiologists and pathologists re-reviewed each previously detected and graded lesion on WMHP and 3T mpMRI and collectively determined concordance in the monthly match meetings. A lesion that appeared on mpMRI was labeled as a true positive (TP) if it presents on the WMHP, and its sectors were recorded based on the appearance on mpMRI. If PCa lesions shown on WMHP were not detected on mpMRI, they were classified as FN lesions, and their sectors were assigned based on their appearance on WMHP. The mpMRI lesions were categorized as false positives (FP) if there is no corresponding lesion on WMHP. Clinically significant PCa was defined as a lesion with a GS of 7 or greater [8]. The index lesion was defined as the PCa lesion with the highest GS or the largest size or both.
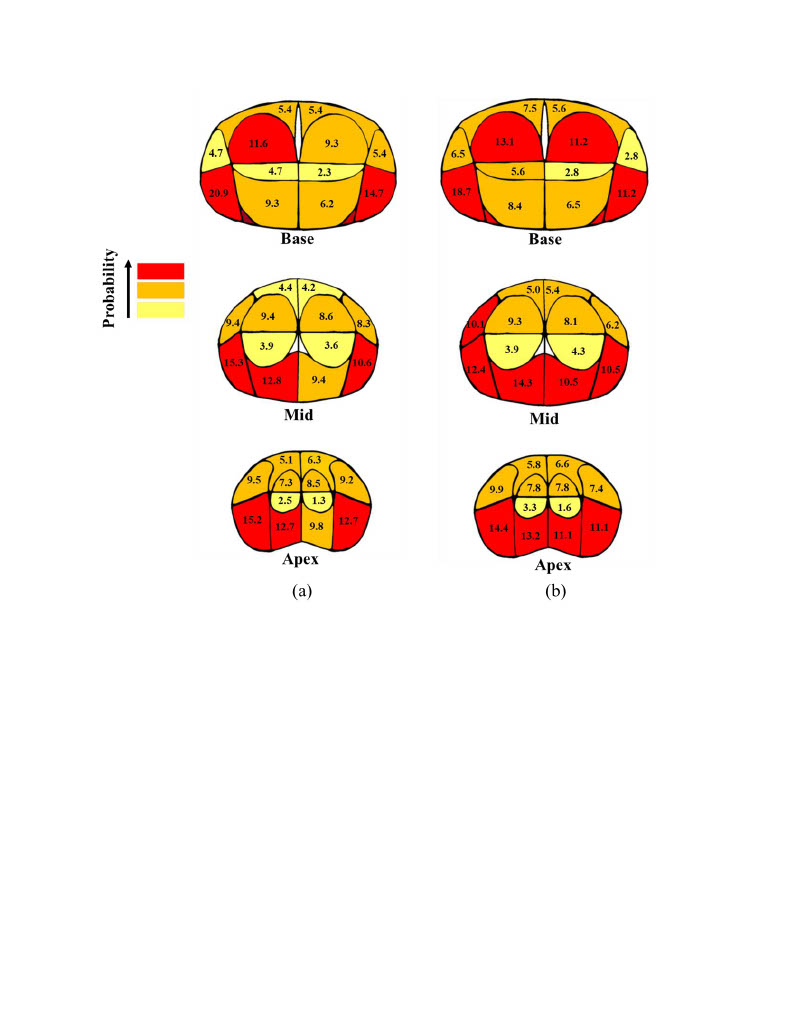
To calculate spatial probability, the number of TP, FP, and FN lesions in each region of the sector map was counted and divided by the total number of PCa lesions at the corresponding level. To illustrate the probability on the sector map, three different colors, including red, orange, and yellow, were used to display probability values of larger than 10%, less than 10% and larger than 5%, and less than 5%, respectively.
Results
In 776 patients, there existed 1,465 PCa lesions at WMHP including TP and FN lesions, and of 1,465 PCa lesions, the detection rate of overall PCa lesions was 52% including 72% of the csPCa tumors and 78% of the index lesions. Table 1 summarizes both the patient and lesion characteristics of the TP and FN tumors on mpMRI. 76% of FN tumors were small (tumor diameter of < 1.5 cm). At all anatomical levels, most FN csPCa and index lesions were located at the left posterior of peripheral zone (PZ). Figure 1 shows the spatial probability map for FN csPCa and index lesions. On multivariate analysis, the majority of FN large (tumor diameter of > 1 cm), clinically significant, index lesions with PSA>4 was in the posterior of PZ.Conclusion and Discussion
We characterized the spatial localization of the PCa detection on mpMRI in terms of spatial probability corresponding to the sector map. Compared to previous works on population spatial probability maps [4-6], using a sector map is easier for data management/processing and directly relates to PI-RADS v2 reporting guidelines. The spatial probability map of FNs may improve the diagnosis of PCa using mpMRI as it highlights the areas with the highest probability of undiagnosed tumors, where a careful review of the image by clinicians is required to assure of the subject being cancer-free. Also, the results may reduce the need for systematic prostate biopsy as it helps obtain samples from areas with the highest probability of PCa lesion existence instead of removing samples from random areas of the prostate gland. The outcomes facilitate the characterization of disease appearance relative to anatomic levels and zones, which in turn may obviate the necessity of MR-based prostate atlas. Moreover, incorporating our results into the computer-aided diagnosis tools designed for automated detection of PCa is important, may lead to better performance as prior information and hints given to the learner is a substantial ingredient to obtain a good generalization error [9-10].Our localization scheme showed that using 3T mpMRI csPCa tumors in the left posterior part of PZ at the mid and apex levels were mostly missed with a total probability of 23%. Overall, mpMRI performance for sectoral localization of csPCa and index lesions was moderate in the posterior of PZ.
Acknowledgements
This work was supported in part by the National Institutes of Health R01-CA248506 and funds from the Integrated Diagnostics Program, Departments of Radiological Sciences and Pathology, David Geffen School of Medicine, UCLA. FZ would like to thank Heather Wilber at UCLA for her help with creating figures.References
[1] Futterer JJ, Briganti A, De Visschere P, et al. Can Clinically Significant Prostate Cancer Be Detected with Multiparametric Magnetic Resonance Imaging? A Systematic Review of the Literature. Eur Urol. 2015;68:1045–1053.
[2] Chamie K, Sonn GA, Finley DS, et al. The role of magnetic resonance imaging in delineating clinically significant prostate cancer. Urology. 2014;83:369–375.
[3] Lee DH, Koo KC, Lee SH, et al. Low-risk prostate cancer patients without visible tumor (T1c) on multiparametric MRI could qualify for active surveillance candidate even if they did not meet inclusion criteria of active surveillance protocol. Jpn J Clin Oncol. 2013;43:553–558.
[4] Johnson D, Raman SS, Afshari Mirak S, et al. Detection of Individual Prostate Cancer Foci via Multiparametric Magnetic Resonance Imaging. Eur Urol. 2019;75:712– 720.
[5] Wibulpolprasert P., Raman SS, Hsu W et al. Detection and Localization of Prostate Cancer at 3-T Multiparametric MRI Using PI-RADS Segmentation. AJR. 2019;212(6): W1-W10.
[6] Wibulpolprasert P. Raman SS, Hsu W et al. Influence of the Location and Zone of Tumor in Prostate Cancer Detection and Localization on 3-T Multiparametric MRI Based on PI-RADS Version 2. AJR. 2020;214(5):1101-1111.
[7] PI-RADS, Prostate Imaging – Reporting and Data System 2019, Version 2.1. https://www.acr.org/Clinical-Resources/Reporting-and-Data-Systems/PI-RADS. Accessed November 8,2021.
[8] Seo JW, Shin SJ, Taik Oh Y, et al. PI-RADS Version 2: Detection of Clinically Significant Cancer in Patients with Biopsy Gleason Score 6 Prostate Cancer. AJR Am J Roentgenol. 2017;209(1):W1-W9.
[9] Tom M. Mitchell. The Need for Biases in Learning Generalizations. Department of Computer Science, Laboratory for Computer Science Research, Rutgers Univ., 1980.
[10] Gulcehre C. and Bengio Y. Knowledge Matters: Importance of Prior Information for Optimization. Journal of Machine Learning Research. 2016; 17:1-32.
Figures