4990
Noise-Fill Interpolation Improves Statistical Power of Lesion Detection in Voxel-Wise Analyses1Gruss Magnetic Resonance Research Center, Department of Radiology, Albert Einstein Colledge of Medicine, Bronx, NY, United States, 2Biomedical Engineering and Imaging Institute, Department of Radiology, Mount Sinai Medical Center, New York, NY, United States, 3Department of Neurological Sciences, Rush Medical College, Chicago, IL, United States
Synopsis
Image interpolation is inextricable in many image analysis steps including registration of low resolution images to a standard high resolution template. Interpolated images are often smoothed and their voxel intensities are not statistically independent which severely complicates subsequent statistical analysis at the group level. Difficult to account correlations lead to higher than expected false-positive rates. We propose a new, noise-fill, image interpolation method which avoids both spatial blurring and loss of statistical independence of the voxel intensities. We show that noise-fill interpolation improves sensitivity of lesion detection in simulated patient-specific voxel-wise cluster analyses compared to other typically used interpolation methods.
Introduction
Image interpolation is inextricable in many image analysis steps such as motion and eddy current correction, rigid body registration and registration of low resolution images to a standard high resolution template. Among the interpolation methods commonly used for analyses of MRI data are tri-linear interpolation, Gaussian, spline or trigonometric (also known as sinc) interpolation1. Their action can be expressed as a spatial convolution of the input image with some kernel1, attenuating high frequency components and blurring the image. In addition, voxel intensities in the interpolated image are not statistically independent, which severely complicates subsequent statistical analysis at the group level. The cost of the unaccounted spatial correlations is higher than expected false-positive rate2. Since presence of correlations is easier to detect than to account for2,3, the best course of action is to avoid them.We propose a new, noise-fill, image interpolation method which avoids both smoothing and loss of statistical independence of the voxel intensities. As implied by its name, interpolation is achieved by filling K-space to the desired spatial resolution with noise, at the level of that of the scanner hardware. We show that noise-fill interpolation improves sensitivity of lesion detection in simulated examples of patient-specific voxel-wise cluster analyses where fractional anisotropy (FA) derived from a low resolution brain diffusion scan of a patient is compared to those of a healthy cohort over a high resolution template using a voxel-wise t-test.
Methods
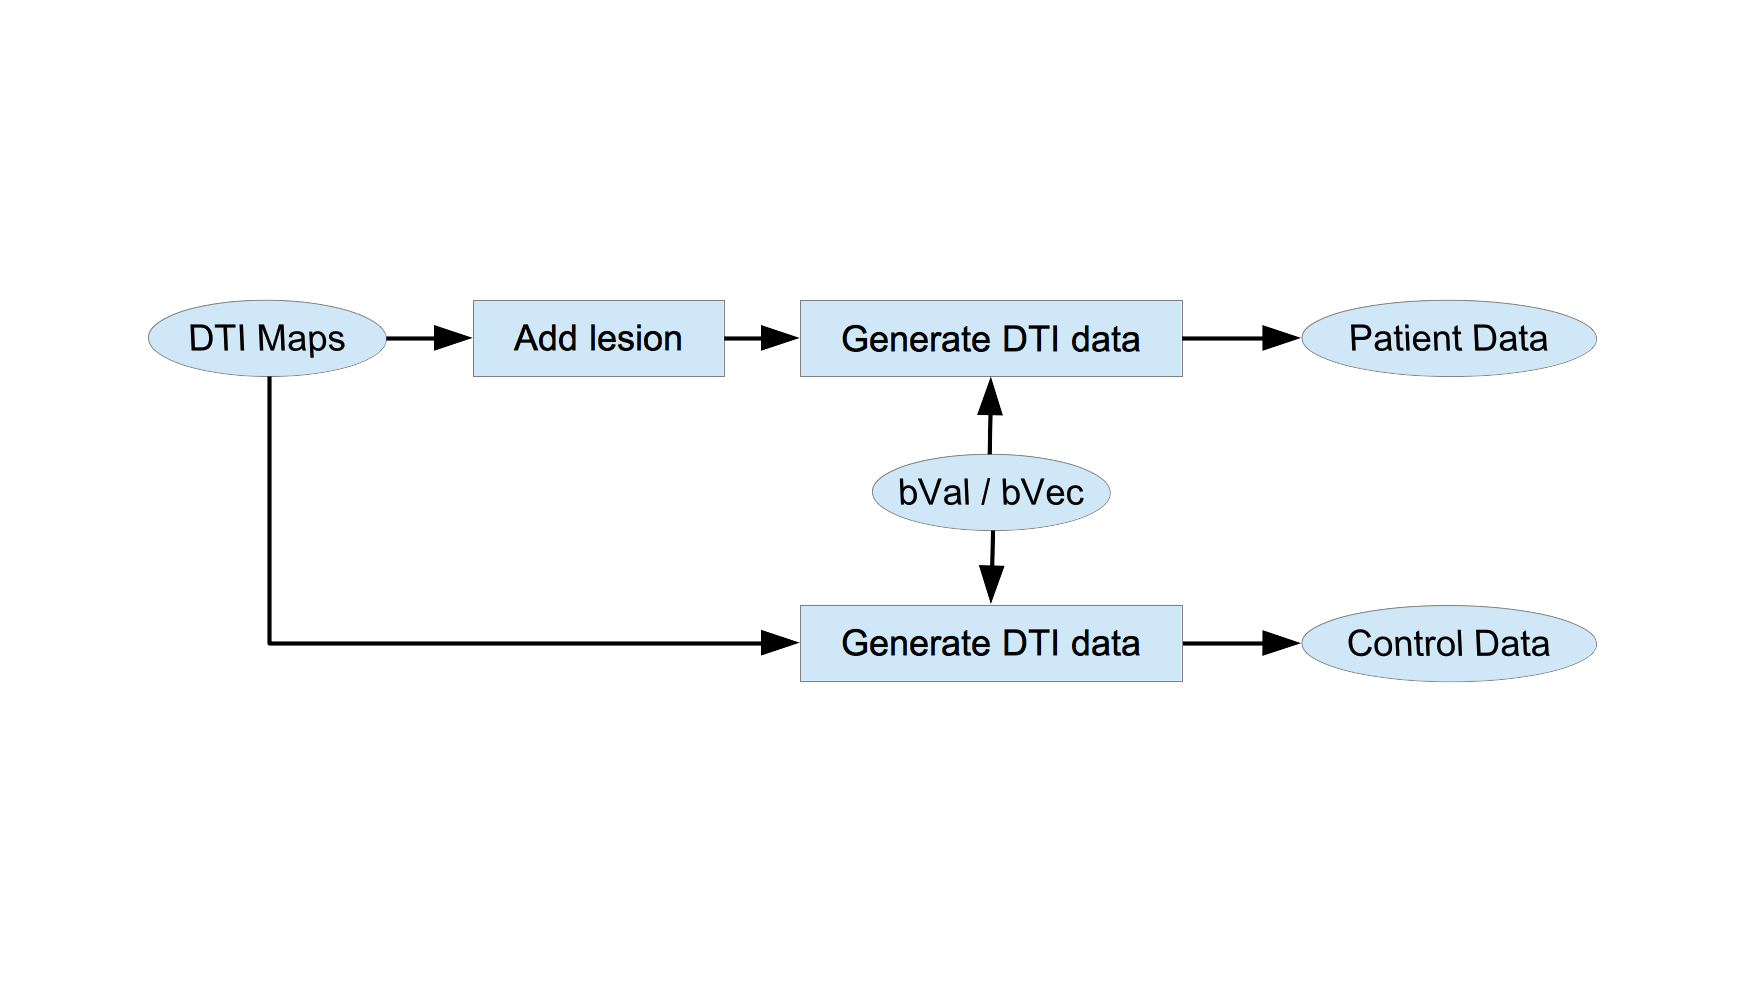
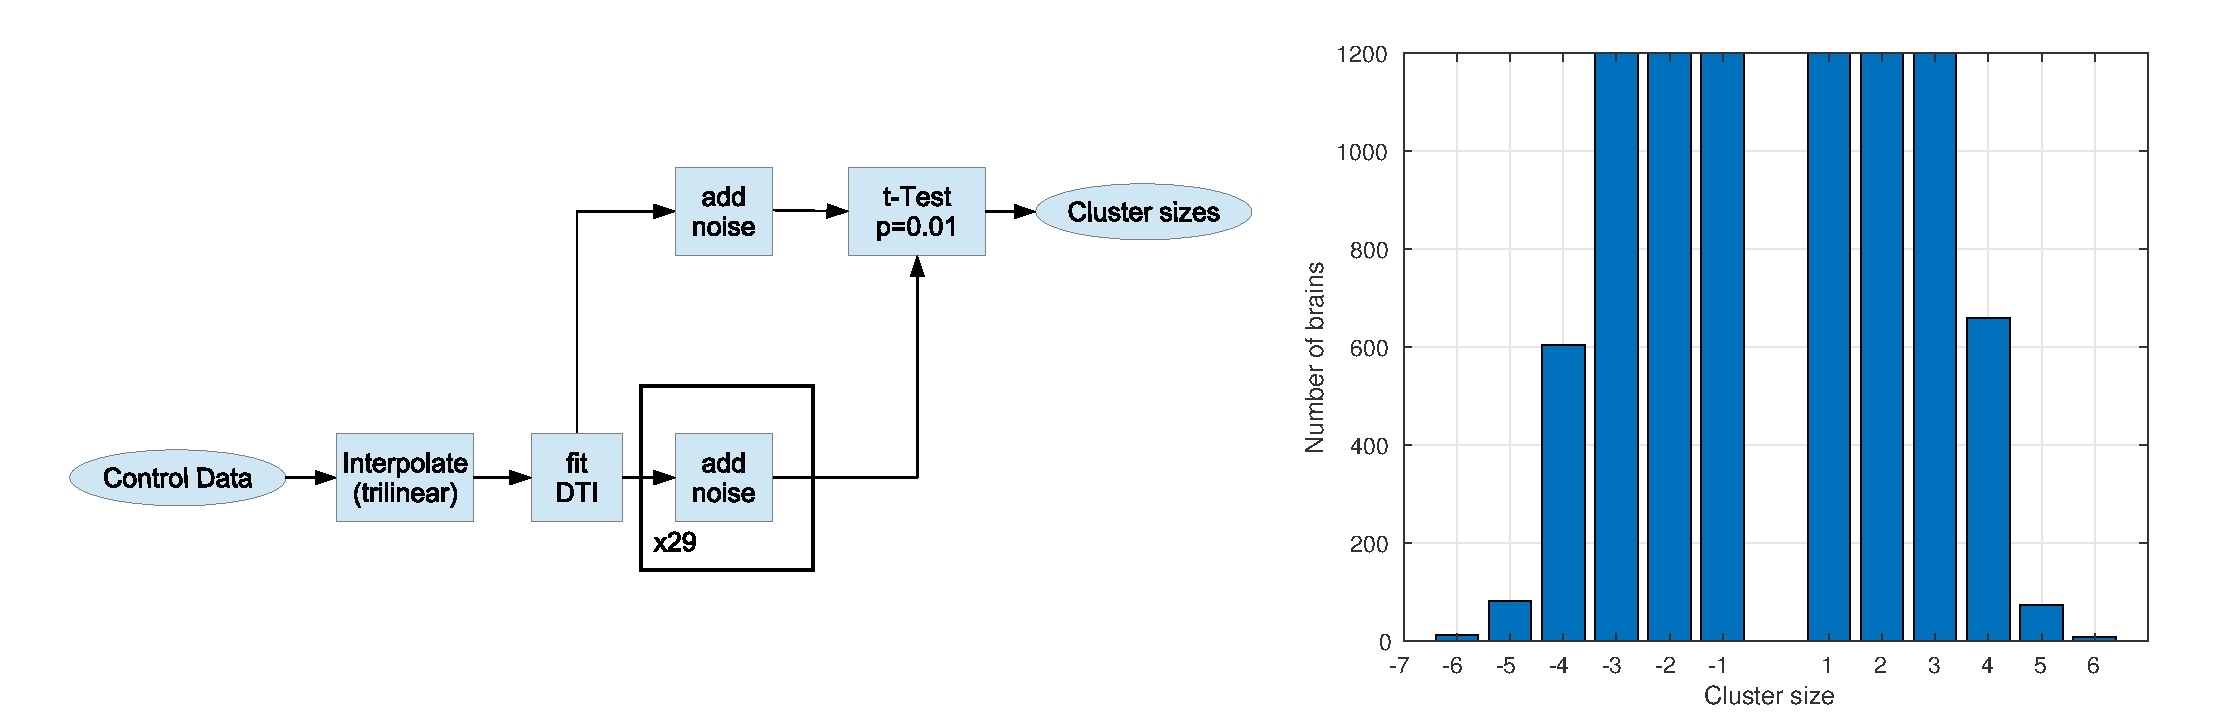
This study was approved by IRB and includes one diffusion data set from a healthy individual which was used as a seed for subsequent simulations. Imaging was performed using a 3.0T Philips Achieva TX scanner (Philips Medical Systems, Best, the Netherlands) utilizing its 32 channel head coil with the following protocol: TR/TE=10000/65msec, 32 diffusion directions, b-value=800sec/mm2, 2mm3 isotropic resolution, 128x128x70 matrix. DTI data was processed to produce maps of eigenvalues and eigenvectors to be used in the simulations4.Intact eigenvalues and eigenvectors were used to generate DTI data for controls according to the original b-value/b-vector configuration (Fig 1). Both minor eigenvalues were increased in a single voxel to create small low FA lesion (∆FA=-0.01) in the simulated patient DTI data (Fig 1). We emulate voxel-wise analysis of a patient against 29 controls over a 1mm3 isotropic resolution template (256x256x140 matrix) using t-test retaining voxels with p<0.01 (two-tailed). Performance of lesion detection was evaluated using receiver operating curve (ROC) by varying size threshold of low FA clusters. Lesion was considered detected when a low FA cluster survived size threshold anywhere in the brain. Null and alternative hypotheses were simulated 1200 times each. A separate simulation was performed to generate distribution of cluster sizes over the 1mm template in the absence of interpolation (Fig.2) to serve as the gold standard.
The most commonly used MRI image analysis pipeline involves tri-linear interpolation as illustrated in top panel of Fig 3. The same interpolation is often accompanied by 3mm blurring using Gaussian kernel5. An equivalent pipeline with the proposed noise-fill interpolation is produced by swapping interpolation and DTI fit steps (Fig 3, bottom). If noise level is set to zero, we obtain zero-fill interpolation.
Results
Figure 4 shows distribution of cluster sizes with and without lesions and corresponding ROC curves for four interpolation schemes, including proposed noise-fill interpolation.Discussion
Both noise-fill and zero-fill interpolations perform much better than tri-linear interpolation or tri-linear with blur. However, zero-fill enlarges lesion from 8mm3 to about 24 mm3, while noise-fill does not. In addition, cluster size distribution using noise-fill interpolation under the null hypothesis is identical to the gold standard (Figure 2) consistent with the absence of spatial correlations. Excellent lesion detection of the noise-fill method is in part due to the high simulated lesion contrast-to-noise ratio, CNR=20. Since CNR at the scanner level was identical in all simulations (before noise was added in noise-fill), we expect noise-fill interpolation to deliver superior performance at lower CNRs as well. Despite illustrated in the context of fractional anisotropy, noise-fill interpolation will improve sensitivity of voxel-wise analyses in other contexts such as fMRI or VBM where unaccounted spatial correlations cause higher than expected false-positive rates.Conclusion
Proposed noise-fill interpolation method improves sensitivity of voxel-wise analyses to detect small lesions. In addition, it emulates high resolution MRI scan and in fact is exactly equivalent to it when the object can be represented by a truncated Fourier series.Acknowledgements
Support for this research was provided in part by the National Institute on Aging, grant 5P01AG003949-34.
References
1. Lehmann T, Gönner C, Spitzer K. Survey: Interpolation Methods in Medical Image Processing. IEEE Trans. Med. Imag. 1999;18:1049
2. Eklund A, Nichols T, Knutsson H. Cluster Failure: Why fMRI Inferences for Spatial Extent Have Inflated False-Positive Rates. PNAS 2016;113:7900-7905.
3. Ledberg A, Akerman S, Roland P. Estimation of the Probabilities of 3D Clusters in Functional Brain Images. NeuroImage 1998;8:113-128.
4. Jenkinson M, Beckmann C, Behrens T, Woolrich M, Smith S. FSL., Neuroimage. 2012;62:782-90.
5. Ashburner J, Friston K. Voxel-Based Morphometry --- The Methods. NeuroImage 2000;11:805-821.
Figures