4988
Test-retest Repeatability of SIR-QMT Using Compressed SENSE1Translational Neuroscience, Barrow Neurological Institute, Phoenix, AZ, United States, 2Neurology, Barrow Neurological Institute, Phoenix, AZ, United States
Synopsis
Quantitative magnetization transfer (QMT) imaging using the selective inversion recovery (SIR) approach has been successful in estimating fundamental tissue parameters, such as the PSR (macromolecular-to-free proton pool size ratio) and the R1f (relaxation rate of the free pool). Although SIR allows one to perform the QMT experiment using conventional inversion recovery sequences, it is hampered by long scan times. Previously we have shown that Compressed SENSE (CS-SENSE) accelerates whole-brain SIR-QMT imaging, allowing whole-brain scanning within clinically practical scan times. In this study, we systematically investigate the effect of this acceleration on test-retest repeatability for PSR and R1f.
INTRODUCTION
Quantitative magnetization transfer (QMT) imaging using the selective inversion recovery (SIR) approach has been successful in estimating fundamental tissue parameters, such as the macromolecular-to-free proton pool size ratio (PSR) and the relaxation rate of the free pool (R1f)1-3, in which the PSR has been shown to relate closely with myelin content and disability in multiple sclerosis (MS)4-5. Although SIR allows one to perform the QMT experiment using conventional inversion recovery sequences, it is hampered by the long scan times. Despite significant progress in reducing acquisition times, including optimizing inversion (TI) and pre-delay (TD) times and parallel imaging6-8, a faster, reliable SIR protocol is still needed to accommodate whole-brain SIR-QMT imaging in clinical scenarios. We have recently shown that compressed sensitivity encoding (CS-SENSE) accelerates whole-brain SIR-QMT imaging, allowing for whole-brain scanning within clinically practical scan times9. In this study, we systematically investigate the effect of this acceleration on test-retest repeatability, which will allow us to determine the minimum change in the resulting PSR estimates needed to reliably detect a true biological change due to de/remyelination in future longitudinal studies.METHODS
MRI was performed on a Philips 3T Ingenia scanner with a 32-channel head coil (Philips Healthcare, Best, The Netherlands). Eight subjects (4/4 males/females, 32.3 ± 9.1 years old) underwent whole-brain SIR scans over two sessions with an interval between scans of ~2 weeks. The imaging parameters were: FOV = 210×210×90 mm3, resolution = 2.25×2.25×2.25 mm3, TE = 65ms, slices = 40, recon matrix size = 224×224, number of averages = 1. A CS-SENSE acceleration factor of 8 was selected as a trade-off between scan time and signal-to-noise ratio (SNR) as described previously9. After data acquisition, the two scan sessions of each subject were co-registered using Flirt (https://fsl.fmrib.ox.ac.uk/fsl/fslwiki/FLIRT), and nine regions of interests (ROIs) were drawn manually (see Fig. 1) on white matter (WM): corona radiata (cr), occipital WM (owm), frontal WM (fwm), genu corpus callosum (gcc), splenium corpus callosum (scc), and internal capsule (ic); as well as gray matter (GM): head of caudate (hc), thalamus (th), and putamen (pu). The test-retest repeatability on mean ROI PSR and R1f values were then evaluated using Bland-Altman plots and intraclass correlation coefficients (ICC). Finally, two relapse-remitting MS patients were scanned to evaluate the effect of CS-SENSE acceleration within focal lesions.RESULTS
The acquisition time for the 3D whole-brain SIR-QMT was approximately 6 minutes. Fig. 2 shows an example of the PSR and R1f maps. Note the high fidelity of both parametric maps, which were largely free of artifacts related to CS-SENSE acceleration and motion. Fig. 3 shows Bland-Altman plots of PSR and R1f across all ROIs, demonstrating negligible bias across scans (difference in PSR = 0.06% and R1f = -0.001 s-1 across all ROIs). The associated ICC values also indicated excellent reliability in both WM and GM. In WM regions, the ICC was 0.93 (95% confidence interval (CI): 0.88-0.96) for PSR and 0.90 (95% CI: 0.83-0.94) for R1f. In gray matter, ICC was 0.84 (95% CI: 0.66-0.93) for PSR and 0.98 (95% CI: 0.95-0.99) for R1f. Looking at individual ROIs, (Fig. 4), we did not observe significant difference across scans for any ROI or SIR parameter. Finally, the method showed excellent capability to detect focal decreases in PSR within MS lesions, as demonstrated in Fig. 5.DISCUSSION
In this study, we systematically investigated the test-retest repeatability in the SIR-qMT method with CS-CENSE acceleration, with a goal to demonstrate feasibility for clinical applications that require consistency across time to evaluate treatment response and/or disease progression. The results showed high test-retest repeatability of the parameter estimates with a CS-CENSE acceleration of 8. Future work will focus on applying this method in a larger cohort of patients longitudinally to evaluate de/remyelination over time.CONCLUSION
The results showed high test-retest repeatability of SIR-QMT with a CS-SENSE acceleration factor of 8, which allows an acquisition of 3D whole brain within ~6 minutes and is expected to greatly improve its feasibility for clinical applications.Acknowledgements
Barrow Neurological FoundationReferences
1. Gochberg D, Gore J. Quantitative Magnetization Transfer Imaging via Selective Inversion Recovery With Short Repetition Times. Magn Reson Med. 2009; 57(2): 437-441.
2. Dortch R, Gochberg D, Welch E, et al. Quantitative magnetization transfer imaging in human brain at 3T via selective inversion recovery. Magn Reson Med. 2011; 66(5): 1346-1352.
3. Dortch R, Moore J, Li K, et al. Quantitative magnetization transfer imaging of human brain at 7T. NeuroImage. 2013; 64: 640-649.
4. Granziera C, Wuerfel J, Barkhof F, et al. Quantitative magnetic resonance imaging towards clinical application in multiple sclerosis. Brain. 2021; 144(5): 1296-1311.
5. Bagnato F, Franco G, Ye F, et al. Selective inversion recovery quantitative magnetization transfer imaging: Toward a 3 T clinical application in multiple sclerosis. Mult Scler. 2020. 26(4): 457-467.
6. Cronin M, Xu J, Bagnato F, et al. Rapid whole-brain quantitative magnetization transfer imaging using 3D selective inversion recovery sequences. Magn Reson Imaging. 2020; 68: 66-74.
7. Li K, Zu Z, Xu J, et al. Optimized inversion recovery sequences for quantitative T1 and magnetization transfer imaging. Magn Reson Med. 2010; 64(2): 491-500.
8. Dortch R, Bagnato F, Gochberg D, et al. Optimization of selective inversion recovery magnetization transfer imaging for macromolecular content mapping in the human brain. Magn Reson Med. 2018; 80(5): 1824-1835.
9. Wang P, Sisco N, Dortch R. Rapid Whole-Brain Myelin Mapping via Selective Inversion Recovery and Compressed SENSE. ISMRM. 2021; 1287.
Figures

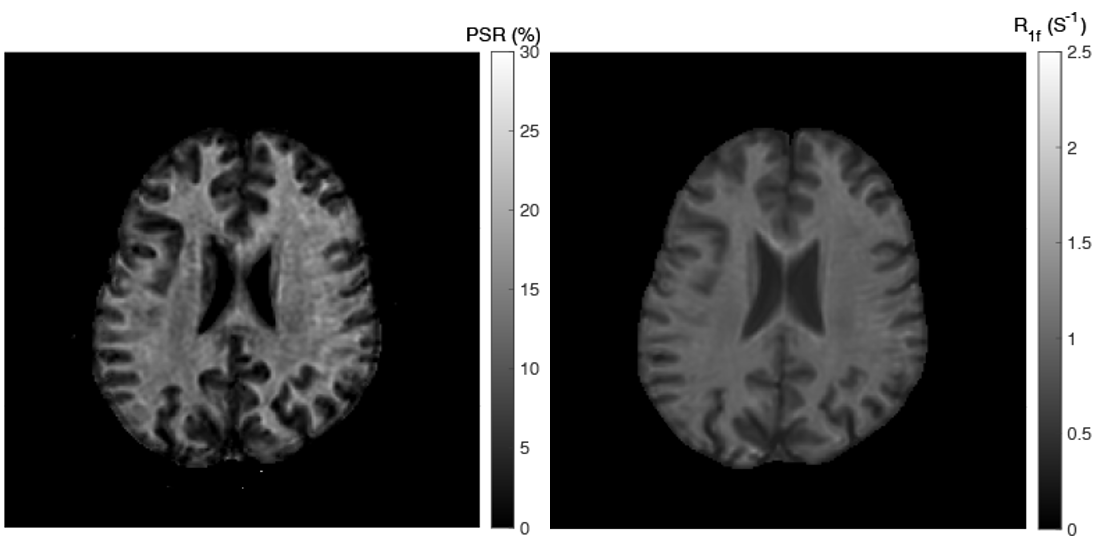

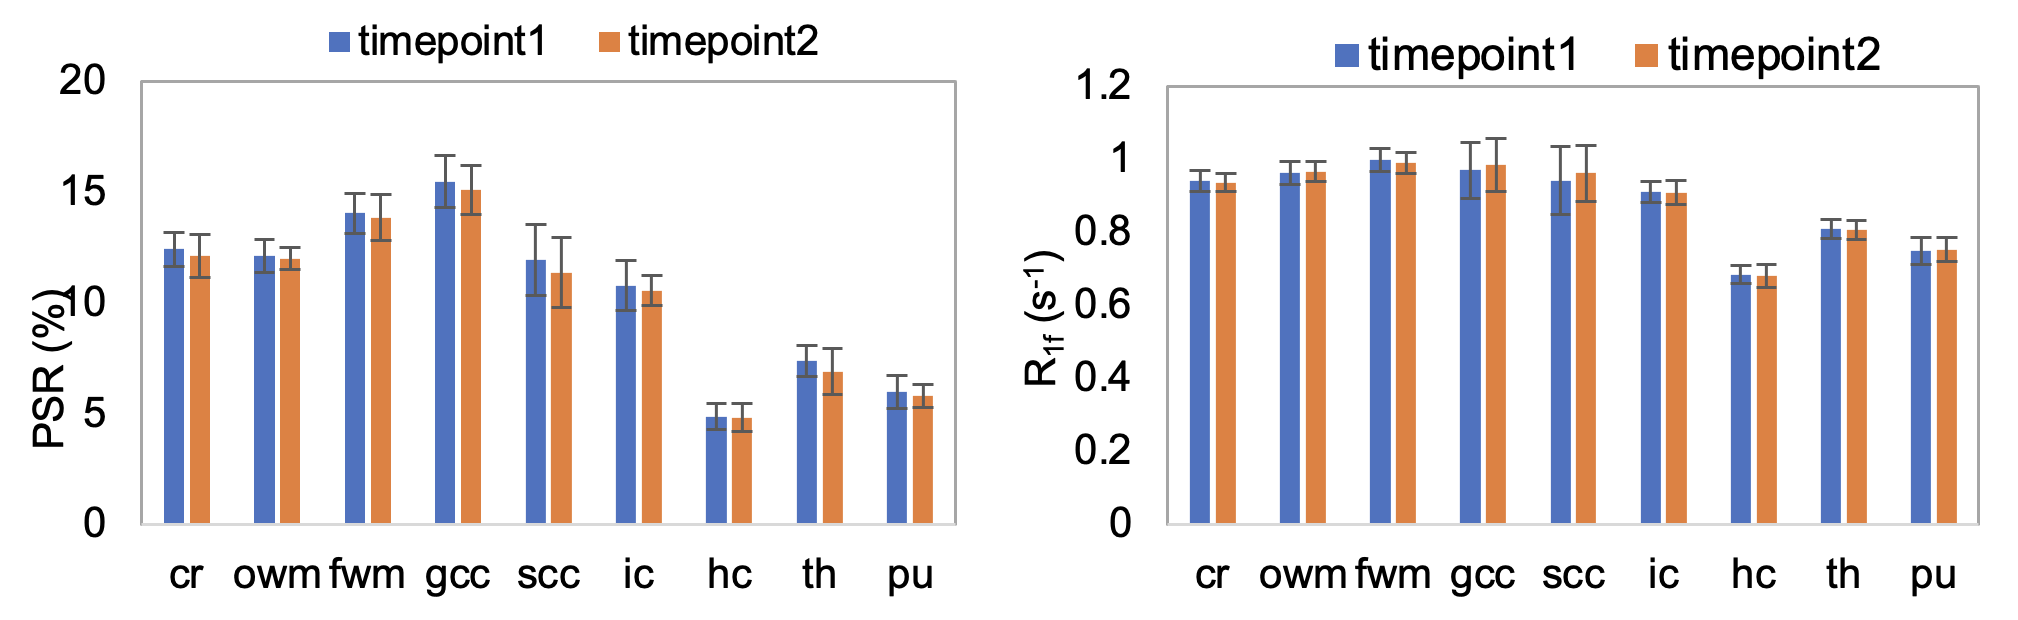
Fig. 4: Comparisons between the two timepoints in PSR (left) and R1f (right) values (mean ± SD) for each individual ROI.
Abbreviations: cr - corona radiate, owm - occipital WM, fwm - front WM, gcc – genu corpus callosum, scc - splenium corpus callosum, ic - internal capsule, hc - head of caudate, th - thalamus, pu - putamen.
