4987
Brain-behavior prediction using functional connectivity from older adults with mild cognitive impairment
Michelle Karker1,2, Douglas Noll1,2,3, Benjamin M. Hampstead4,5, and Scott Peltier1,2
1Biomedical Engineering, University of Michigan, Ann Arbor, MI, United States, 2Functional MRI Laboratory, University of Michigan, Ann Arbor, MI, United States, 3Radiology, University of Michigan, Ann Arbor, MI, United States, 4Mental Health Service, VA Ann Arbor Healthcare System, Ann Arbor, MI, United States, 5Research Program on Cognition and Neuromodulation Based Interventions, Psychiatry, University of Michigan, Ann Arbor, MI, United States
1Biomedical Engineering, University of Michigan, Ann Arbor, MI, United States, 2Functional MRI Laboratory, University of Michigan, Ann Arbor, MI, United States, 3Radiology, University of Michigan, Ann Arbor, MI, United States, 4Mental Health Service, VA Ann Arbor Healthcare System, Ann Arbor, MI, United States, 5Research Program on Cognition and Neuromodulation Based Interventions, Psychiatry, University of Michigan, Ann Arbor, MI, United States
Synopsis
Partial least squares regression with feature selection (PLS-BETA) was applied to task-based and resting-state connectivity data. Leveraging a MCI-relevant object-location or face-name task illuminates relationships with measures of total cognition (RBANStotal) and memory (RBANSdelayed). This provides support for the use of clinically-relevant tasks in cases where a “driven” connectivity network may elucidate pathological changes.
Introduction
Multiple analytical methods have attempted to relate functional connectivity to cognitive performance but few have been a) compared head to head, b) applied to patients across the continuum found within a clinical phenotype, or c) applied to both passive resting-state and an active task that may “stress” dysfunctional brain networks. Connectome predictive modeling (CPM) is one approach to relate functional brain network strength to behavior.1,2 An existing multivariate analysis technique, partial least squares (PLS) regression3 is an attractive approach for representing the interplay between behavioral changes and functional connectivity since it maximizes covariance between data and labels in its modeling approach.4,5In this work, we aim to leverage feature selection using regression coefficients (PLS-BETA)6,7,8 to fit PLS models to the brain-behavior relationship in subjects with mild cognitive impairment (MCI). Feature selection serves to reduce variability introduced by large numbers of small coefficients. The clinical phenotype of MCI varies from relatively mildly impaired to those who are nearly indistinguishable from dementia. Thus, the range of cognitive abilities demonstrated by this group provides a unique testing ground for predictive techniques.
Methods
Task and resting-state fMRI data were acquired for 84 older adults with amnestic MCI with a presumed AD etiology; demographics are summarized in Table I. Subject inclusion criteria included: adults age 50+, right-handed, official diagnosis of MCI, stable on all medications for at least 4 weeks prior to participation, English speaking (as the preferred language), and fMRI compatible. Subjects were excluded if they had any of the following: history of severe psychiatric conditions (bipolar disorder, schizophrenia, etc.), history of other neurological conditions (epilepsy, stroke, traumatic brain injury, etc.), sensory impairments that limit the ability to see or hear, or history of (or current) drug or alcohol use/dependence. Data were acquired using multiband EPI on a 3T MR750 GE scanner with TR (ms): 900 resting/1200 task, TE (ms): 30, FOV (mm): 240 resting/220 task, and resolution (mm): 3.24 x 3.24 x 3 resting, 2.5 x 2.5 x 2.5 task. The face-name fMRI task and object-location fMRI task were chosen as they are relevant to memory deficits observed in amnestic MCI, and were performed as published.9,10 Cognitive measures of interest included the Repeatable Battery for the Assessment of Neuropsychological Status (RBANS) delayed memory index scores (referred to hereafter as RBANSdelayed), and the RBANS total index scores (referred to hereafter as RBANStotal). For each of the two RBANS metrics, raw index scores were summed to create the final metric.PLS regression was implemented in MATLAB using a leave-one-out cross validation framework with nested age regression of both functional connectivity and cognitive measures, and permutation testing (1000 iterations) to evaluate significance. A feature mask composed of the 300 largest magnitude PLS regression weights was applied to data to train and test the final model (PLS-BETA). The number of components for each PLS model was determined by grid search, selecting the number of components yielding maximum Pearson’s correlation between predicted and actual behavior.
Significant model connections were visualized with the Yale BioImage Suite Connectivity Viewer (bioimagesuiteweb.github.io/webapp/) to display important nodes (defined by degree of connectedness, thresholded to look at significant connections from the top 5 nodes). Labels for MNI coordinates of high degree nodes were obtained by WFU PickAtlas11,12 using both Talairach Atlas labels13,14 and Automated Anatomical Labeling atlas labels.15
Results
PLS-BETA predicted cognitive performance for both task fMRI datasets (Figures 1-3). For object-location task data, a significant relationship was identified for RBANStotal (R=0.44, p≤0.001). For face-name task data, significant relationships were identified for RBANStotal (R=0.55, p≤0.001) and RBANSdelayed (R=0.37, p≤0.001). Resting-state data did not yield significant positive relationships with these cognitive metrics using PLS-BETA methods. The top 5 highest degree nodes for each result and corresponding labels are summarized in Table II. High degree nodes occurred in the superior frontal gyrus, superior temporal gyrus, precuneus, and inferior parietal lobule.Discussion
This work demonstrates that memory and global cognition performance (RBANStotal, RBANSdelayed) are well predicted by independent stimuli (face-name and object-location tasks) and that PLS-BETA is a viable technique for modeling the brain-behavior relationship.PLS-BETA is able to identify clinically-relevant areas involved in MCI, such as the superior frontal gyrus, superior temporal gyrus, inferior parietal lobule, and precuneus. High degree nodes located in the frontal and parietal regions may be indicative of compensatory-related increased activity in these regions in those with MCI.16,17,18 The inferior parietal lobule, involved in the default mode network, tends to exhibit increased functional connectivity in those with amnestic MCI.19
The current method can benefit from parameter tuning to ensure that the optimal number of features are selected. As PLS is a linear process, future work will examine nonlinear approaches to dimensionality reduction for this context.
Acknowledgements
This work was partially supported by the VA Merit Review Research Award 1I01RX001534-01, the University of Michigan Precision Health Investigators Award, and the NIH/NIA funded Michigan Alzheimer’s Disease Center (P30AG053760 and P30AG072931).References
- Finn, ES, et al. (2015). Functional connectome fingerprinting: identifying individuals using patterns of brain connectivity. Nature neuroscience, 18(11), 1664-1671.
- Shen, X, et al. (2017). Using connectome-based predictive modeling to predict individual behavior from brain connectivity. nature protocols, 12(3), 506-518.
- Krishnan, A, et al. (2011). Partial Least Squares (PLS) methods for neuroimaging: a tutorial and review. Neuroimage, 56(2), 455-475.
- Meskaldji, DE, et al. (2016). Prediction of long-term memory scores in MCI based on resting-state fMRI. NeuroImage: Clinical, 12, 785-795.
- Jiang, R, et al. (2020). Task-induced brain connectivity promotes the detection of individual differences in brain-behavior relationships. NeuroImage, 207, 116370.
- Chong, IG, et al. (2005). Performance of some variable selection methods when multicollinearity is present. Chemometrics and intelligent laboratory systems, 78(1-2), 103-112.
- Palermo, G, et al. (2009). Performance of PLS regression coefficients in selecting variables for each response of a multivariate PLS for omics-type data. Advances and applications in bioinformatics and chemistry, 2, 57.
- Mehmood, T, et al. (2012). A review of variable selection methods in partial least squares regression. Chemometrics and Intelligent Laboratory Systems, 118, 62-69.
- Hampstead, BM, et al. (2011a). Activation and effective connectivity changes following explicit-memory training for face–name pairs in patients with mild cognitive impairment: a pilot study. Neurorehabilitation and neural repair, 25(3), 210-222.
- Hampstead, BM, et al. (2011b). Where did I put that? Patients with amnestic mild cognitive impairment demonstrate widespread reductions in activity during the encoding of ecologically relevant object-location associations. Neuropsychologia, 49(9), 2349-2361.
- Maldjian, JA, et al. (2003). An Automated Method for Neuroanatomic and Cytoarchitectonic Atlas-based Interrogation of fMRI Data Sets. NeuroImage, 19, 1233-1239.
- Maldjian JA, et al. (2004). Precentral Gyrus Discrepancy in Electronic Versions of the Talairach Atlas. Neuroimage, 21(1), 450-455.
- Lancaster JL, et al. (1997). The Talairach Daemon, a database server for Talairach Atlas Labels. NeuroImage, 5, S633.
- Lancaster JL, et al. (2000). Automated Talairach atlas labels for functional brain mapping. Hum Brain Mapp., 10, 120-131.
- Tzourio-Mazoyer N, et al. (2002). Automated anatomical labeling of activations in SPM using a macroscopic anatomical parcellation of the MNI MRI single-subject brain. Neuroimage, 15(1), 273-89.
- Rosano C, et al. (2005). Event-related functional magnetic resonance imaging investigation of executive control in very old individuals with mild cognitive impairment. Biol. Psychiatry., 57(7), 761-767.
- Gigi A, et al. (2010). Prefrontal Compensatory Mechanism May Enable Normal Semantic Memory Performance in Mild Cognitive Impairment (MCI). Journal of Neuroimaging, 20, 163-168.
- Heun R, et al. (2007). Mild cognitive impairment (MCI) and actual retrieval performance affect cerebral activation in the elderly. Neurobiol Aging, 28, 404-413.
- Qi Z, et al. (2010). Impairment and compensation coexist in amnestic MCI default mode network. Neuroimage, 50(1), 48-55.
Figures
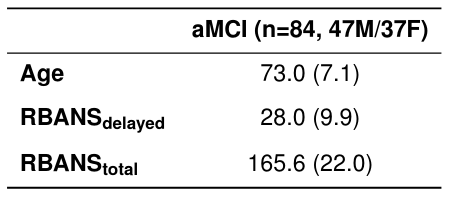
Table I. Demographic and neuropsychological performance means for aMCI group. Standard deviations in parentheses. RBANSdelayed and RBANStotal are computed as the sum of raw Repeatable Battery for the Assessment of Neuropsychological Status (RBANS) delayed memory index scores and the sum of raw RBANS index scores, respectively.

Figure 1. RBANStotal PLS-BETA results for object-location task data. A) Plot of predicted versus actual RBANStotal values. B) Circle plot of significant connections between brain areas (using node degree threshold of 14). C) Glass brain plot of significant nodes and connections.
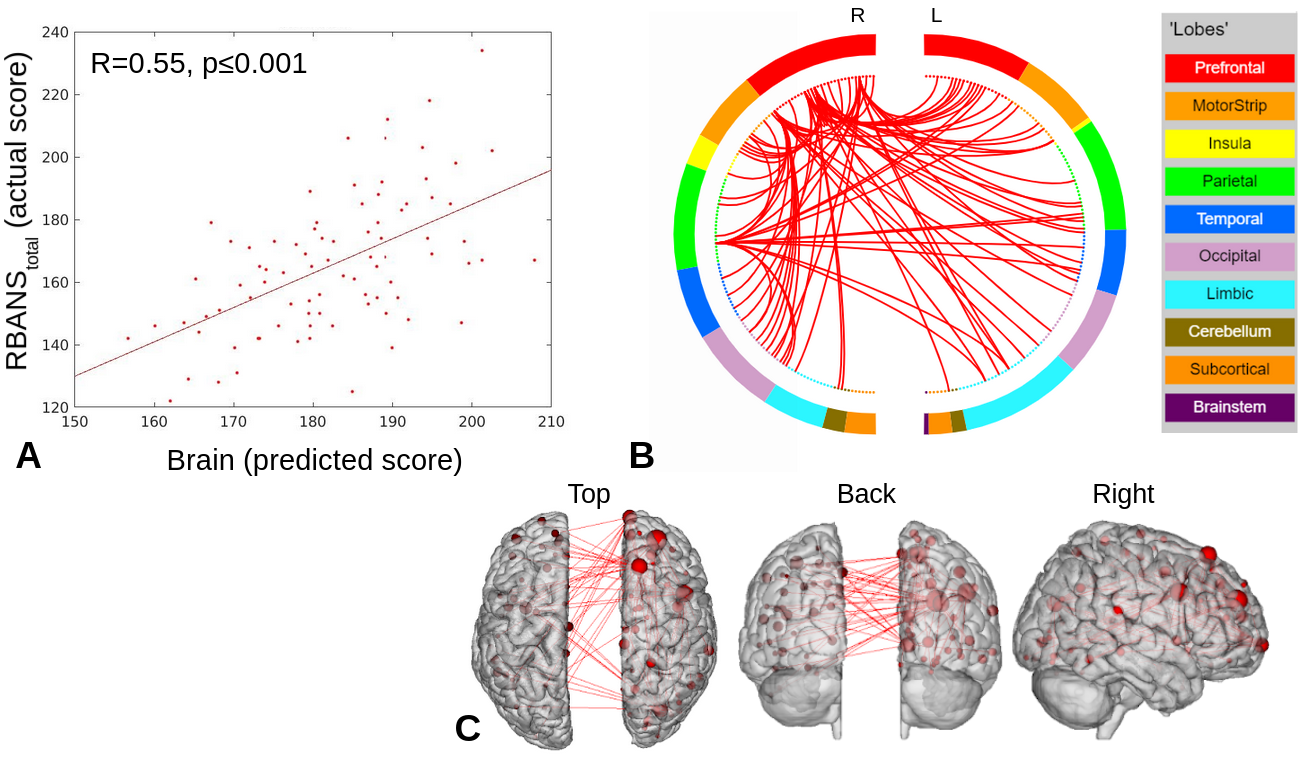
Figure 2. RBANStotal PLS-BETA results for face-name task data. A) Plot of predicted versus actual RBANStotal values. B) Circle plot of significant connections between brain areas (using node degree threshold of 15). C) Glass brain plot of significant nodes and connections.
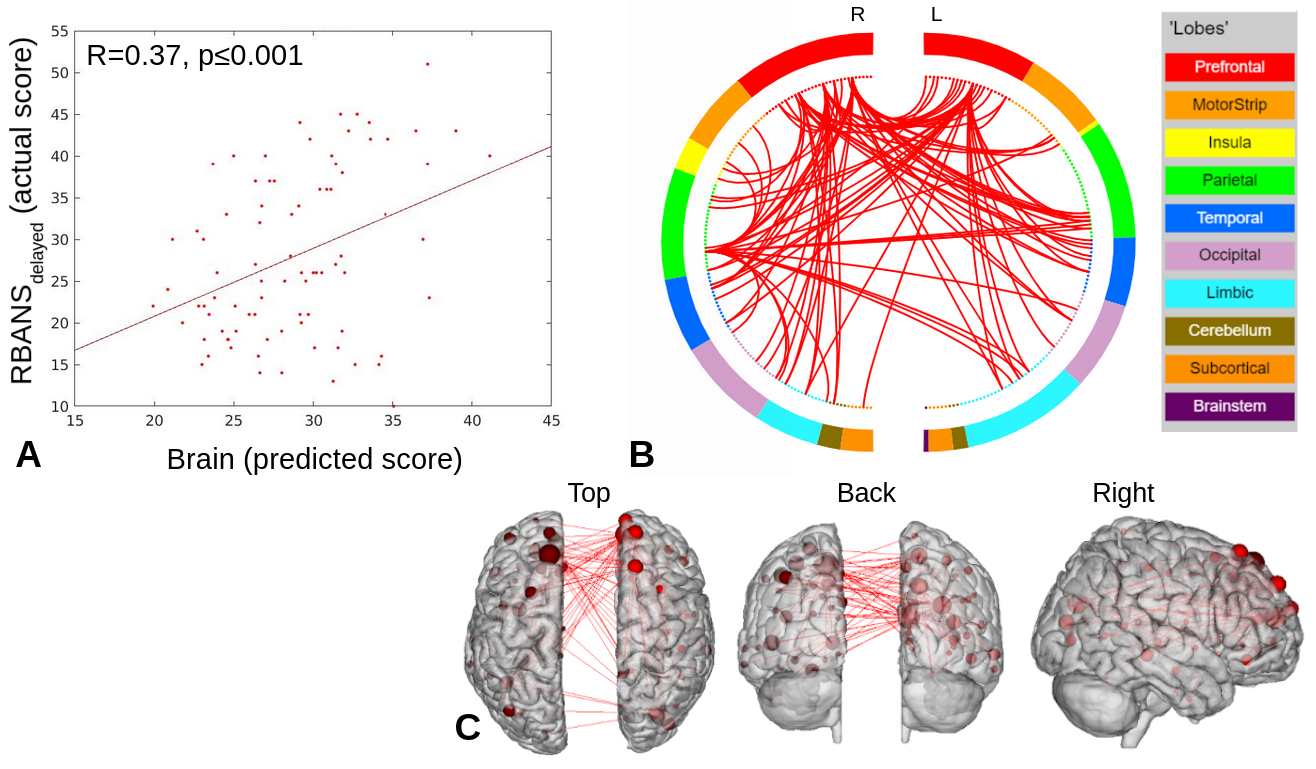
Figure 3. RBANSdelayed PLS-BETA results for face-name task data. A) Plot of predicted versus actual RBANSdelayed values. B) Circle plot of significant connections between brain areas (using node degree threshold of 18). C) Glass brain plot of significant nodes and connections.

Table II. Top 5 highest degree nodes for each data/measure result, with both Talairach Atlas labels and Automated Anatomical Labeling (AAL) atlas labels.
DOI: https://doi.org/10.58530/2022/4987