4985
Sample size considerations for structural covariance using T1-weighted brain imaging from the UK Biobank1Hurvitz Brain Sciences Program, Sunnybrook Research Institute, Toronto, ON, Canada, 2Department of Medical Biophysics, University of Toronto, Toronto, ON, Canada
Synopsis
Anatomical T1-weighted imaging allows us to examine relationships of regional morphology across the brain through structural covariance. Here, we investigated structural covariance stability using decreasing amounts of T1-weighted imaging data from the UK Biobank. Starting from 1,753 individuals, we found that it is possible to drastically reduce the sample and still maintain adequate stability (78% agreement with ~87 individuals). We note, however, that stability was regionally variable; lateral and cortical regions were least affected by sample size while medial and subcortical regions were most affected. These findings may inform sample size considerations for MRI-based structural covariance in large population studies.
Introduction
Structural covariance describes the phenomenon that certain morphological features (i.e., grey matter volume, cortical thickness) of structurally or functionally connected brain regions tend to fluctuate in synchrony throughout life.1 Across individuals, networks can be derived from structural covariance to study the brain throughout development,2 in relation to structural or functional connectivity,1 and in diseased states.3–5 The growing availability of MRI-based assessments (of which T1-weighted imaging is fundamental) in large population studies makes structural covariance an attractive multivariate analytic approach to study the brain. Although comparability and reliability of structural covariance have been studied,6 little is known regarding intra-dataset stability of structural covariance with sample size. Here, we used T1-weighted brain imaging data from 1,753 individuals in the UK Biobank to calculate and estimate structural covariance stability at sample sizes ranging from 5% of the full sample (~87 individuals) to 100% of the full sample. We then explored whether structural covariance stability varies across the brain in an organized fashion.Methods
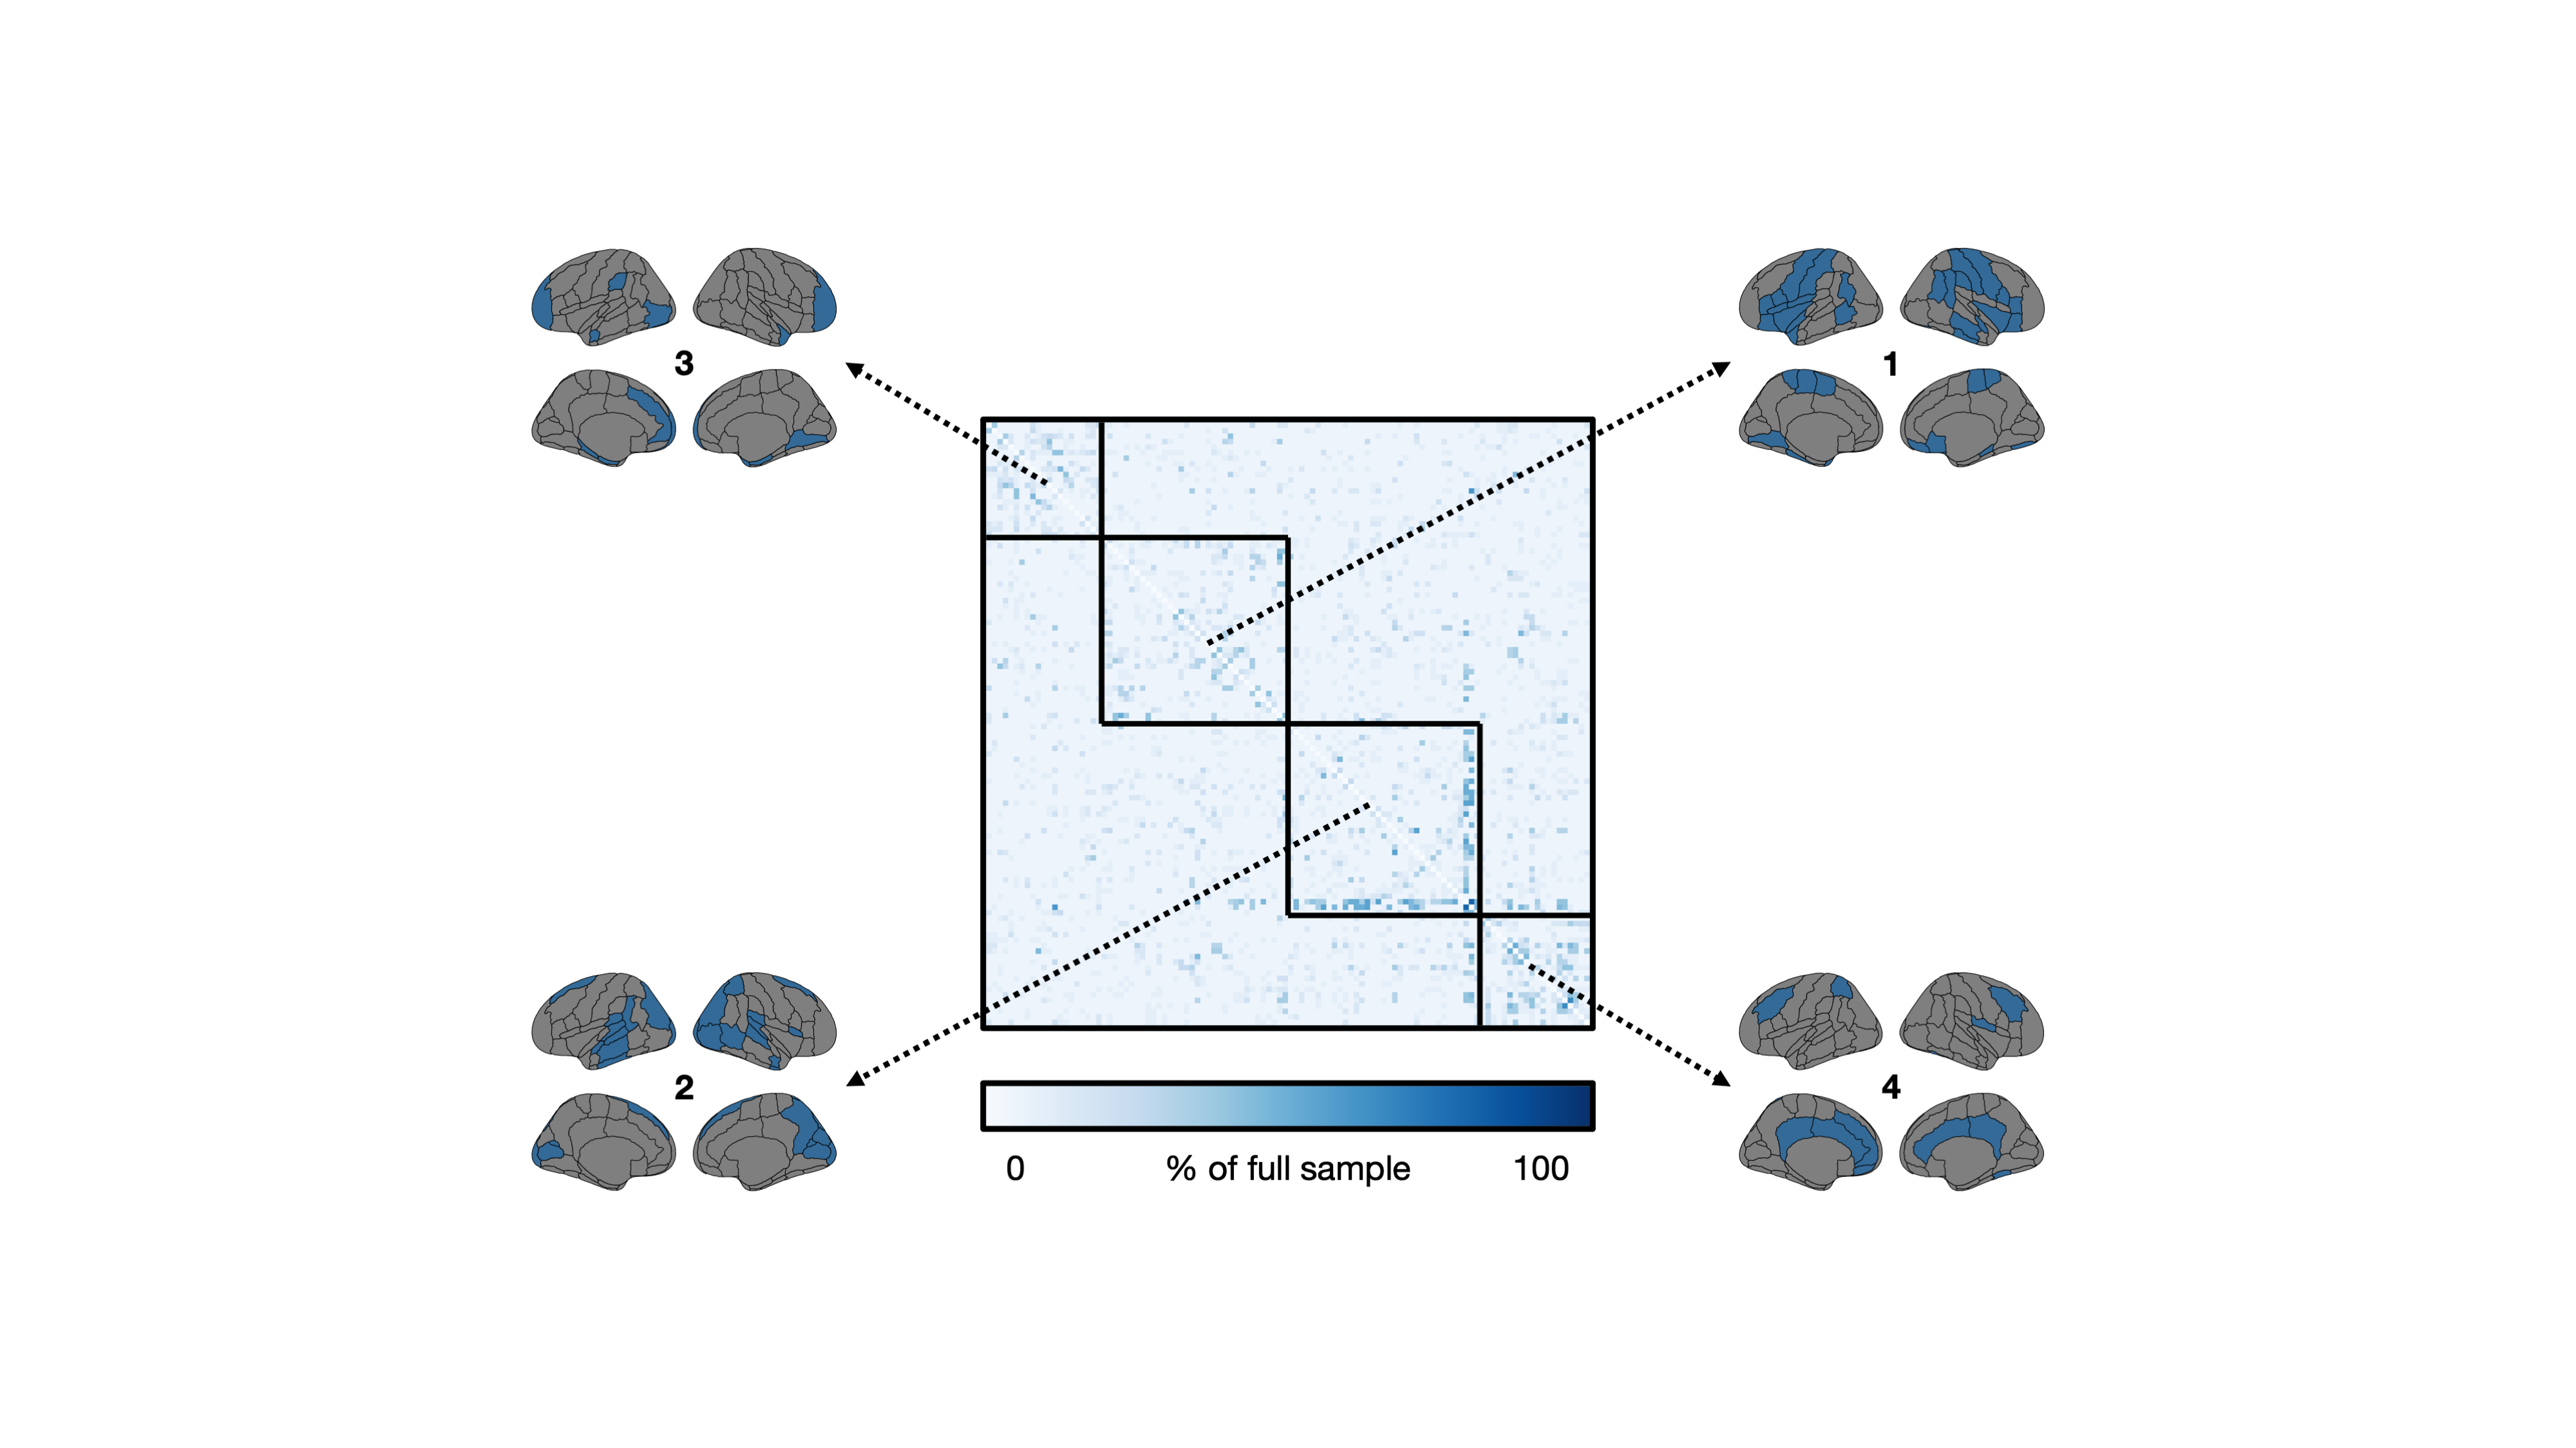
This study included 1,753 participants from the UK Biobank that underwent T1-weighted brain imaging using a Siemens 3 Tesla MRI system (TR/TE/TI = 2000/2/880 ms, spatial resolution = 1 mm3, FOV = 256 mm, scan duration = 4:54 min:s) at three sites.7,8 Using FSL tools,9 grey matter volume was extracted from 110 regions (96 cortical, 14 subcortical) as defined by the Harvard-Oxford atlases. The following steps were taken to produce structural covariance matrices. First, regional measures of grey matter volume were regressed for effects from several covariates including age, sex, body mass index, white matter hyperintensity volume, and intracranial volume. Pearson’s correlation coefficient was then used to quantify pairwise covariance from residuals, resulting in a 110 × 110 matrix. Diagonal matrix elements, representing self-connections, were excluded. We tested the stability of this procedure with decreasing sample size (5% to 100% of the full sample, increments of 5%, totalling 20 sample size increments). At each sample size increment, 2,000 structural covariance matrices were bootstrapped by sampling from the full sample with replacement. Note that sampling 100% of the full sample with replacement does not necessarily result in the same sample. For each matrix element, we compared the distribution from the 100% sample size case with distributions from smaller proportions (beginning with the 95% sample size case and moving downwards) using independent samples t-tests at an uncorrected significance level of p < 0.05. Note that we purposefully avoided a correction for multiple comparisons as this would jeopardize our false negative rate. The smallest sample size, in percentage, at which the two distributions did not differ was stored in a 110 × 110 threshold matrix. Finally, we performed consensus clustering on the threshold matrix to explore communities of brain regions with similar degrees of stability. Briefly, 1,000 iterations of the Louvain community detection algorithm were applied to the threshold matrix.10 Across all iterations, we calculated the probability that brain region pairs were consistently assigned to the same community, yielding a 110 × 110 agreement matrix, which was thresholded at 0.5.11 We then performed consensus clustering on the agreement matrix through 1,000 iterations of the Louvain algorithm, yielding a single consensus partition.12 We then calculated the mean threshold sample size within each module by averaging over the relevant threshold matrix elements (i.e., if the ith, jth, and kth regions constituted one module, we averaged over the (i, j), (i, k), and (j, k) elements in the threshold matrix).Results
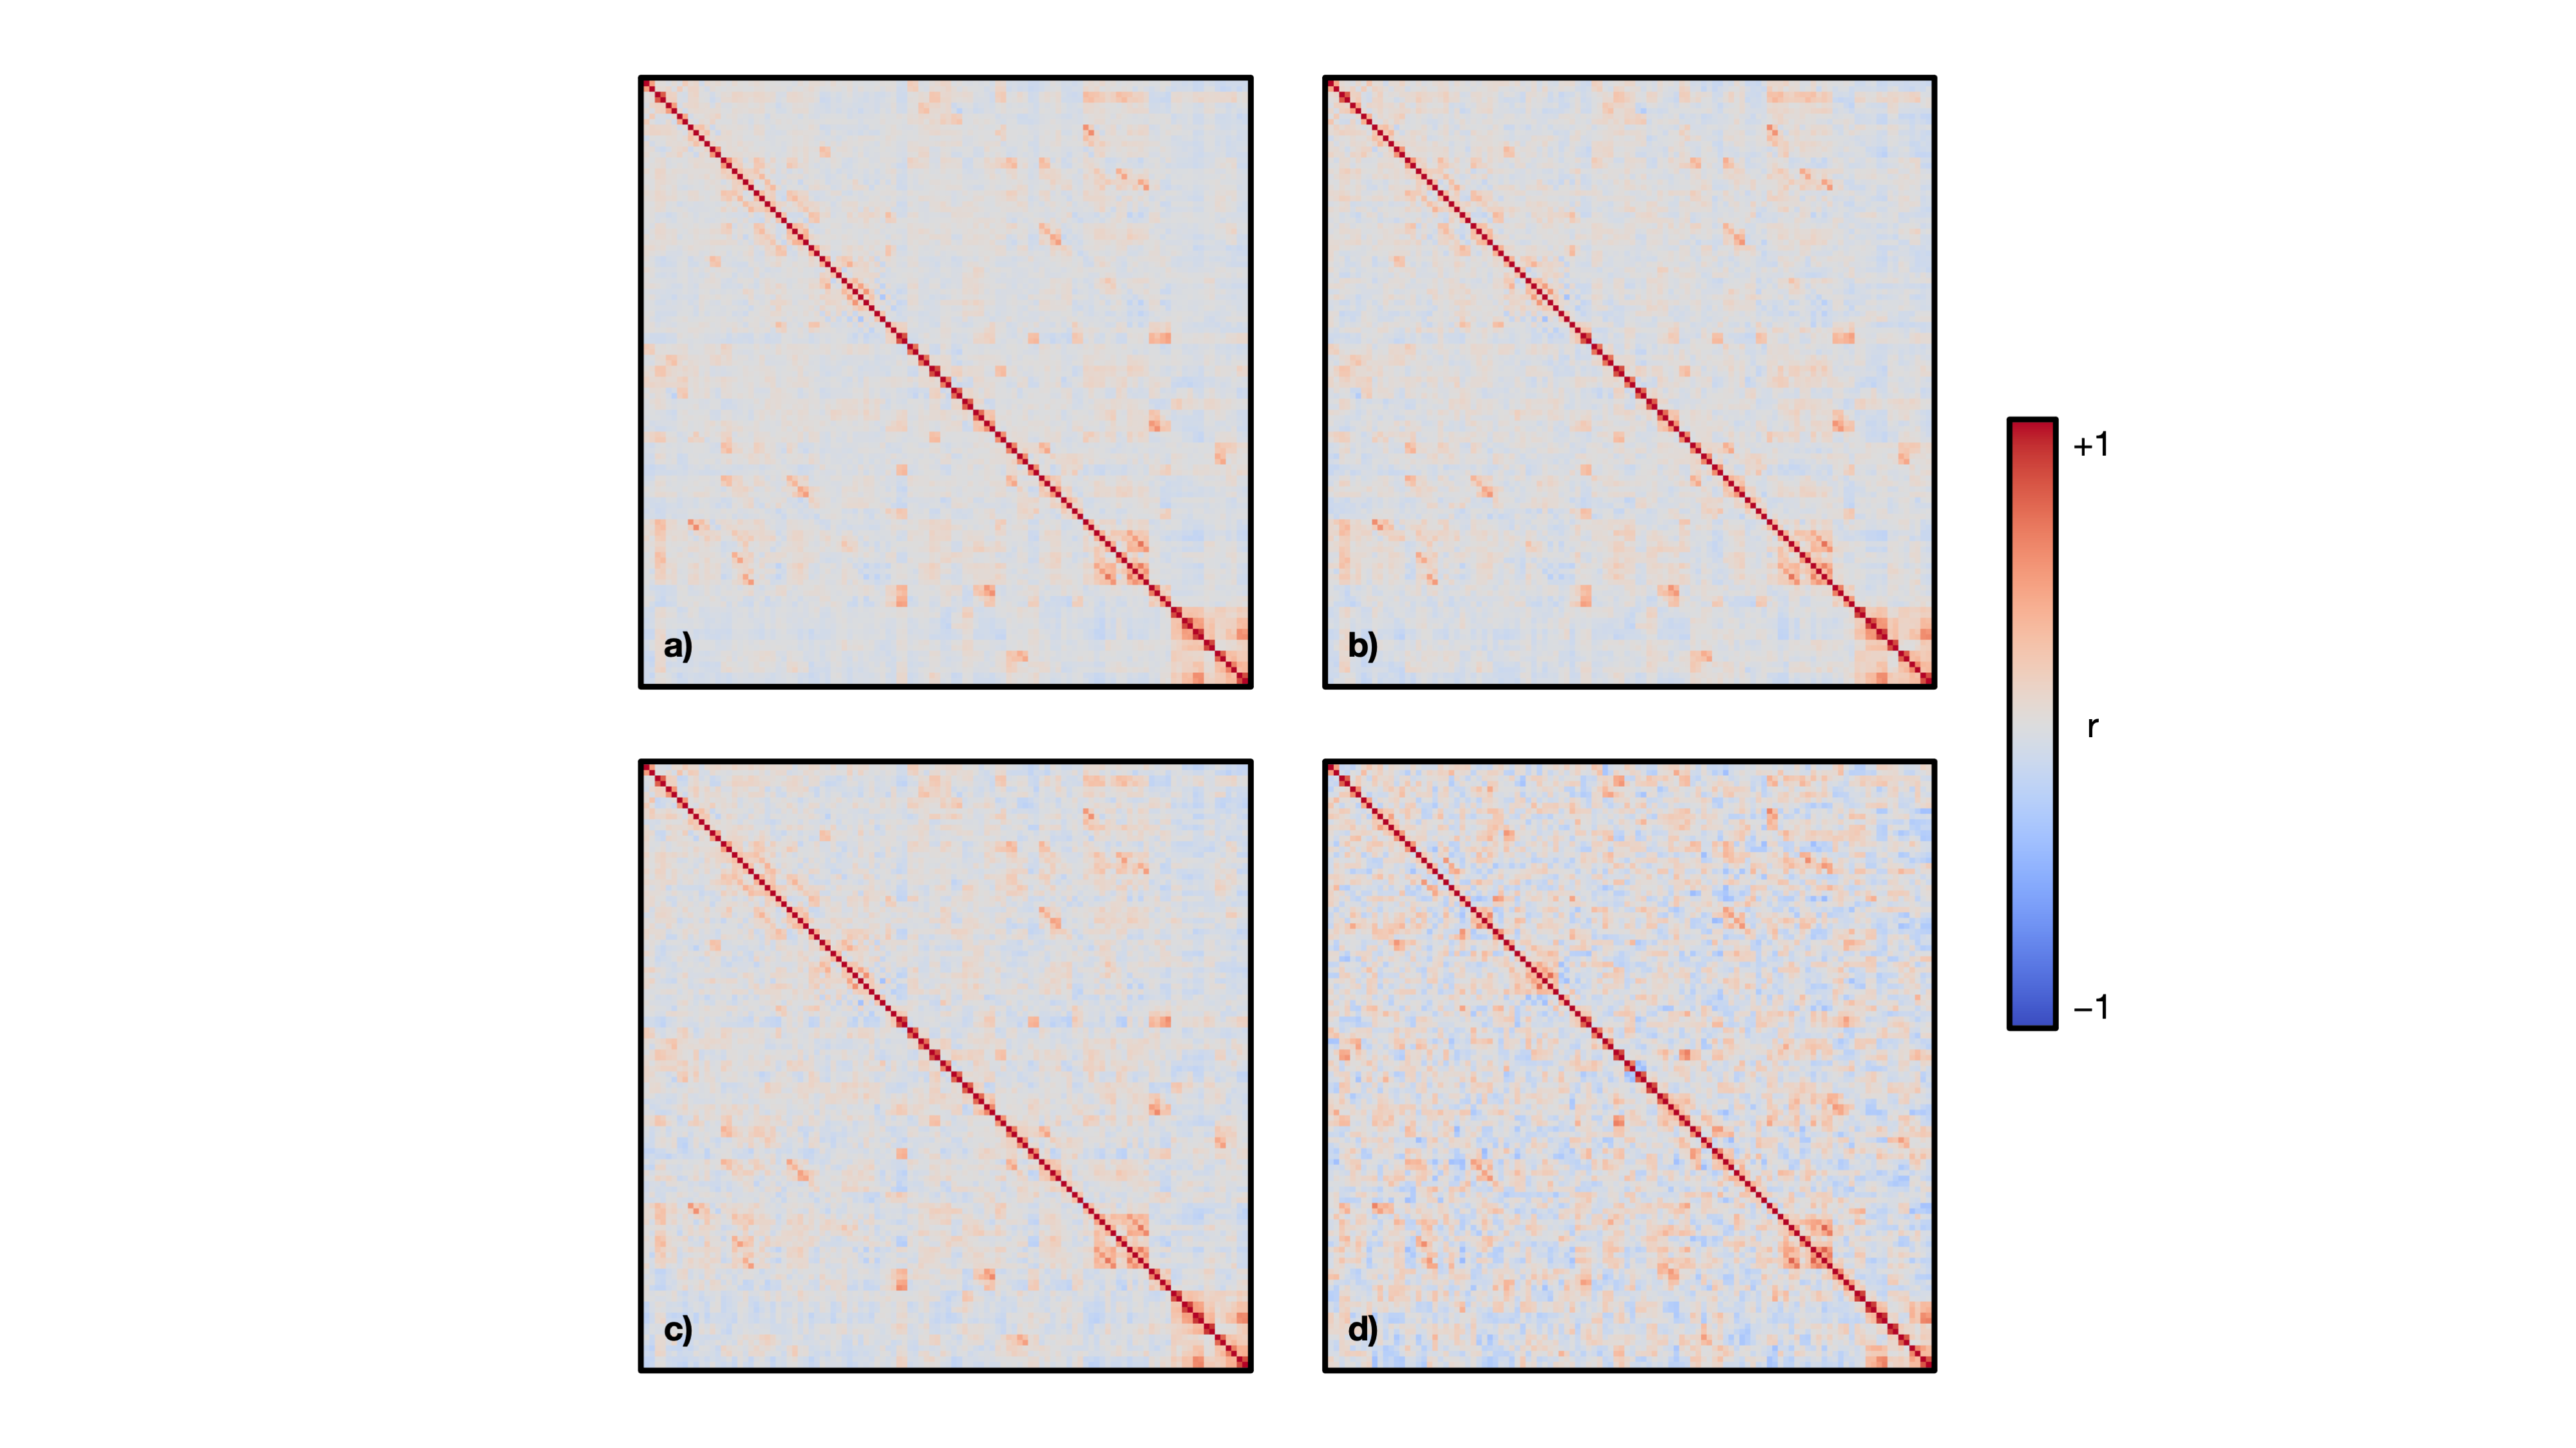
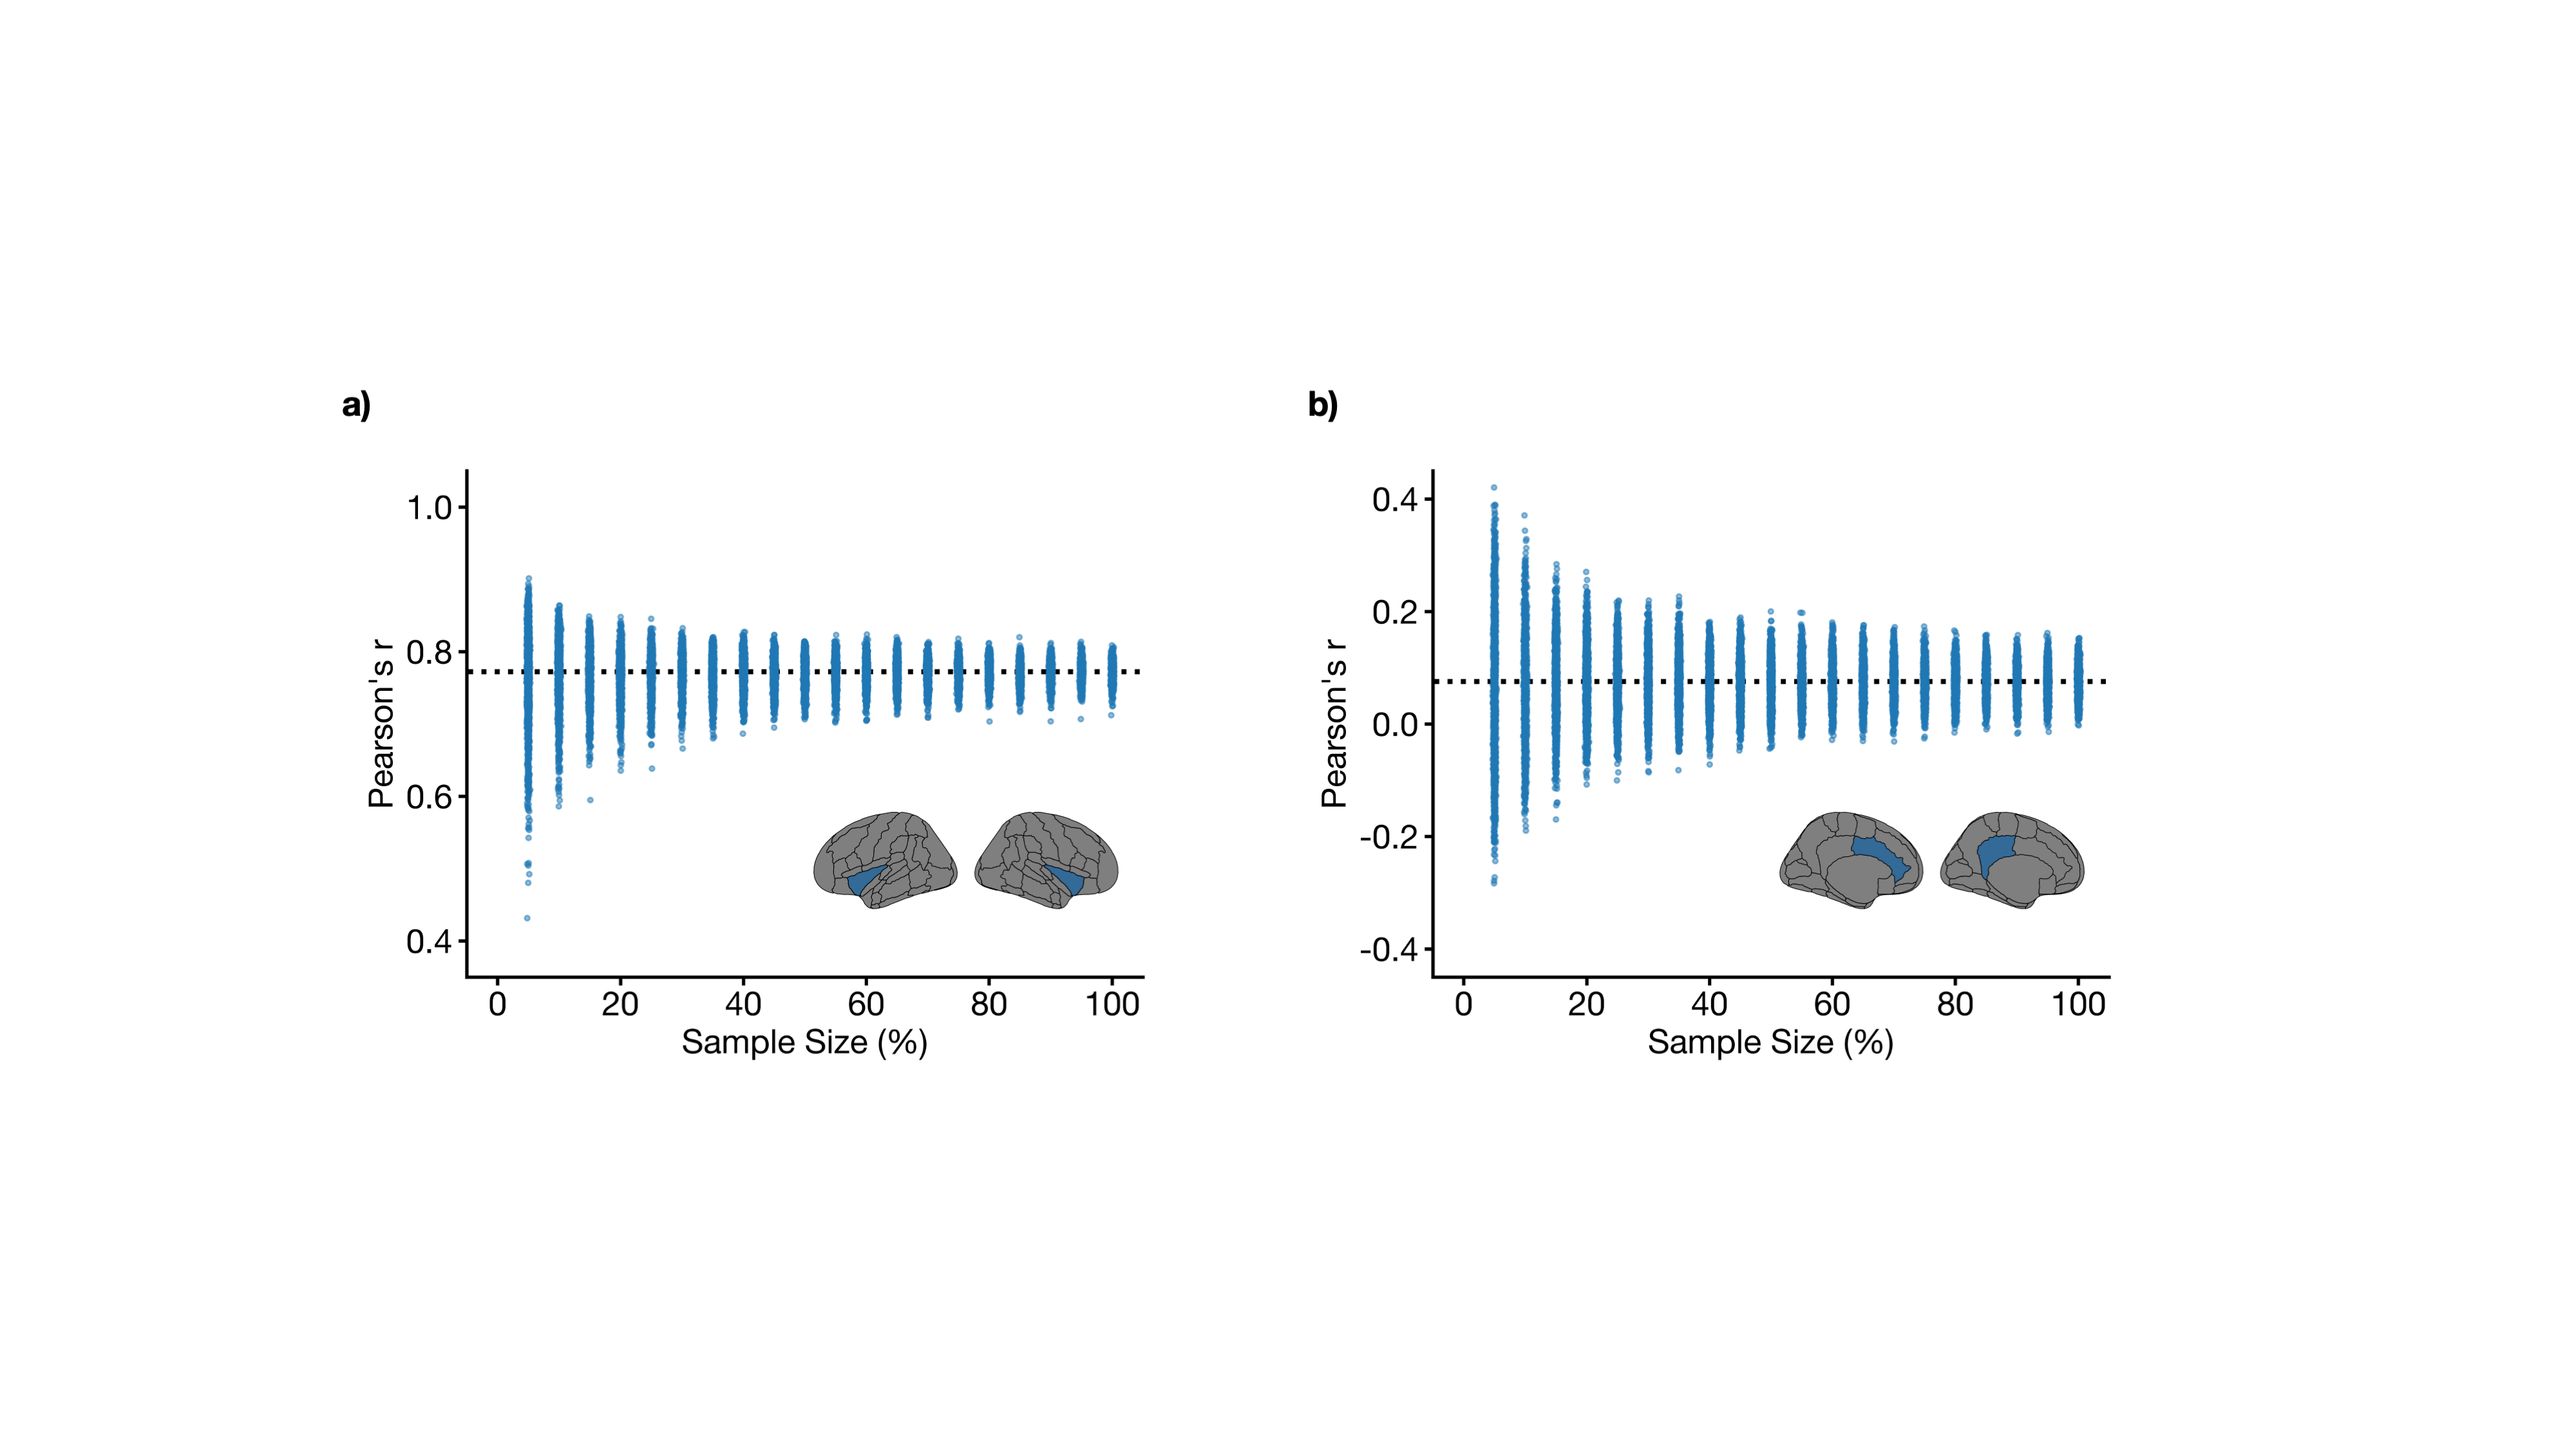
The mean age of the full sample was 55 ± 7 years and 47% were female. Structural covariance matrices for 100%, 75%, 50%, and 25% of the full sample are shown in Figure 1. Distributions of Pearson’s correlation coefficient from the bootstrapping procedure between example brain region pairs are shown in Figure 2.We found that structural covariance stability decreased with decreasing sample size, with an overall “equivalency” rate of ~78% at 5% of the sample, or ~87 individuals (Figure 3). In other words, ~78% of the matrix elements from the 5% sample size case were not significantly different from the 100% sample size case. The organization of the threshold matrix, as detected by consensus clustering, resulted in 4 communities, shown in Figure 4. The most stable community (mean threshold sample size of ~152 individuals) primarily encompassed lateral and cortical regions, including the insula, postcentral gyrus, and orbitofrontal cortex. The least stable community (mean threshold sample size of ~220 individuals) primarily encompassed medial and subcortical regions, including the cingulate gyrus, thalamus, and putamen.
Discussion
In this work, we explored intra-dataset stability of structural covariance using data from the UK Biobank. In comparison to the full sample of 1,753 individuals, we found that a smaller sample of ~87 individuals was large enough to generate an acceptable structural covariance matrix, similar to findings from animal models.13 Across the brain, structural covariance stability was heterogeneous; lateral and cortical regions were the most stable while medial and subcortical regions were the least stable. In all, this work capitalizes on a large repository of brain imaging data and provides insight into sample size considerations of structural covariance in the human brain. Future work is needed to study different demographic groups and parcellation schemes.Acknowledgements
No acknowledgement found.References
1. Alexander-Bloch A, Giedd JN, Bullmore E. Imaging structural co-variance between human brain regions. Nature Reviews Neuroscience. Published online 2013. doi:10.1038/nrn3465
2. Alexander-Bloch A, Raznahan A, Bullmore E, Giedd J. The convergence of maturational change and structural covariance in human cortical networks. Journal of Neuroscience. Published online 2013. doi:10.1523/JNEUROSCI.3554-12.2013
3. Nestor SM, Mišić B, Ramirez J, et al. Small vessel disease is linked to disrupted structural network covariance in Alzheimer’s disease. Alzheimer’s and Dementia. Published online 2017. doi:10.1016/j.jalz.2016.12.007
4. Griffiths KR, Grieve SM, Kohn MR, Clarke S, Williams LM, Korgaonkar MS. Altered gray matter organization in children and adolescents with ADHD: a structural covariance connectome study. Translational Psychiatry. Published online 2016. doi:10.1038/tp.2016.219
5. Luciw NJ, Toma S, Goldstein BI, MacIntosh BJ. Correspondence between patterns of cerebral blood flow and structure in adolescents with and without bipolar disorder. Journal of Cerebral Blood Flow & Metabolism. Published online 2021. doi:10.1177/0271678X21989246
6. Carmon J, Heege J, Necus JH, et al. Reliability and comparability of human brain structural covariance networks. NeuroImage. Published online 2020. doi:10.1016/j.neuroimage.2020.117104
7. Miller KL, Alfaro-Almagro F, Bangerter NK, et al. Multimodal population brain imaging in the UK Biobank prospective epidemiological study. Nature Neuroscience. 2016;19(11):1523-1536. doi:10.1038/nn.4393
8. Alfaro-Almagro F, Jenkinson M, Bangerter NK, et al. Image processing and Quality Control for the first 10,000 brain imaging datasets from UK Biobank. NeuroImage. 2018;166:400-424. doi:10.1016/j.neuroimage.2017.10.034
9. Jenkinson M, Beckmann CF, Behrens TEJ, Woolrich MW, Smith SM. FSL. NeuroImage. 2012;62(2):782-790. doi:10.1016/J.NEUROIMAGE.2011.09.015
10. Blondel VD, Guillaume JL, Lambiotte R, Lefebvre E. Fast unfolding of communities in large networks. Journal of Statistical Mechanics: Theory and Experiment. 2008;2008(10):10008. doi:10.1088/1742-5468/2008/10/P10008
11. Cohen JR, D’Esposito M. The segregation and integration of distinct brain networks and their relationship to cognition. Journal of Neuroscience. 2016;36(48):12083-12094. doi:10.1523/JNEUROSCI.2965-15.2016
12. Lancichinetti A, Fortunato S. Consensus clustering in complex networks. Scientific Reports. 2012;2(1):1-7. doi:10.1038/srep00336
13. Pagani M, Bifone A, Gozzi A. Structural covariance networks in the mouse brain. NeuroImage. 2016;129:55-63. doi:10.1016/J.NEUROIMAGE.2016.01.025
Figures