4984
Subject-specific multi-echo fMRI derived seed-based connectivity as a biomarker for mild traumatic brain injury1GE Research, Niskayuna, NY, United States, 2GE Healthcare, Niskayuna, NY, United States, 3GE Research, Bangalore, India, 4GE Healthcare, Versailles, France, 5Uniformed Services University of the Health Sciences, Bethesda, MD, United States, 6Walter Reed National Military Medical Center, Bethesda, MD, United States
Synopsis
Mild traumatic injury (mTBI) patients exhibit acute symptoms including headaches and memory problems that sometimes persist for months, though CT/MRI scans appear normal. The purpose of this study was to identify functional biomarkers of mTBI during the 3-months following injury using seed-based functional connectivity derived from multi-echo resting state functional MRI. In this work, we use multi-band multi-echo resting state fMRI to estimate seed-based functional connectivity. We propose a novel quantitative analysis methodology of suitable for voxel-wise single-subject assessment of disrupted functional connectivity by using an outlier-analysis approach.
Introduction
Resting-state functional magnetic resonance imaging (rs-fMRI) studies have provided an improved understanding of the human brain functional integration and large-scale network organization1. Seed-based connectivity (SBC) analysis has been widely used to define various brain networks and their functional connectivity1,2. Previously, we have shown that in group-level analyses of mild traumatic brain injury (mTBI) patients, SBC was correlated to symptom severity3. Here, we use a novel outlier-based metric to evaluate SBC connectivity changes at a single-subject level. fMRI signal intensity depends on multiple factors including cerebral metabolic rate for oxygen consumption (CMRO2), cerebral blood volume, cerebral blood flow, other non-BOLD physiological factors, head motion, magnetic field-strength, and inhomogeneity4. Previous work showed transverse relaxation rate (R2*), derived from multi-echo echo-planar-imaging, to be useful for separating non-BOLD effects from the rs-fMRI signal5. In this study, we compare single-echo and R2* derived time-series to estimate BOLD specific connectivity without compromising sensitivity in an ongoing clinical study.Methods
11 subjects (7 healthy controls (age 39±13 years, 2 female, VOMS score=5.±11.4), 1 acute mTBI subject (38 Years, Female, VOMS score=80 10-days post-injury) and 1 symptomatic chronic mTBI (50 years, Female, 3-months post-injury, VOMS score=31) were imaged under approved-IRB protocols using three-echo mEPI on a whole-body 3T system (GE SIGNA MR750), equipped a high-performance head-gradient coil (MAGNUS)6 using a 32-channel phased array head coil (NOVA Medical, Wilmington, MA). The MAGNUS gradient coil operates at maximum gradient strength 200 mT/m with a maximum slew rate of 500 T/m/s. Acute and healthy subjects were imaged twice with 2 weeks between scans. The resting state multi-echo acquisition had the following parameters: repetition-time (TR) 1.67s, multi-band factor 2, acceleration factor 2, flip-angle 40o, 2.5-mm isotropic resolution, and a total of 220 time-points. These acquisition parameters provided echo-times TE1/TE2/TE3= 9.6/22.7/35.8 ms for the three echoes. The third-echo (TE3=35.8ms) was used as the reference, and assumed to be equivalent to conventional single-echo fMRI. A 1-mm isotropic resolution T1-weighted MRI was also acquired for registration purposes.The single-compartment mono-exponential MR signal model assumed for the mEPI signal (s) is shown below, where TEi is the ith echo-time, S0 is the initial magnetization (approximating single-echo rs-fMRI signal at TE=0) and R2* is the transverse relaxation rate. Assuming additive noise, R2* and S0 were simultaneously estimated voxel-by-voxel from fit of the signal response as a function of TE.
$$s(TE_i)=s_i\approx S_0 \exp(-R_2^* \times TE_i)$$
Pre-processing: The preprocessing of single-echo and R2* resting state-fMRI data were performed using custom-built pipeline3. Motion correction parameters from first-echo processing were used for correcting for motion at the later echoes and R2*. Similarly, co-registration to T1-weighted image and normalization to MNI atlas were performed on first-echo data, and the same parameters were used for processing the later echoes and R2*. Twelve well-known functional networks were estimated using seed-based connectivity for single-echo and R2* rs-fMRI3. For each subject, the mean time-course for each seed-region was computed. Pearson correlation coefficient between the seed region mean time-course and the voxel time-course for every voxel in the brain was computed. Correlation-coefficient was converted to functional-connectivity (FC) maps using Fisher z-transform.
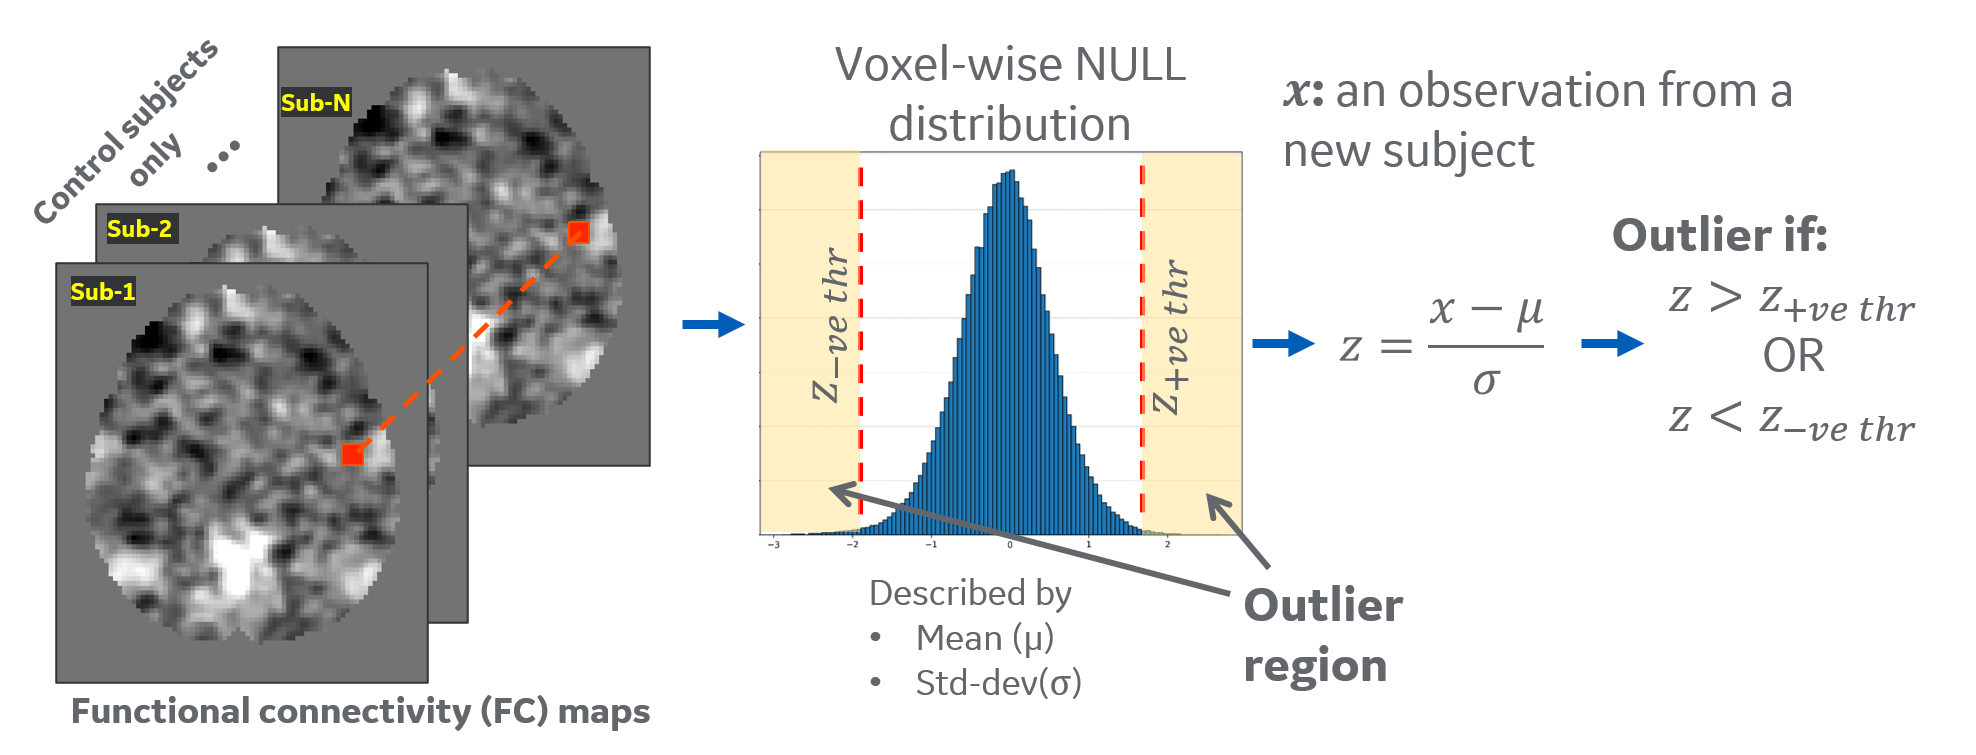
Outlier analysis: Our approach estimates a model of ‘normal’ (or 'null') SBC by studying the distribution across healthy subjects, which is compared to an individual patient’s parameter(s) to describe the difference from normal population. We computed a voxel-wise null-distribution in atlas space using the FC maps from healthy controls, which is summarized by mean (μ) and standard-deviation (σ) value at each voxel (Figure 1). Subject-specific distance from this null-distribution is measured by computing voxel-wise z-scores z=(x-μ)/σ for an observation x. A z-score threshold of 2.5 was selected to classify the voxels as outliers. The percentage of outlier voxels in each functional ROI7 was calculated to analyze differences for each subject.
Results
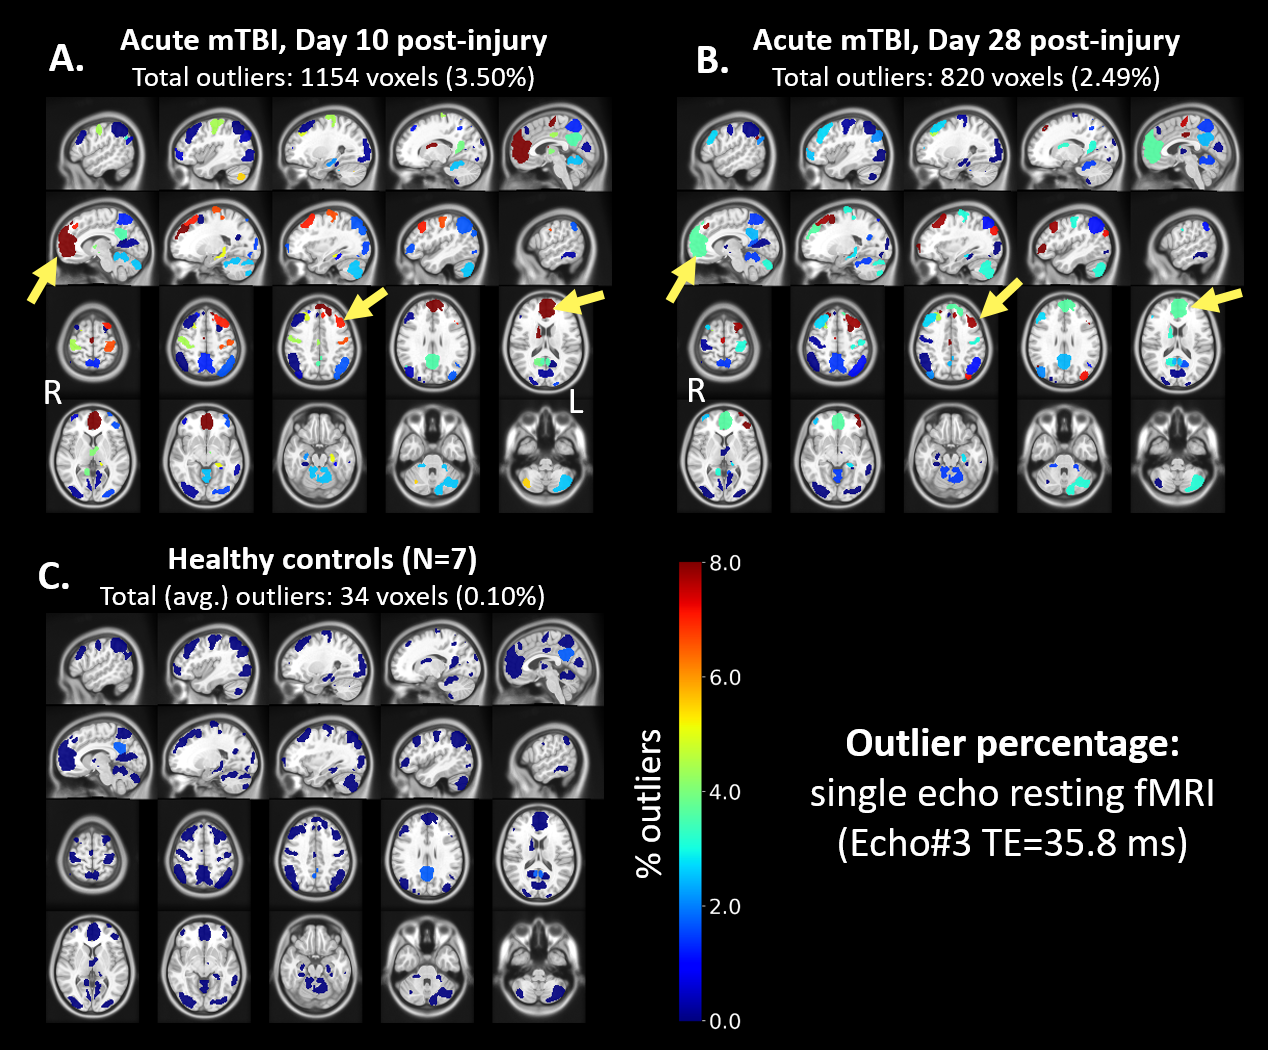
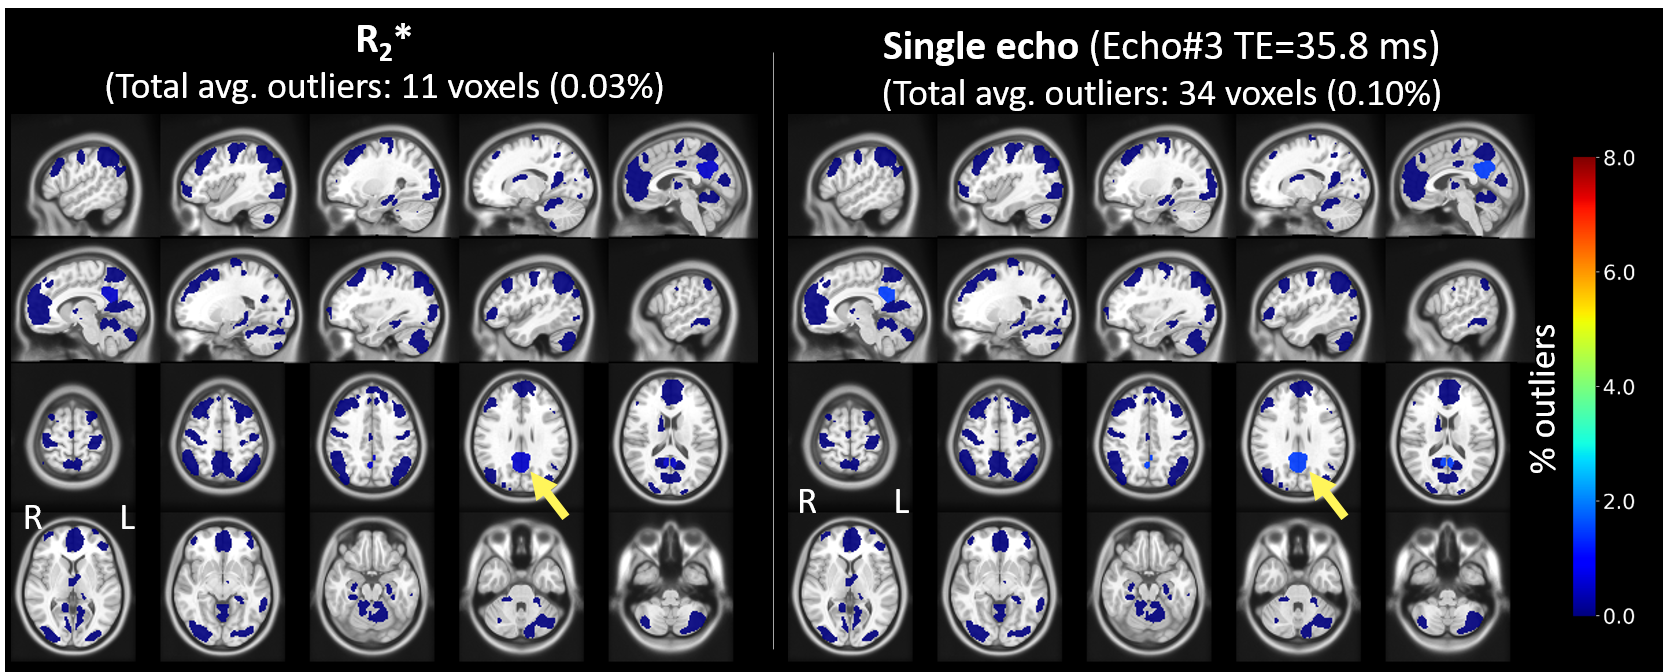
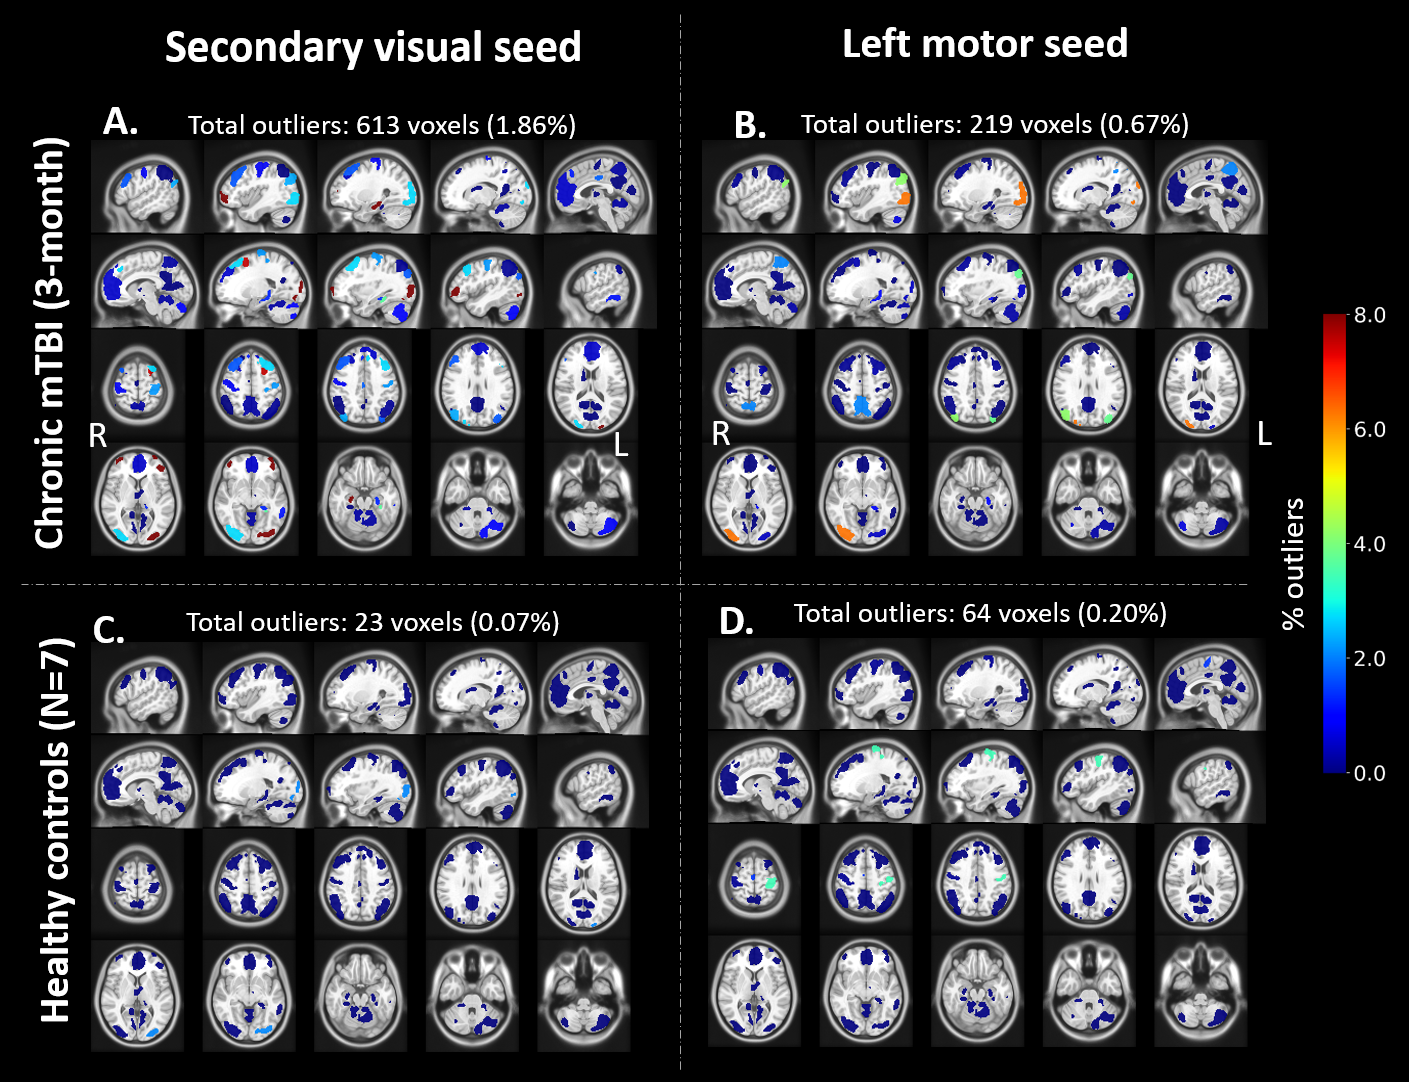
Distribution of FC map for default mode network (DMN) seeds in control subjects showed very few (<1%) outliers (Figure 2C). In contrast, a symptomatic acute mTBI patient (VOMS=80) at 10 days post-injury showed substantial number of outliers in the executive control network (ECN) regions with DMN seeds, indicating disrupted functional connectivity between ECN and DMN regions (Figure 2A). This patient’s symptoms were resolved by 28-days post injury, which is also indicated by lower number of outliers in the same regions (Figure 2B). R2*-derived functional connectivity maps showed complementary information on functional connectivity, but tighter distribution of outliers in controls (Figure 3). Figure 4 shows significant number of outliers in functional connectivity between secondary visual and motor regions in a symptomatic chronic mTBI patient (3-months post-injury) with high symptom burden related to “blurriness” (dizziness score of 18 compared to mean score of 0.16 across controls).Discussion and Conclusion
mTBI is a heterogeneous disease, whereby anatomical regions affected by mTBI can vary greatly with the etiology of neurotrauma and location of injury. Our results suggest that outlier-based seed-based functional connectivity may offer an approach to quantify the effect of network disruption due to mTBI at a single subject level even with limited sample size. In future, we will present more comprehensive analysis as sample size increases with the clinical study. Our approach relies on estimating a model for healthy population, which can be more readily obtained in large numbers than diseased samples.Acknowledgements
Grant funding from CDMRP W81XWH-16-2-0054, NIH U01EB028976.
The opinions or assertions contained herein are the views of the authors and are not to be construed as the views of the U.S. Department of Defense, Walter Reed National Military Medical Center, or the Uniformed Services University.
References
1. Biswal, B., Yetkin, F. Z., Haughton, V. M. & Hyde, J. S. Functional connectivity in the motor cortex of resting human brain using echo-planar MRI. Magn. Reson. Med. 34, 537–541 (1995).
2. Fox, M. D. et al. The human brain is intrinsically organized into dynamic, anticorrelated functional networks. Proc. Natl. Acad. Sci. U. S. A. 102, 9673–9678 (2005).
3. Madhavan, R. et al. Longitudinal Resting State Functional Connectivity Predicts Clinical Outcome in Mild Traumatic Brain Injury. J. Neurotrauma 36, 650–660 (2019).
4. Zhao, J. M., Clingman, C. S., Närväinen, M. J., Kauppinen, R. A. & van Zijl, P. C. M. Oxygenation and hematocrit dependence of transverse relaxation rates of blood at 3T. Magn. Reson. Med. 58, 592–597 (2007).
5. Kundu, P., Inati, S. J., Evans, J. W., Luh, W.-M. & Bandettini, P. A. Differentiating BOLD and non-BOLD signals in fMRI time series using multi-echo EPI. NeuroImage 60, 1759–1770 (2012).
6. Foo, T. K. F. et al. Highly efficient head-only magnetic field insert gradient coil for achieving simultaneous high gradient amplitude and slew rate at 3.0T (MAGNUS) for brain microstructure imaging. Magn. Reson. Med. 83, 2356–2369 (2020).
7. Shirer, W. R., Ryali, S., Rykhlevskaia, E., Menon, V. & Greicius, M. D. Decoding Subject-Driven Cognitive States with Whole-Brain Connectivity Patterns. Cereb. Cortex 22, 158–165 (2012).
Figures