4983
A data-driven variability assessment of brain diffusion MRI preprocessing pipelines
Jelle Veraart1, Daan Christiaens2, Erpeng Dai3, Luke J. Edwards4, Vladimir Golkov5, Siawoosh Mohammadi6, Kurt G. Schilling7, Mohammad Hadi Aarabi8, Benjamin Ades-Aron1,9, Nagesh Adluru10, Sahar Ahmad11, Santiago Aja-Fernandez12, Andrew L. Alexander10, Mariam Andersson13, Elixabete Ansorena14, Fakhereh Movahedian Attar4, Arnaud Attye15, Dogu Baran Aydogan16,17, Steven H. Baete1, Gianpaolo Antonio Basile18, Giulia Bertò19, Ahmad Beyh20, Alberto Cacciola18, Maxime Chamberland21, Fernando Calamante22, Jenny Chen1, Jian Chen23, Shin Tai Chong24, Santiago Coelho1, Luis Concha25, Ricardo Coronado-Leija1, Michiel Cottaar26, Daniel Cremers5, Szabolcs David14,27, Alberto De Luca14, Flavio Dell'Acqua20, Thijs Dhollander23, Jason Druzgal28, Tim B. Dyrby13,29, Hernández-Torres Enedino13, Oscar Esteban30, Els Fieremans1, Leon Fonville31, Björn Fricke32, Martijn Froeling33, Ian Galea34, Gabriel Girard35,36, Francesco Grussu37, Chin-Chin Heather Hsu38,39, Yung-Chin Hsu40, Khoi Huynh11, Matilde Inglese41,42, Heide Johansen-berg26, Derek K Jones43, Kouhei Kamiya44, Claire Kelly45,46, Ahmad Raza Khan47, Ali Khan48, Yi-Chia Kung24, Alberto Lazari26, Alexander Leemans14, Laura Mancini49,50, Ivan I. Maximov51, Harri Merisaari52, Malwina Molendowska43, Benjamin T. Newman28, Michael D. Noseworthy53, Dmitry S. Novikov1, Raquel Perez-Lopez37, Franco Pestili19, Tomasz Pieciak12, Marco Pizzolato29, Álvaro Planchuelo-Gómez12, Paul Polak54, Erika P. Raven1, Ricardo Rios-Carrillo25, Viljami Sairanen55, Simona Schiavi41, Pohchoo Seow56, Dmitri Shastin43, Yao-Chia Shih56,57, Lucas Soustelle58, Yue Sun59, Karsten Tabelow60, Chantal MW Tax14,43, Guillaume Theaud61, Sjoerd B. Vos62, Ryckie G. Wade63, Li Wang59, Limei Wang59, Thomas Welton64,65, Lars T. Westlye66, Stefan Winzeck67,68, Joseph Yuan-Mou Yang69,70, Pew-Thian Yap11, Yukai Zou34, Jennifer A. McNab3, Bennett A. Landman7, Nikolaus Weiskopf4,71, and Maxime Descoteaux61
1Center for Biomedical Imaging, Dept. Radiology, NYU School of Medicine, New York City, NY, United States, 2Department of Electrical Engineering (ESAT-PSI), KU Leuven, Leuven, Belgium, 3Department of Radiology, Stanford University, Stanford, CA, United States, 4Department of Neurophysics, Max Planck Institute for Human Cognitive and Brain Sciences, Leipzig, Germany, 5Computer Vision Group, Technical University of Munich, Munich, Germany, 6Department of Systems Neuroscience, University Medical Center Hamburg-Eppendorf, Hamburg, Germany, 7Vanderbilt University Medical Center, Nashville, TN, United States, 8Department of Neuroscience and Padova Neuroscience Center, University of Padova, Padua, Italy, 9Electrical and Computer Engineering, New York University, Brooklyn, NY, United States, 10Waisman Center and Department of Radiology, UW-Madison, Madison, WI, United States, 11Department of Radiology and Biomedical Research Imaging Center (BRIC), University of North Carolina at Chapel Hill, Chapel Hill, NC, United States, 12LPI, ETSI Telecomunicacion, Universidad de Valladolid, Valladolid, Spain, 13Danish Research Centre for Magnetic Resonance, Copenhagen University Hospital Amager and Hvidovre, Copenhagen, Denmark, 14Image Sciences Institute, UMC Utrecht, Utrecht, Netherlands, 15Sydney Imaging, University of Sydney, Sydney, Australia, 16A.I. Virtanen Institute for Molecular Sciences, University of Eastern Finland, Kuopio, Finland, 17Department of Biomedical Engineering, Aalto University, Espoo, Finland, 18Brain Mapping Lab, Department of Biomedical, Dental Sciences and Morphological and Functional Images, University of Messina, Messina, Italy, 19Department of Psychology, The University of Texas at Austin, Austin, TX, United States, 20NatBrainLab, Department of Forensic and Neurodevelopmental Sciences, King's College London, London, United Kingdom, 21Donders Institute for Brain, Cognition, and Behavior, Radboud University, Nijmegen, Netherlands, 22Sydney Imaging and School of Biomedical Engineering, University of Sydney, Sydney, Australia, 23Developmental Imaging, Murdoch Children's Research Institute, Melbourne, Australia, 24Institute of Neuroscience, National Yang Ming Chiao Tung University, Tapei, Taiwan, 25Institute of Neurobiology, Universidad Nacional Autónoma de México, Querétaro, Mexico, 26Nuffield Department of Clinical Neurosciences, University of Oxford, Wellcome Centre for Integrative Neuroimaging, FMRIB, Oxford, United Kingdom, 27Department of Radiation Oncology, UMC Utrecht, Utrecht, Netherlands, 28Department of Radiology and Medical Imaging, University of Virginia, Charlottesville, VA, United States, 29Department of Applied Mathematics and Computer Science, Technical University of Denmark, Kongens Lyngby, Denmark, 30Department of Radiology, Lausanne University Hospital and University of Lausanne, Lausanne, Switzerland, 31Department of Brain Sciences, Division of Psychiatry, Imperial College London, London, United Kingdom, 32Department of Systems Neuroscienc, University Medical Center Hamburg-Eppendorf, Hamburg, Germany, 33Department of Radiology, University medical center Utrecht, Utrecht, Netherlands, 34Department of Clinical Neurosciences, University of Southampton, Southampton, United Kingdom, 35CIBM Center for Biomedical Imaging, Lausanne, Switzerland, 36Radiology Department, Centre Hospitalier Universitaire Vaudois and University of Lausanne, Lausanne, Switzerland, 37Radiomics Group, Vall d’Hebron Institute of Oncology, Vall d’Hebron Barcelona Hospital Campus, Barcelona, Spain, 38Institute of Neuroscience, National Yang Ming Chiao Tung University, Taipei, Taiwan, 39Center for Geriatrics and Gerontology, Taipei Veterans General Hospital, Tapei, Taiwan, 40AcroViz Inc., Taipei, Taiwan, 41Department of Neurosciences, Rehabilitation, Ophthalmology, Genetics, Maternal and Child Health (DiNOGMI), University of Genoa, Genoa, Italy, 42IRCCS Ospedale San Martino, Genoa, Italy, 43Cardiff University Brain Research Imaging Centre (CUBRIC), Cardiff University, Cardiff, United Kingdom, 44Department of Radiology, Toho University, Tokyo, Japan, 45Turner Institute for Brain and Mental Health, School of Psychological Sciences, Monash University, Melbourne, Australia, 46Victorian Infant Brain Studies, Murdoch Children's Research Institute, Melbourne, Australia, 47Department of Advanced Spectroscopy and Imaging, Centre of Biomedical Research, Lucknow, India, 48Department of Medical Biophysics, Western University, London, ON, Canada, 49Lysholm Department of Neuroradiology, National Hospital for Neurology and Neurosurgery UCLH NHS FT, London, United Kingdom, 50Brain Repair and Rehabilitation, University College London, London, United Kingdom, 51Western Norway University of Applied Sciences, Bergen, Norway, 52Department of Clinical Medicine, University of Turku, Turku, Finland, 53Electrical and Computer Engineering, McMaster University, Hamilton, ON, Canada, 54School of Biomedical Engineering, McMaster University, Hamilton, ON, Canada, 55BABA Center, Pediatric Research Center, Department of Clinical Neurophysiology, Children’s Hospital, University of Helsinki and Helsinki University Hospital, Helsinki, Finland, 56Diagnostic Radiology, Singapore General Hospital, Singapore, Singapore, 57Graduate Institute of Medicine, Yuan Ze University, Taoyuan City, Taiwan, 58Aix Marseille Univ, CNRS, CRMBM, Marseille, France, 59Developing Brain Computing Lab, Department of Radiology and Biomedical Research Imaging Center, University of North Carolina at Chapel Hill, Chapel Hill, NC, United States, 60Weierstrass Institute for Applied Analysis and Stochastics, Berlin, Germany, 61Sherbrooke Connectivity Imaging Laboratory (SCIL), Université de Sherbrooke, Sherbrooke, QC, Canada, 62Centre for Medical Image Computing, University College London, London, United Kingdom, 63Leeds Institute for Medical Research, University of Leeds, Leeds, United Kingdom, 64National Neuroscience Institute, Singapore, Singapore, 65Duke-NUS Medical School, Singapore, Singapore, 66Department of Psychology, University of Oslo, Oslo, Norway, 67Department of Computing, Imperial College London, London, United Kingdom, 68Department of Medicine, University Division of Anaesthesia, University of Cambridge, Cambridge, United Kingdom, 69Department of Neurosurgery, The Royal Children's Hospital, Melbourne, Australia, 70Neuroscience Research, Murdoch Children's Research Institute, Melbourne, Australia, 71Leipzig University, Felix Bloch Institute for Solid State Physics, Faculty of Physics and Earth Sciences, Leipzig, Germany
1Center for Biomedical Imaging, Dept. Radiology, NYU School of Medicine, New York City, NY, United States, 2Department of Electrical Engineering (ESAT-PSI), KU Leuven, Leuven, Belgium, 3Department of Radiology, Stanford University, Stanford, CA, United States, 4Department of Neurophysics, Max Planck Institute for Human Cognitive and Brain Sciences, Leipzig, Germany, 5Computer Vision Group, Technical University of Munich, Munich, Germany, 6Department of Systems Neuroscience, University Medical Center Hamburg-Eppendorf, Hamburg, Germany, 7Vanderbilt University Medical Center, Nashville, TN, United States, 8Department of Neuroscience and Padova Neuroscience Center, University of Padova, Padua, Italy, 9Electrical and Computer Engineering, New York University, Brooklyn, NY, United States, 10Waisman Center and Department of Radiology, UW-Madison, Madison, WI, United States, 11Department of Radiology and Biomedical Research Imaging Center (BRIC), University of North Carolina at Chapel Hill, Chapel Hill, NC, United States, 12LPI, ETSI Telecomunicacion, Universidad de Valladolid, Valladolid, Spain, 13Danish Research Centre for Magnetic Resonance, Copenhagen University Hospital Amager and Hvidovre, Copenhagen, Denmark, 14Image Sciences Institute, UMC Utrecht, Utrecht, Netherlands, 15Sydney Imaging, University of Sydney, Sydney, Australia, 16A.I. Virtanen Institute for Molecular Sciences, University of Eastern Finland, Kuopio, Finland, 17Department of Biomedical Engineering, Aalto University, Espoo, Finland, 18Brain Mapping Lab, Department of Biomedical, Dental Sciences and Morphological and Functional Images, University of Messina, Messina, Italy, 19Department of Psychology, The University of Texas at Austin, Austin, TX, United States, 20NatBrainLab, Department of Forensic and Neurodevelopmental Sciences, King's College London, London, United Kingdom, 21Donders Institute for Brain, Cognition, and Behavior, Radboud University, Nijmegen, Netherlands, 22Sydney Imaging and School of Biomedical Engineering, University of Sydney, Sydney, Australia, 23Developmental Imaging, Murdoch Children's Research Institute, Melbourne, Australia, 24Institute of Neuroscience, National Yang Ming Chiao Tung University, Tapei, Taiwan, 25Institute of Neurobiology, Universidad Nacional Autónoma de México, Querétaro, Mexico, 26Nuffield Department of Clinical Neurosciences, University of Oxford, Wellcome Centre for Integrative Neuroimaging, FMRIB, Oxford, United Kingdom, 27Department of Radiation Oncology, UMC Utrecht, Utrecht, Netherlands, 28Department of Radiology and Medical Imaging, University of Virginia, Charlottesville, VA, United States, 29Department of Applied Mathematics and Computer Science, Technical University of Denmark, Kongens Lyngby, Denmark, 30Department of Radiology, Lausanne University Hospital and University of Lausanne, Lausanne, Switzerland, 31Department of Brain Sciences, Division of Psychiatry, Imperial College London, London, United Kingdom, 32Department of Systems Neuroscienc, University Medical Center Hamburg-Eppendorf, Hamburg, Germany, 33Department of Radiology, University medical center Utrecht, Utrecht, Netherlands, 34Department of Clinical Neurosciences, University of Southampton, Southampton, United Kingdom, 35CIBM Center for Biomedical Imaging, Lausanne, Switzerland, 36Radiology Department, Centre Hospitalier Universitaire Vaudois and University of Lausanne, Lausanne, Switzerland, 37Radiomics Group, Vall d’Hebron Institute of Oncology, Vall d’Hebron Barcelona Hospital Campus, Barcelona, Spain, 38Institute of Neuroscience, National Yang Ming Chiao Tung University, Taipei, Taiwan, 39Center for Geriatrics and Gerontology, Taipei Veterans General Hospital, Tapei, Taiwan, 40AcroViz Inc., Taipei, Taiwan, 41Department of Neurosciences, Rehabilitation, Ophthalmology, Genetics, Maternal and Child Health (DiNOGMI), University of Genoa, Genoa, Italy, 42IRCCS Ospedale San Martino, Genoa, Italy, 43Cardiff University Brain Research Imaging Centre (CUBRIC), Cardiff University, Cardiff, United Kingdom, 44Department of Radiology, Toho University, Tokyo, Japan, 45Turner Institute for Brain and Mental Health, School of Psychological Sciences, Monash University, Melbourne, Australia, 46Victorian Infant Brain Studies, Murdoch Children's Research Institute, Melbourne, Australia, 47Department of Advanced Spectroscopy and Imaging, Centre of Biomedical Research, Lucknow, India, 48Department of Medical Biophysics, Western University, London, ON, Canada, 49Lysholm Department of Neuroradiology, National Hospital for Neurology and Neurosurgery UCLH NHS FT, London, United Kingdom, 50Brain Repair and Rehabilitation, University College London, London, United Kingdom, 51Western Norway University of Applied Sciences, Bergen, Norway, 52Department of Clinical Medicine, University of Turku, Turku, Finland, 53Electrical and Computer Engineering, McMaster University, Hamilton, ON, Canada, 54School of Biomedical Engineering, McMaster University, Hamilton, ON, Canada, 55BABA Center, Pediatric Research Center, Department of Clinical Neurophysiology, Children’s Hospital, University of Helsinki and Helsinki University Hospital, Helsinki, Finland, 56Diagnostic Radiology, Singapore General Hospital, Singapore, Singapore, 57Graduate Institute of Medicine, Yuan Ze University, Taoyuan City, Taiwan, 58Aix Marseille Univ, CNRS, CRMBM, Marseille, France, 59Developing Brain Computing Lab, Department of Radiology and Biomedical Research Imaging Center, University of North Carolina at Chapel Hill, Chapel Hill, NC, United States, 60Weierstrass Institute for Applied Analysis and Stochastics, Berlin, Germany, 61Sherbrooke Connectivity Imaging Laboratory (SCIL), Université de Sherbrooke, Sherbrooke, QC, Canada, 62Centre for Medical Image Computing, University College London, London, United Kingdom, 63Leeds Institute for Medical Research, University of Leeds, Leeds, United Kingdom, 64National Neuroscience Institute, Singapore, Singapore, 65Duke-NUS Medical School, Singapore, Singapore, 66Department of Psychology, University of Oslo, Oslo, Norway, 67Department of Computing, Imperial College London, London, United Kingdom, 68Department of Medicine, University Division of Anaesthesia, University of Cambridge, Cambridge, United Kingdom, 69Department of Neurosurgery, The Royal Children's Hospital, Melbourne, Australia, 70Neuroscience Research, Murdoch Children's Research Institute, Melbourne, Australia, 71Leipzig University, Felix Bloch Institute for Solid State Physics, Faculty of Physics and Earth Sciences, Leipzig, Germany
Synopsis
The preprocessing of dMRI data sets is a critical step in the experimental workflow that, in general, improves the data reliability. We provide a comprehensive survey of the preprocessing workflows for dMRI data within our research community, assessing their variability and quantifying its impact on the dMRI metric reproducibility and inter-site comparisons. We observed that the lack of a standardized preprocessing pipeline across researchers is a significant source of variability that might lower the reproducibility of studies. These preliminary results highlight the need for harmonization of the image preprocessing workflow for dMRI data to promote more robust and reproducible analyses.
Introduction
Researchers looking to extract clinically relevant measures from a set of diffusion weighted images must often overcome multiple challenges throughout a complex workflow going from data organization, processing, to analysis1. Without field-accepted standards for handling dMRI data, the preprocessing pipelines may vary substantially across groups. There is a growing awareness that the lack of such standardization is likely to impact the reproducibility of our dMRI studies—a topic with increasing focus across many research fields2,3.Image preprocessing is the multi-step process that corrects the geometric and signal distortions of diffusion-weighted images to minimize false negatives without increasing the false positives in further analyses. The growing body of literature and publicly available and computationally efficient software tools have popularized complex preprocessing pipelines in which each processing step adds to the accumulated sources of ambiguity. However, guiding principles for image preprocessing are still missing, leaving individual researchers with myriad degrees of freedom in the design of such pipelines, as there is no objective way to determine a canonical preprocessing workflow.
In this study, we will provide a comprehensive survey of the preprocessing workflows for dMRI data within our research community, assessing their variability and quantifying its impact on the dMRI metric reproducibility and inter-site comparisons.
Methods
First, an online survey was conducted to capture the preferences in terms of image preprocessing within our research community.Second, multi-shell SE-EPI dMRI data (b=0, 1000, and 2000 s/mm2) was acquired on multiple sites using hardware systems from different vendors (3T GE SIGNA Premier , 3T Connectom Siemens, and 3T Achieva Philips). The data include unprocessed magnitude MRI data sets of 13 subjects. Defacing was applied to a subset of data to comply with institutional regulations. For each subject, three scan “sessions” with distinct settings and instructions related to motion were acquired to introduce artifacts of varying shapes and sizes while preserving the encoded diffusion information. A fourth scan session featured identical settings as the first one for a conventional repeatability assessment. In addition, the data set included non-diffusion-weighted images with reversed phase encoding, a T1-weighted MPRAGE, and a field map.
We asked research teams to preprocess the individual data sets with their routinely-used preprocessing pipeline. All further processing, including tensor fitting, was performed with identical software and algorithms.
Results
The survey was completed by 232 participants from 30 countries. Their expertise varied widely, thereby capturing both developers and users of dMRI preprocessing tools. 85% of the participants favored a standardized image preprocessing pipeline. However, 42% of the respondents state that there is currently no standardization within their own research team. 87% of the respondents consider a preprocessing time of 1 to 2 hours per data set acceptable. Although the software platform and operating system are less critical, 73% of the respondents find it important that the used software be open source. Most respondents recognize the importance of streamlining data acquisition and image preprocessing to optimize the performance of image preprocessing tools. The acquisition of a non-diffusion weighted image with reversed phase encoding, interleaving the non-diffusion-weighted images, and providing user-defined gradient files are the most preferred examples of such an integration.Preprocessing pipelines varied widely across the survey participants. However, the majority of the participants include motion correction, eddy current distortion correction, susceptibility-induced distortion correction, and b-matrix rotation. In contrast, signal drift correction, gradient nonlinearity corrections, and Rician bias correction are much less widely adopted amongst the survey participants (Fig. 1). In general, the leading arguments to exclude certain preprocessing steps are not being aware or not being convinced of importance, followed by not having access to tools or preferring a minimal preprocessing pipeline (Fig. 2).
The project-specific data were independently preprocessed by 52 groups (38 users and 14 developers). A qualitative comparison of six exemplary fractional anisotropy (FA) maps is shown in Fig. 3. Next, we quantified the inter-pipeline variability in the estimation of widely-adopted diffusion metrics, for various analysis strategies. We also compared the inter-pipeline variability with inter-subject and intra-subject variability. Fig. 4 shows the inter-pipeline, intra-subject and inter-subject variability in the segment-wise quantification of FA along the left cortico-spinal tract (CST)4. This analysis was limited to the Siemens data; covering 5 subjects. For intra-subject evaluation, the dMRI data were either not, or minimally preprocessed5. The inter-pipeline variability widely exceeds the intra-subject “test-retest” variability; nearly equaling the inter-subject variability. The bulk of the preprocessing pipelines had significantly lower "test-retest" variability than unprocessed data (Fig. 5).
Discussion and Conclusion
The preprocessing of dMRI data sets is a critical step in our experimental workflow that, in general, improves the data reliability. However, we observe that the lack of a standardized preprocessing pipeline across researchers is a significant source of variability that might lower the reproducibility of studies, especially across sites and with incomplete description of the preprocessing workflows. Moreover, as observed in this study, complex preprocessing pipelines are prone to errors, leading to a reduction in accuracy, precision, or reproducibility. These preliminary results highlight the need for best practices, if not complete standardization, of the image preprocessing workflow for diffusion-weighted MRI data to promote more robust and reproducible analyses.Acknowledgements
We are grateful to the 232 participants that completed the survey. This project has been made possible with support from Canada Institutional Research Chair in NeuroInformatics; National Science Foundation CAREER award number 1452485; the National Institutes of Health award number R01EB017230, R01 EB027075, P41 EB017183, and R01 NS088040; the European Research Council under the European Union’s Seventh Framework Programme (FP7/2007-2013; ERC #616905); the German Federal Ministry of Education and Research (BMBF) (01EW1711A & B) in the framework of ERA-NET NEURON; and the Max Planck Society.References
[1] Jones DK. Oxford University Press; 2011[2] Botvinik-Nezer, R. et al (2020). Nature 582(7810): 84–88.
[3] Carp, J. (2012) Front. Neurosci. 6, 149.
[4] Yeatman et al. (2012) Plos One 7(11): e49790
[5] Glasser et al. (2013) NeuroImage 80:105-24
Figures
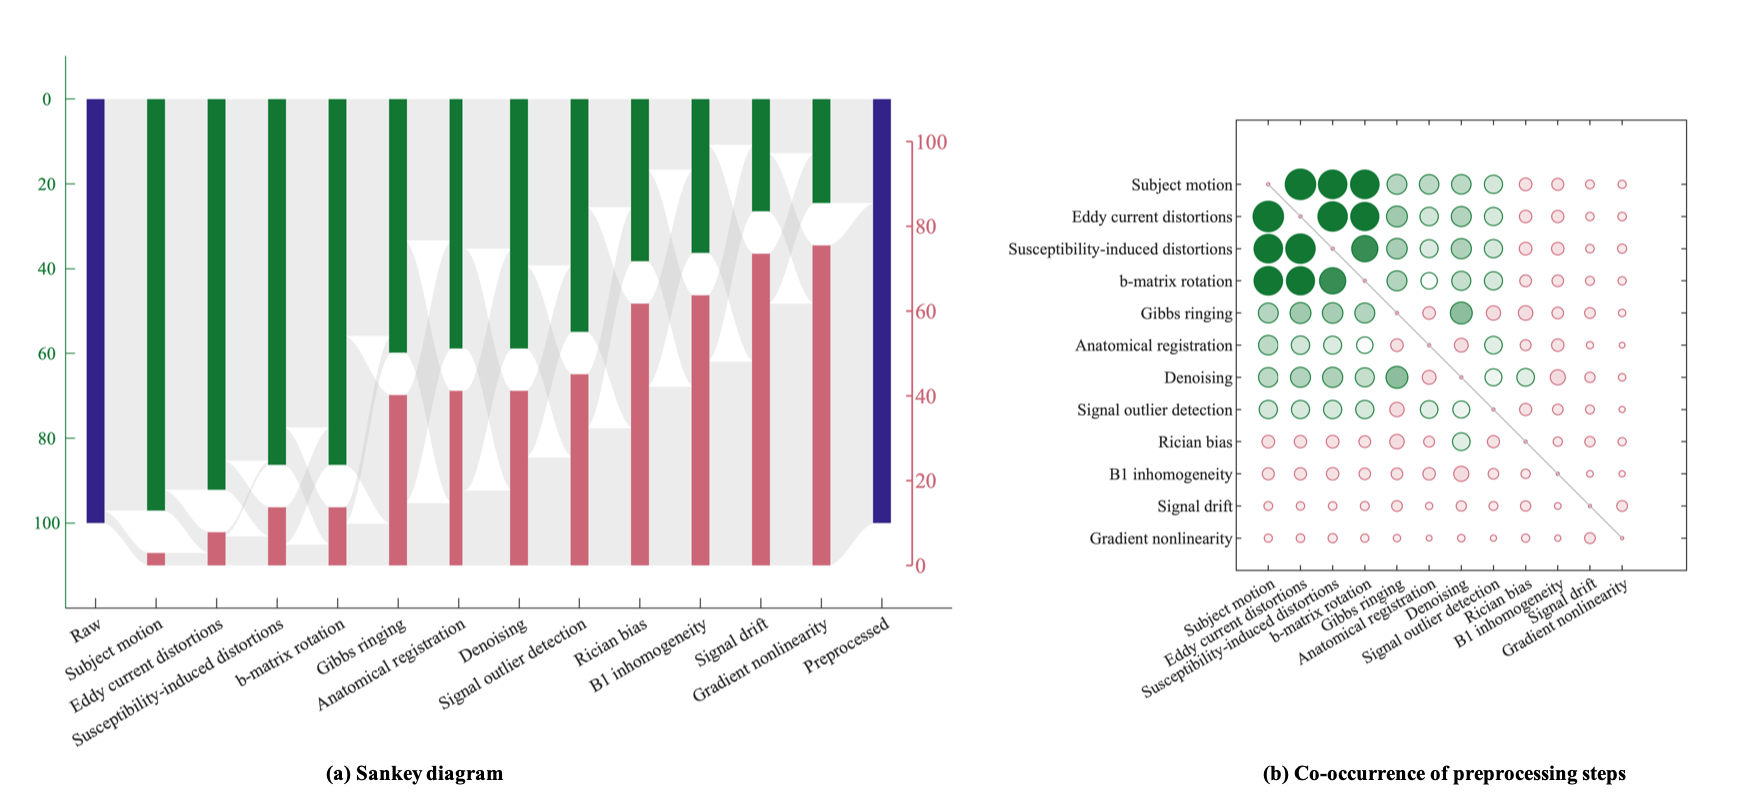
Fig. 1: (a) The variability of the dMRI preprocessing pipeline. The height of the bars indicates the frequency of including (top) or excluding (bottom) a preprocessing step in the pipelines that were provided in the survey, without any classification based on the used correction strategy. The image preprocessing steps are ordered by their prevalence. (b) The normalized co-occurrence matrix of image preprocessing steps within pipelines. The radius of the circles scales with the normalized co-occurrence; the largest circle represents 95%. The diagonal elements are masked.
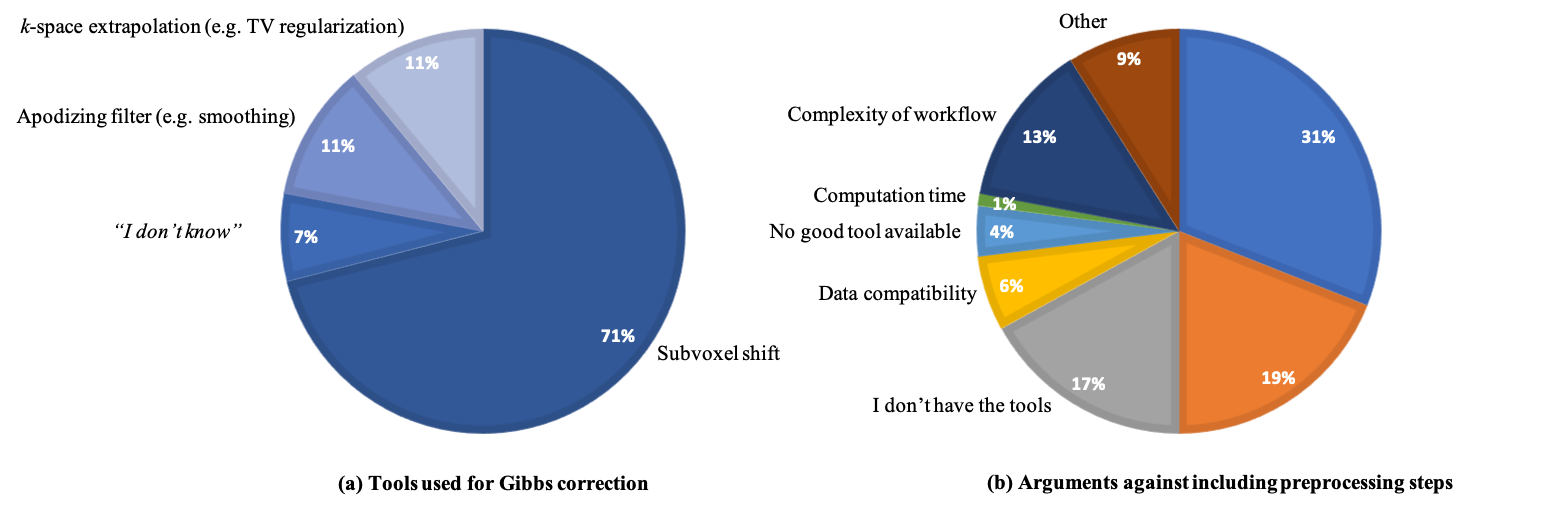
Fig. 2: (a) For each preprocessing step, we asked the survey participants which, if any, strategy or algorithm they typically use. Results for Gibbs ringing are shown; Similar trends are noticeable for all other preprocessing steps (not shown): despite a strong preference towards one particular strategy, there are competing strategies that are widely used. (b) Stated reasons why preprocessing steps are excluded from the participants’ preprocessing pipelines, aggregated over all preprocessing steps.
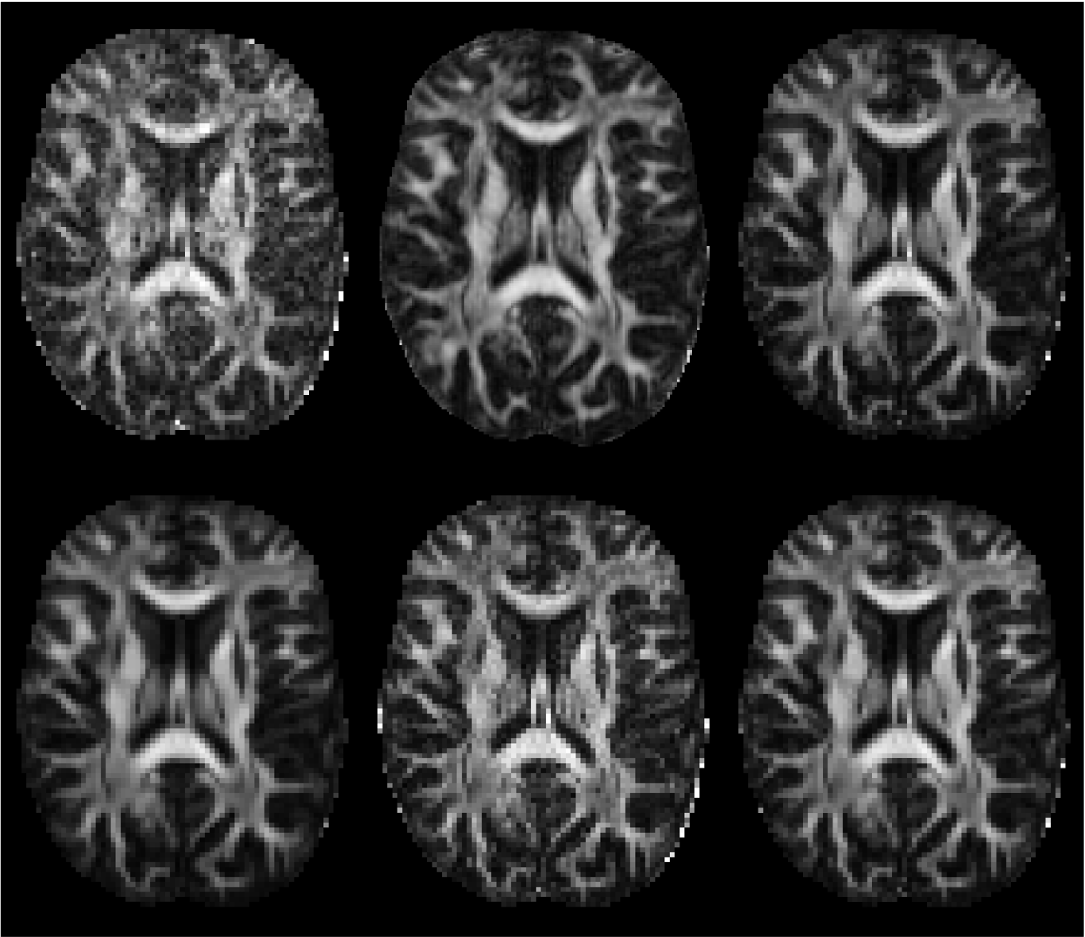
Fig. 3: Fractional anisotropy (FA) maps, derived from the same dMRI data, but estimated from data preprocessed independently by six different research teams. The maps show differences in geometric deformation, signal- and contrast-to-noise ratio, upsampling factor, and intensity. This selection of FA maps shows the general trend of high inter-pipeline variability in the estimation of widely-used diffusion metrics qualitatively. Of note, the same tensor fitting algorithm was used for all preprocessed data set in the computation of FA.
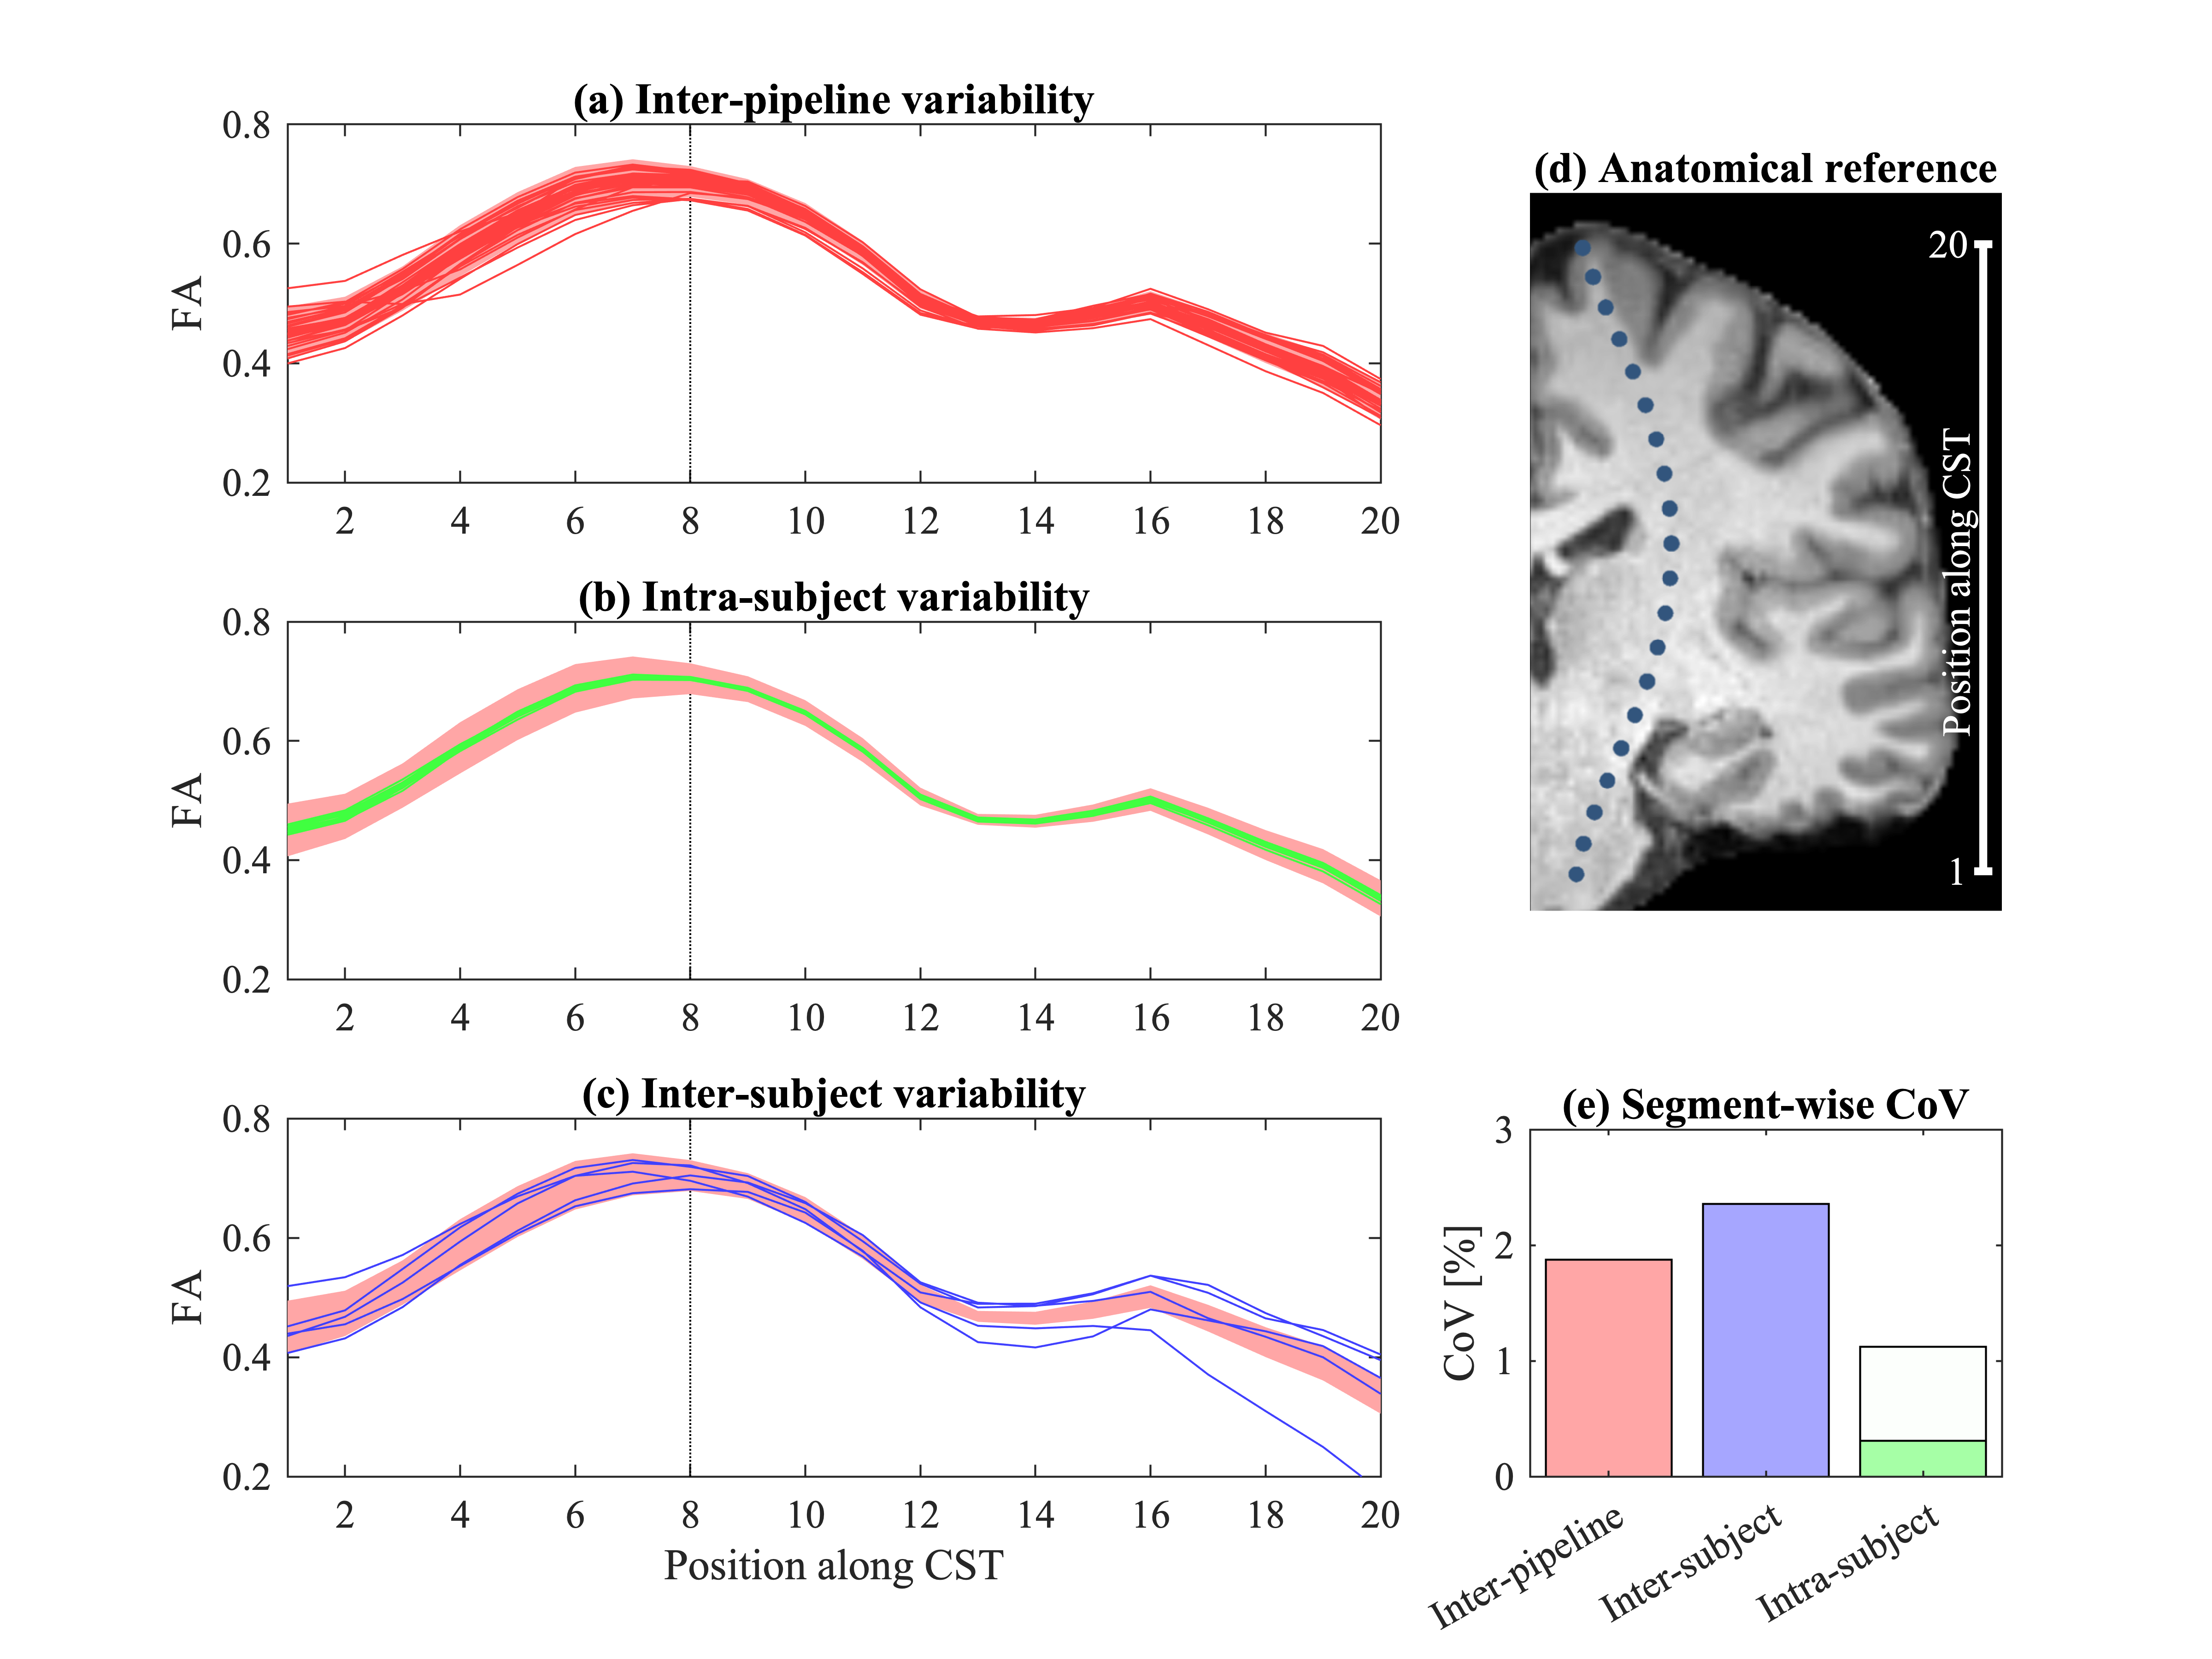
Fig. 4: Profile of FA in the CST of (a) 1 subject/session for all pipelines, (b) repeated sessions for 5 subjects using minimal preprocessing, and (c) the 5 subjects; all data were acquired on the Siemens system. Subject-specific profiles were centered to minimize inter-subject variability. The 95%-interval of the inter-pipeline variability is shown by the shaded profile. (d) The center of the tract segments. (e) The coefficient of variation in the 8th segment. Intra-subject reliability is shown for the results without preprocessing (white) and with minimal preprocessing (green).

Fig. 5: Mean squared difference (MSD) between the FA profiles in the CST derived from two scan sessions for a single subject that was acquired on the Siemens system. Various artifacts and SNR were imposed to be different in shape and strength between the sessions by varying scan settings. The MSD are shown for each individual pipeline (black dots) and summarized by a boxplot (gray). The MSD for the unprocessed data is shown by the red line; the blue line indicates the mean squared difference between two scan sessions without varying scan settings, i.e., a classical repeatability assessment.
DOI: https://doi.org/10.58530/2022/4983