4981
Signal dropout reduction in PSF mapping based reverse gradient fMRI with reversed partial-Fourier acquisition
Myung-Ho In1, Daehun Kang1, Hang Joon Jo2, Uten Yarach3, Nolan K Meyer1,4, Joshua D Trzasko1, John Huston III1, Matt A Bernstein1, and Yunhong Shu1
1Department of Radiology, Mayo Clinic, Rochester, MN, United States, 2Department of Physiology, College of Medicine, Hanyang University, Seoul, Korea, Republic of, 3Department of Radiologic Technology, Faculty of Associated Medical Sciences, Chiang Mai University, Chiang Mai, Thailand, 4Mayo Clinic Graduate School of Biomedical Sciences, Mayo Clinic, Rochester, MN, United States
1Department of Radiology, Mayo Clinic, Rochester, MN, United States, 2Department of Physiology, College of Medicine, Hanyang University, Seoul, Korea, Republic of, 3Department of Radiologic Technology, Faculty of Associated Medical Sciences, Chiang Mai University, Chiang Mai, Thailand, 4Mayo Clinic Graduate School of Biomedical Sciences, Mayo Clinic, Rochester, MN, United States
Synopsis
An interleaved, reverse gradient fMRI (RG-fMRI) with a point-spread-function mapping-based approach was recently proposed to minimize geometric distortion and signal dropout in echo-planar-imaging (EPI) by acquiring a pair of EPIs with the opposite (forward and reverse) phase-encoding gradient polarity and combining them after distortion correction. This study showed that the effective echo-shift map can be reliably obtained from PSF mapping to predict local signal dropouts. The predicted echo-shifting can provide guidance for protocol optimization for RG-fMRI using partial Fourier (PF) acquisition.
Introduction
An interleaved reverse gradient fMRI (RG-fMRI) with a point-spread function (PSF) mapping-based approach (1) was recently proposed to minimize geometric distortion and signal dropout in echo-planar-imaging (EPI) by measuring a pair of EPI acquisitions with the opposite (forward and reverse) phase-encoding gradient polarity, and then combining them after distortion correction. The effectiveness of RG-fMRI was demonstrated both in animal1 and human studies2. Here we show that the effective echo-shift map (ESM) can be reliably obtained from PSF mapping to predict signal dropouts for a given protocol. The predicted echo-shifting can provide guidance for protocol optimization for RG-fMRI using partial Fourier (PF) acquisition.Methods
PSF mapping-based ESM (PSF-ESM): Local susceptibility change leads to variations in the effective echo time (or echo-shift). Instead of an EPI-based ESM (EPI-ESM) directly calculated from the phase information of the EPI data3, this work proposes to calculate the corresponding phase map from the PSF mapping-based shift (or distortion) map in the phase-encoding dimension, which is commonly used for distortion correction in EPI4. The phase map can be converted from the shift map as follows:ϕ(r)=(2π∙∆y(r)∙TEapp)/(Ny∙ESP) [1]
where r indexes a particular voxel, ϕ(r) is the unwrapped phase for each voxel at the applied TE, TEapp, ∆y(r) is the voxel shift in the phase-encoding direction, ESP is the echo spacing, and Ny is the number of voxels in the phase-encoding direction. Then, ∆ϕ(r) is obtained by calculating the phase deviation between two adjacent lines along the phase-encoding direction3, which can be translated into a local TE map, TElocal, and ESM in k-space, ∆ky, respectively with
TElocal=TEapp+(TEapp-t0)∙∆ϕ/π [2]
and
∆ky=Ny/2∙∆ϕ/π [3]
where t0 is a time delay from the isocenter of RF excitation pulse to the beginning of EPI readout. While EPI-ESM can measure the echo shift within the EPI readout acquisition window, the measuring range of PSF-ESM is twice as wide due to the additional spin-warp phase-encoding gradient for PSF mapping, and can even measure the TElocal outside of the readout acquisition window.
Simulation of standard and reversed PF acquisition scheme for RG-fMRI: Regardless of the phase-encoding polarity in gradient-echo EPI, the TElocal is always shorter than TEapp in the stretched areas, and vice versa longer in the compressed area (Fig. 1). For the RG distortion correction approach, when images with opposite geometric distortions (both compressed and stretched) are combined, spatial information in stretched region is more reliable than the information in the compressed regions, because spatial information is lost in the compressed regions1. Compared to standard PF omitting the early echoes, reversed PF omitting the late echoes can preserve the signal from stretched region better than the compressed region as shorter TElocal components are preserved. In this regard, reversed PF yields less signal loss and suits the RG method better than standard PF. To test this, simulations of both the standard and reversed PF acquisition scheme were performed using breath-holding fMRI data with full k-space acquisition, which was obtained in a previous study2 on a compact 3T scanner with high-performance gradients5-7. Three different PF factors (5/8, 6/8, 7/8) were applied and omitted k-space areas were zero-filled before reconstruction. In the high-susceptibility areas, image intensity and functional contrast in distortion-corrected forward (DF), reverse (DR), and combined (DW) data with different PF schemes and factors were compared with the full acquisition data.
Results and Discussion
Strong echo-shifts surpassing half of the k-space acquisition window (i.e., >±48) were measured in highly compressed regions of the PSF-ESM, which explained the regional signal dropouts in forward EPI (Fig. 1B). In distinction, the EPI-ESM provided the echo-shift estimates only within half of the k-space acquisition window even in the regions with complete signal loss (Fig. 1B). The overall patterns of the intensity difference between the distortion-corrected EPI pair (DF and DR) were matched well with PSF-ESM in the non-distorted (i.e., spin-warp phase-encoding) dimension (see contours in Fig. 2), which demonstrated that the signal dropouts in DF and DR are dominantly caused by echo shifts in the phase-encoding direction. Compared to standard PF, the reversed PF acquisition displayed reduced signal loss, and effectively resolved with the RG scheme (Fig. 3). While TR was not changed for the standard PF method as TE is fixed at 30 ms, the TR for the reversed PF method could be reduced from 934 ms to 861 ms (7.9%), 860 ms (15.7%), and 788 ms (23.6%), with PF factors of 7/8, 6/8, and 5/8, respectively. Consequently, while the functional activation in the combined EPI was either partially or entirely lost with standard PF, there was no noticeable difference in the functional activation map even with a 5/8 PF factor compared to the map without PF acquisition (Fig. 4).Conclusion
The effective echo-shift (or TE) map obtained from PSF mapping can be useful to predict signal dropouts for a given protocol and thus applied to minimize the signal loss in a target region of interest for fMRI. Upon this investigation, we demonstrate that the use of the reversed PF acquisition rather than the standard PF would be an alternative viable option to further improve the temporal resolution for RG-fMRI.Acknowledgements
This work was supported by NIH U01 EB024450 and NHI U01 EB026979.References
- In MH, Cho S, Shu Y, et al. Correction of metal-induced susceptibility artifacts for functional MRI during deep brain stimulation. NeuroImage 2017;158:26-36.
- In MH, Kang D, Jo HJ, et al. Improving task-based fMRI reliability at brain regions of high‐susceptibility using a multi-band PSF-mapping-based reverse-gradient approach. 29th scientific meeting of ISMRM 2021:p.2697.
- Deichmann R, Josephs O, Hutton C, Corfield D, Turner R. Compensation of susceptibility-induced BOLD sensitivity losses in echo-planar fMRI imaging. Neuroimage 2002;15(1):120-135.
- In M-H. Geometric distortion correction in EPI at ultra high field. Univ, Fak für Naturwiss, Diss, Magdeburg: Universitätsbibl 2012.
- Foo TKF, Laskaris E, Vermilyea M, et al. Lightweight, compact, and high-performance 3T MR system for imaging the brain and extremities. Magn Reson Med 2018;80(5):2232-2245.
- Lee SK, Mathieu JB, Graziani D, et al. Peripheral nerve stimulation characteristics of an asymmetric head‐only gradient coil compatible with a high‐channel‐count receiver array. Magnetic resonance in medicine 2016;76(6):1939-1950.
- Weavers PT, Shu Y, Tao S, et al. Compact three‐tesla magnetic resonance imager with high‐performance gradients passes ACR image quality and acoustic noise tests. Medical physics 2016;43(3):1259-1264.
Figures

Fig 1. Signal
dropouts in the EPI pair with forward (NF) and reverse phase-encoding polarity
(NR) due to echo time shifts induced by local susceptibility gradients.
Undistorted reference (Ref.), distortion map (DM), and echo shift map (PSF-ESM)
are calculated from the PSF mapping data in the non-distorted (A) and the
distorted forward (B) and reverse phase-encoding space (C). For comparison,
additional ESM obtained from EPI (EPI-ESM) is shown. It is noted
that the scale of PSF-ESM (A) is ±96, but matched to the scale of EPI-ESM (±48) to demonstrate the difference in (B) and (C).

Fig 2.
Difference of signal dropouts in the EPI pair with opposite phase-encoding
polarities: forward (NF), reverse (NR), distortion-corrected (DF and DR), combined EPI (DW), undistorted reference (Ref.),
subtraction image between DF and DR (DF-DR), and PSF-based echo shift map
(PSF-ESM). Blue- and red-colored contours calculated from the PSF-ESM indicate
the areas of signal loss dominantly in the DF and DR, respectively and are
overlaid onto the DF, the DR, the DF-DR, and the PSF-ESM. The threshold value
(±19.3) for generating the contours is manually chosen by visual inspection.
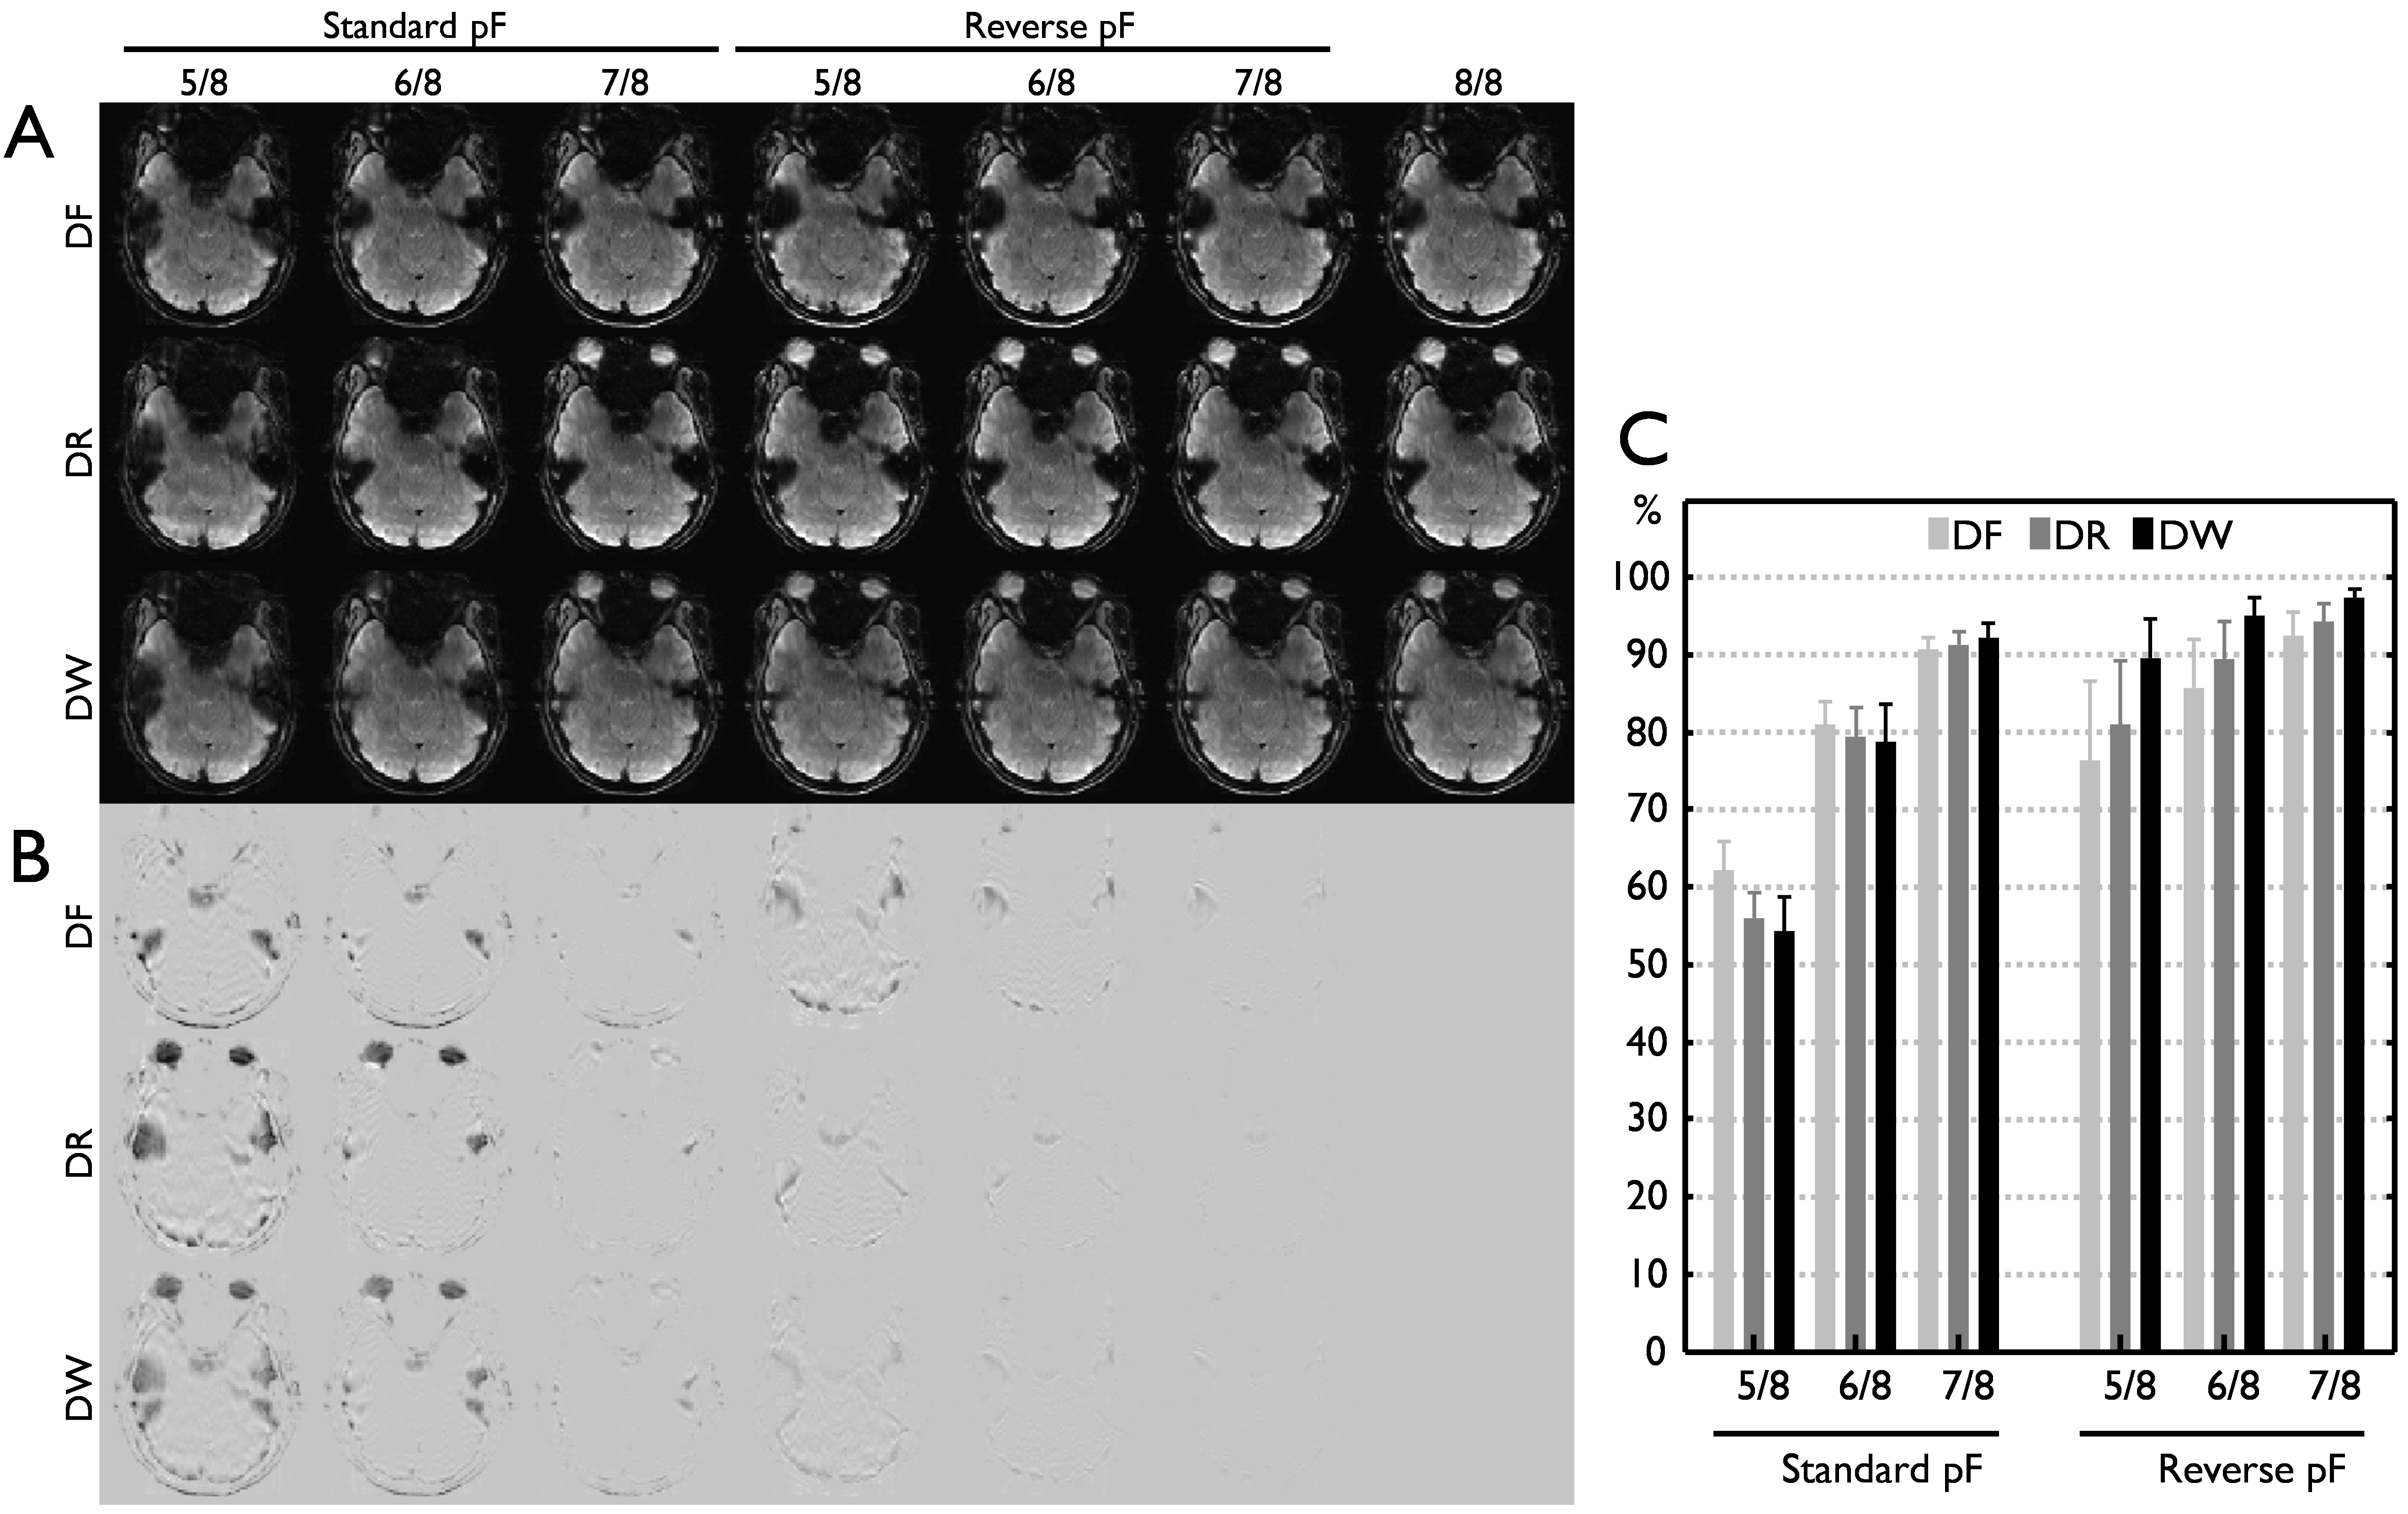
Fig 3.
Difference of signal intensity loss with the standard and reversed PF
acquisition in the RG approach. For a clear demonstration, a
represented slice in the region of temporal lobe with high susceptibility
effects is chosen from a subject. While all three data including DF, DR, and DW
with various PF factors are shown in (A), Image subtraction with the
corresponding full acquisition data is present to demonstrate the signal losses
due to PF acquisition in (B). In (C), the signal losses are quantitatively
calculated from six subjects in a brain mask with high susceptibility effects.
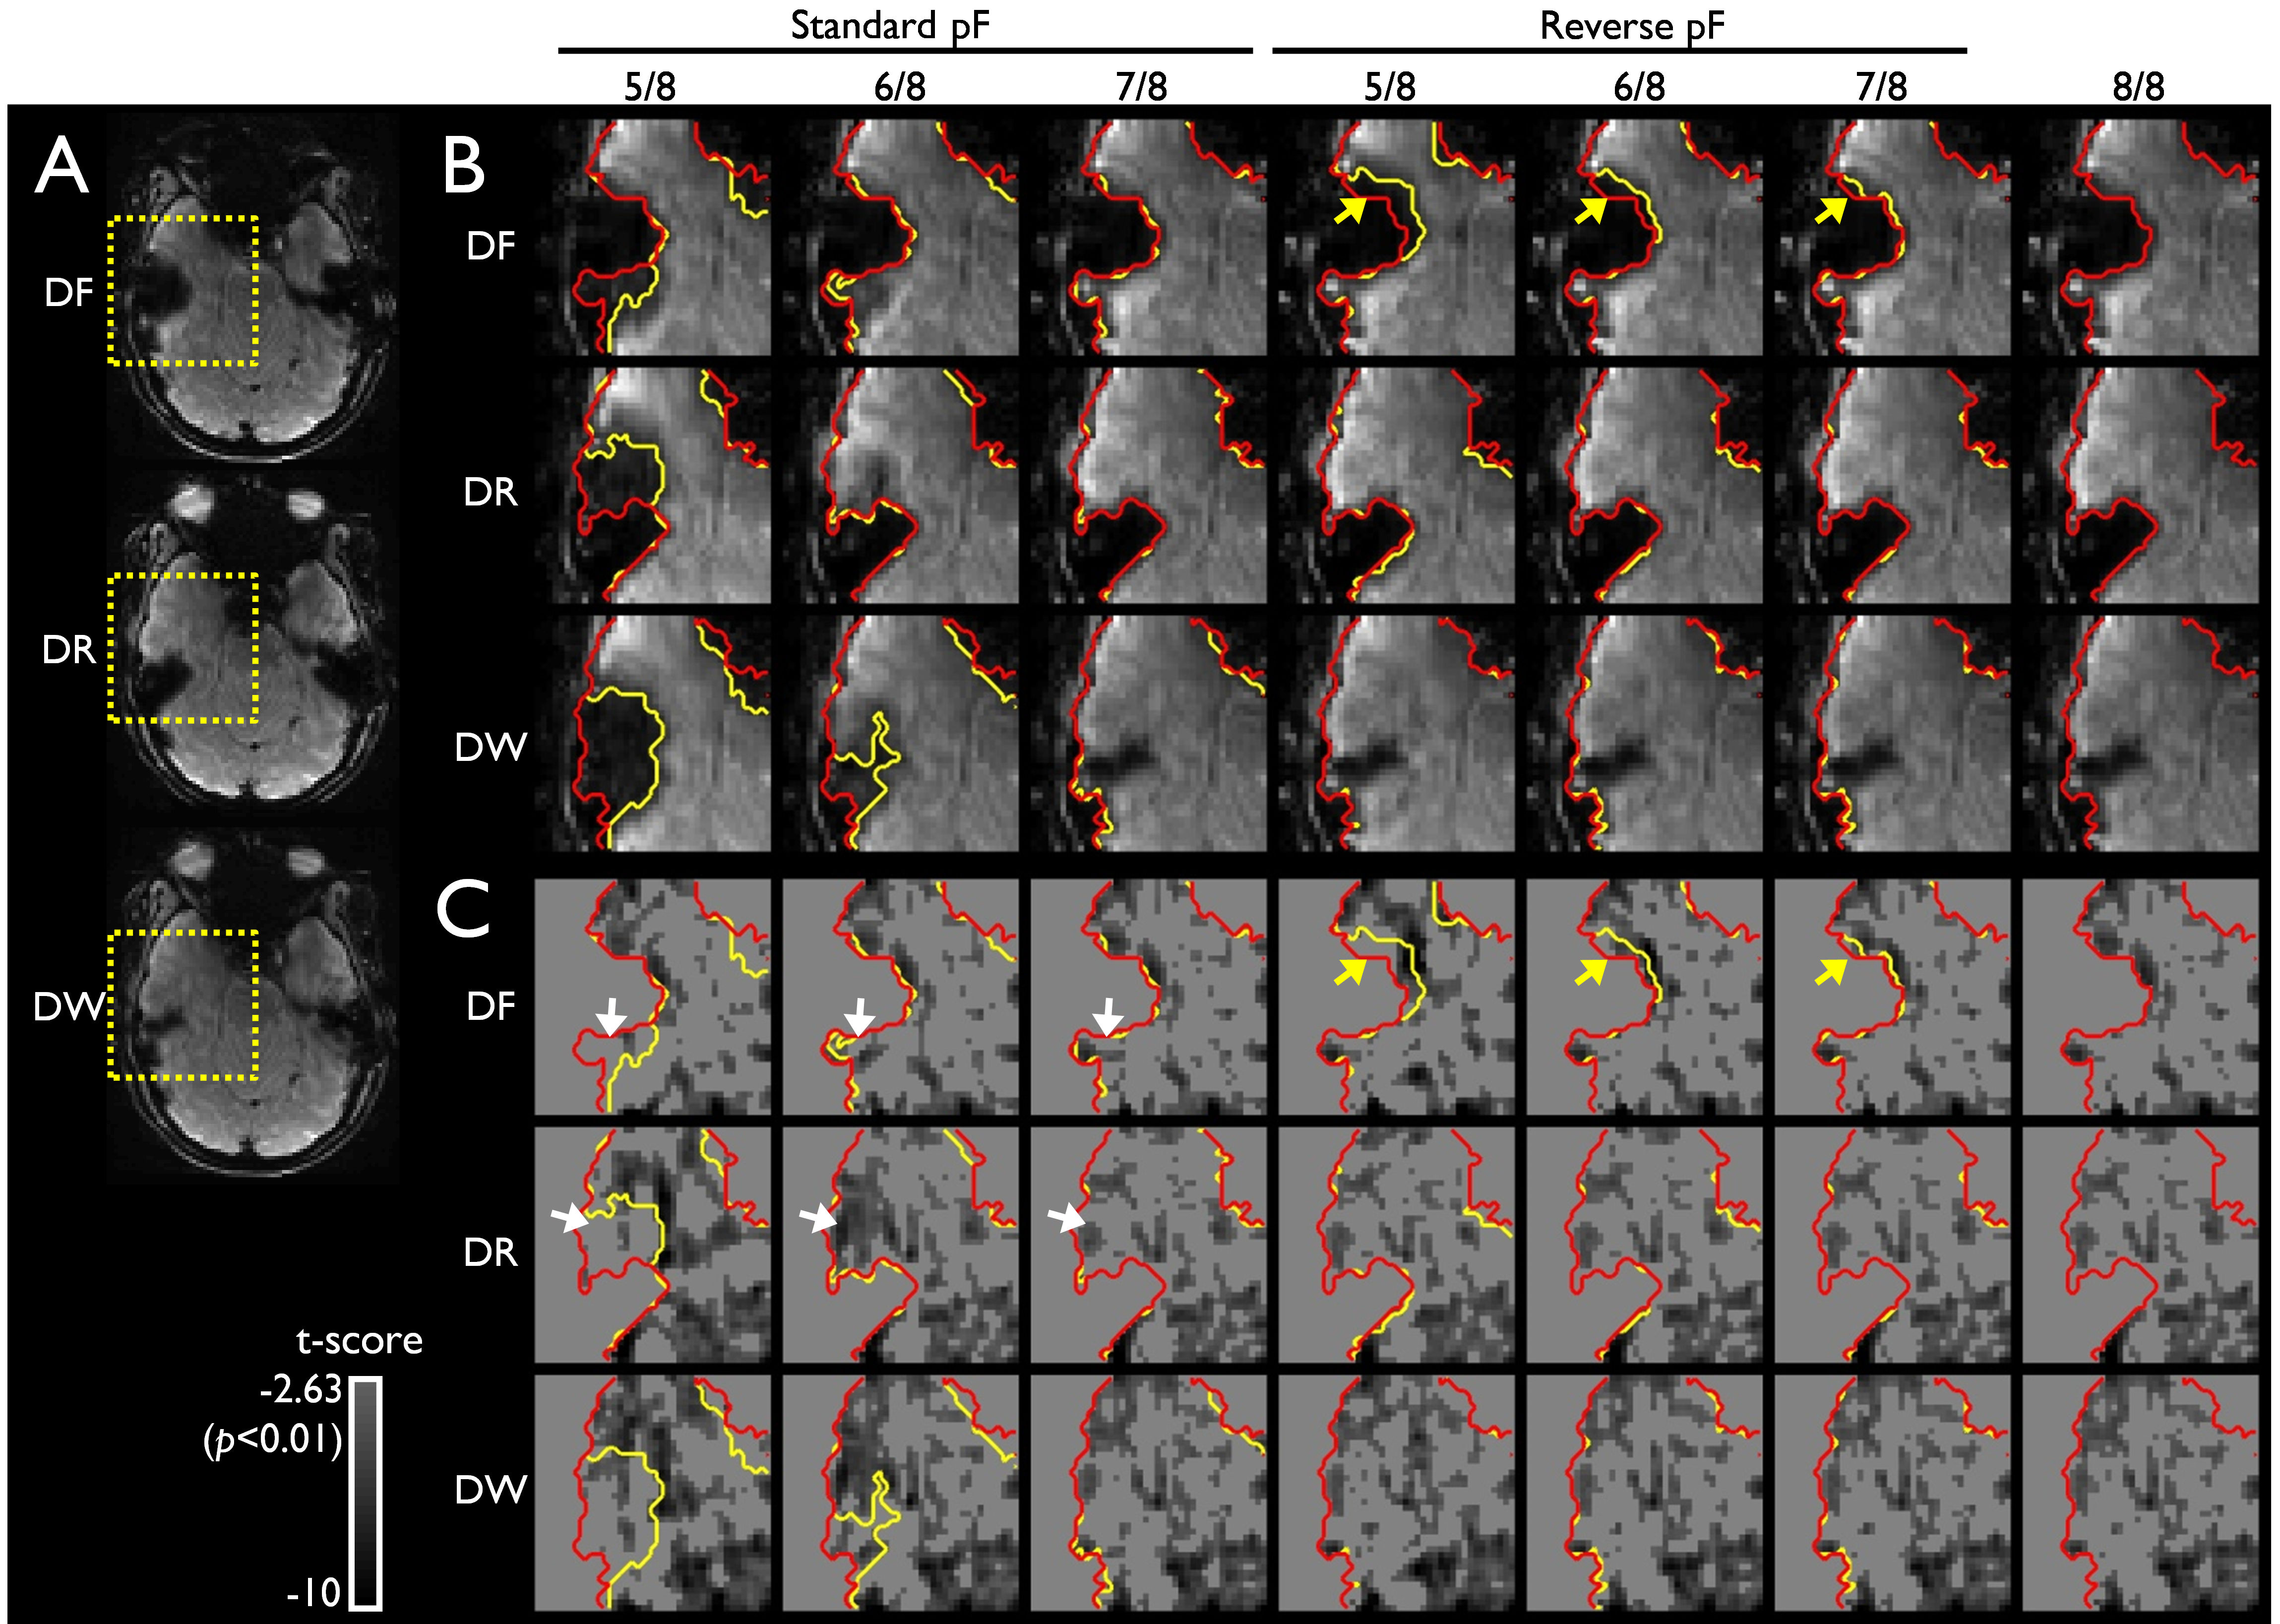
Fig 4. Effects of BOLD contrast with PF acquisition in the
RG approach. The full FOV images (A) and an enlarged section of the temporal lobe to access the changes of the signal intensity (B) and corresponding
function contrast associated with the PF acquisition (C) are shown. Red- and
yellow-contours demonstrate the boundary of the images without and with
different PF factors and are overlaid onto the zoomed images (B) and functional
contrasts (C). Arrows indicate the areas, in where the signal intensity (B) and
corresponding functional contrast (C) vary with the PF factors noticeably.
DOI: https://doi.org/10.58530/2022/4981