4975
COMEDI: A Toolkit for Lifespan Computational Diffusion MRI
Ye Wu1, Sahar Ahmad1, Khoi Minh Huynh1, Tiantian Xu1, and Pew-Thian Yap1
1Department of Radiology and Biomedical Research Imaging Center (BRIC), University of North Carolina at Chapel Hill, Chapel Hill, NC, United States
1Department of Radiology and Biomedical Research Imaging Center (BRIC), University of North Carolina at Chapel Hill, Chapel Hill, NC, United States
Synopsis
Processing and analyzing diffusion MRI (dMRI) data is important for uncovering the neural underpinnings of white matter (WM) development and degeneration across the human lifespan. Here, we introduce a robust and integrative toolkit, called Computational Medical Imaging (COMEDI), for processing, analyzing, and visualizing lifespan dMRI data.
Introduction
Diffusion MRI (dMRI) is a primary tool for noninvasive and in vivo investigation of tissue microstructure and white matter (WM) pathways in the human brain1,2. Making sense of dMRI data often involves intensive processing, fine-grained analysis, and multi-perspective visualization. Despite the availability of many software packages for dMRI processing, few are effective for the entire human lifespan, particularly the first years of life where the diffusion characteristics are markedly different from adults. Here, we introduce a robust and integrative dMRI processing toolkit --- Computational Medical Imaging (COMEDI) --- that has been tested on dMRI data spanning the entire human lifespan from birth to 100 years of age. COMEDI covers recent advances in dMRI processing and analysis, including asymmetric fiber orientation distribution functions, cortico-cortical tractography with explicit consideration of gyral bias, advanced microstructural analysis, consistent bundle identification across the human lifespan, dedicated analysis pipelines for baby dMRI, and subject-specific whole-brain parcellation. COMEDI will be made publicly available as a non-commercial software package after the ISMRM meeting to support lifespan dMRI studies.Methods
COMEDI is a one-stop platform for dMRI processing, analysis, and visualization. It supports multiple file formats (DICOM, Analyze, NIFTI, NRRD/NHDR, MRtrix, etc.) and interoperates with various off-the-shelf software packages (Dipy3, MRtrix34, FSL5, FreeSurfer6, DSI-Studio7, and Camino8) (Fig. 1). Developed in MATLAB, COMEDI can be deployed on multiple operating systems (MS Windows, Unix, and macOS). COMEDI has been evaluated on dMRI data of the entire human lifespan from birth to 100 years of age. It provides specialized tools for several tasks: (i) Image quality control (IQC) for distinguishing between good and poor quality data. (ii) Post-acquisition anatomy-guided correction of eddy-current and susceptibility-induced geometric distortions. (iii) Tissue microstructural analysis, and (iv) tractography. All these algorithms are accessible via the command-line interface (CLI). We also integrated a visualization platform for rendering brain cortical surfaces, diffusion glyphs for intra-voxel architecture and image maps, and fiber streamlines for visualizing specific fiber properties. COMEDI offers snapshots and animation tools for easily exporting key results. Moreover, a D3.js framework is integrated into COMEDI for generating dynamic and interactive data visualizations accessible via web browsers. COMEDI also supports batch processing following the BIDS structure (https://bids.neuroimaging.io/). Along with the processing workflows, we also provide WM tract atlases across the lifespan9.Results
We show the results generated via COMEDI in Figs. 2, 3, and 4.Conclusion
COMEDI is a MATLAB-based toolkit for computational diffusion MRI. It contains generic methods for signal processing, machine learning, statistical analysis, and visualization of dMRI data. COMEDI is completed with detailed documentation, worked examples, and screenshots to facilitate quick acquaintance with its many features.Acknowledgements
This work was supported in part by the United States National Institutes of Health (NIH) through grant MH125479.References
1. Yeatman JD, Wandell BA, Mezer AA. Lifespan maturation and degeneration of human brain white matter. Nat Commun. nature.com; 2014;5:4932.2. Lebel C, Gee M, Camicioli R, Wieler M, Martin W, Beaulieu C. Diffusion tensor imaging of white matter tract evolution over the lifespan. Neuroimage. Elsevier; 2012;60:340–352.
3. Garyfallidis E, Brett M, Amirbekian B, et al. Dipy, a library for the analysis of diffusion MRI data. Front Neuroinform. 2014;8:8.
4. Tournier J-D, Smith RE, Raffelt DA, et al. MRtrix3: A fast, flexible and open software framework for medical image processing and visualisation. Neuroimage. Elsevier; 2019;202:116137.
5. Jenkinson M, Beckmann CF, Behrens TEJ, Woolrich MW, Smith SM. FSL. Neuroimage. Elsevier; 2012;62:782–790.
6. Fischl B. FreeSurfer. Neuroimage. Elsevier; 2012;62:774–781.
7. Yeh F-C, Irimia A, Bastos DC de A, Golby AJ. Tractography Methods and Findings in Brain Tumors and Traumatic Brain Injury. Neuroimage. Epub 2021 Oct 18.:118651.
8. Cook PA, Bai Y, Nedjati-Gilani S, et al. Camino: Open-Source Diffusion-MRI Reconstruction and Processing. 14th Scientific Meeting of the International Society for Magnetic Resonance in Medicine. Seattle, WA, USA; 2006. p. 2759.
9. Wu Y, Ahmad S, Lin W, Yap P-T. White Matter Tract Atlases of a Century of Human Life. The 27th Annual Meeting and Educational Courses of OHBM 2021 [online]. 2021
Figures
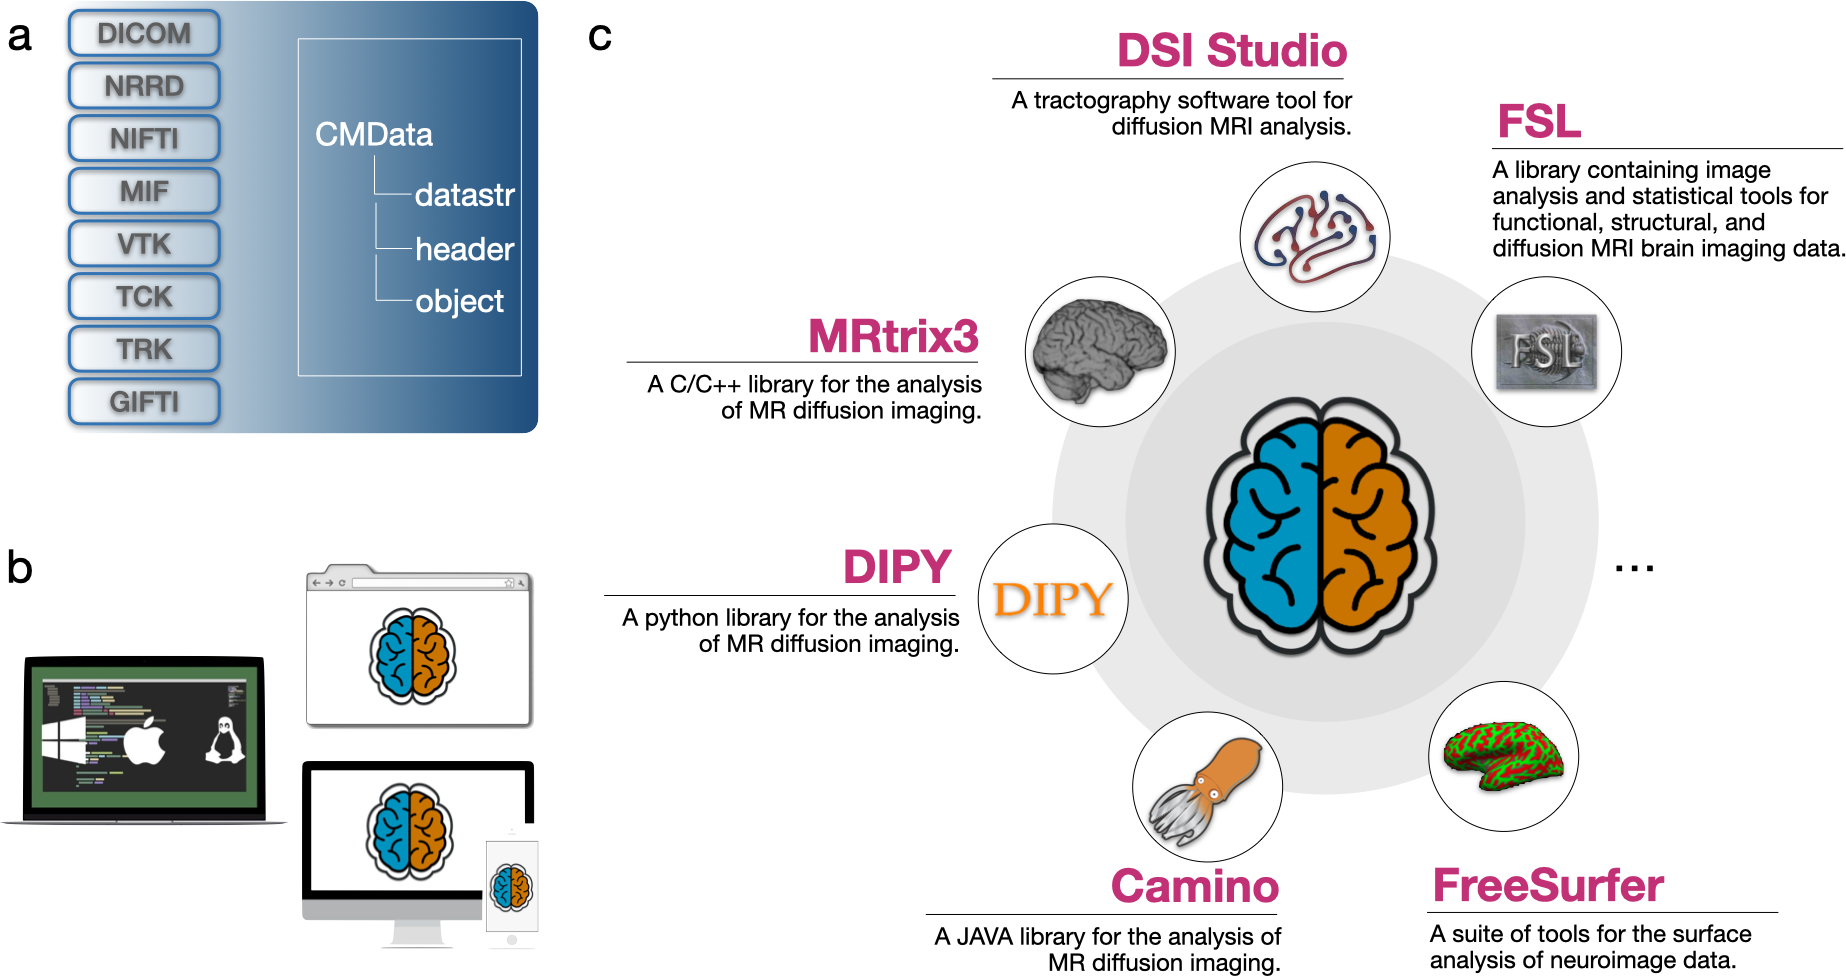
Fig. 1. Software architecture and design. (a) Uniform I/O for reading/writing common medical image file formats. (b) Interoperable across multiple platforms. (c) Interfaces for integration with other libraries developed with different programming languages.

Fig. 2. Example results generated with COMEDI: (a) Corticospinal tract; (b) Removal of false-positive streamlines; (c) Removal of outlier streamlines; (d) Streamline smoothing; (e) Hemispheric splitting; (f) Isotropic restricted diffusion; (g) Free water; (h) Anisotropic restricted diffusion; and (j-k) Structural connectivity.
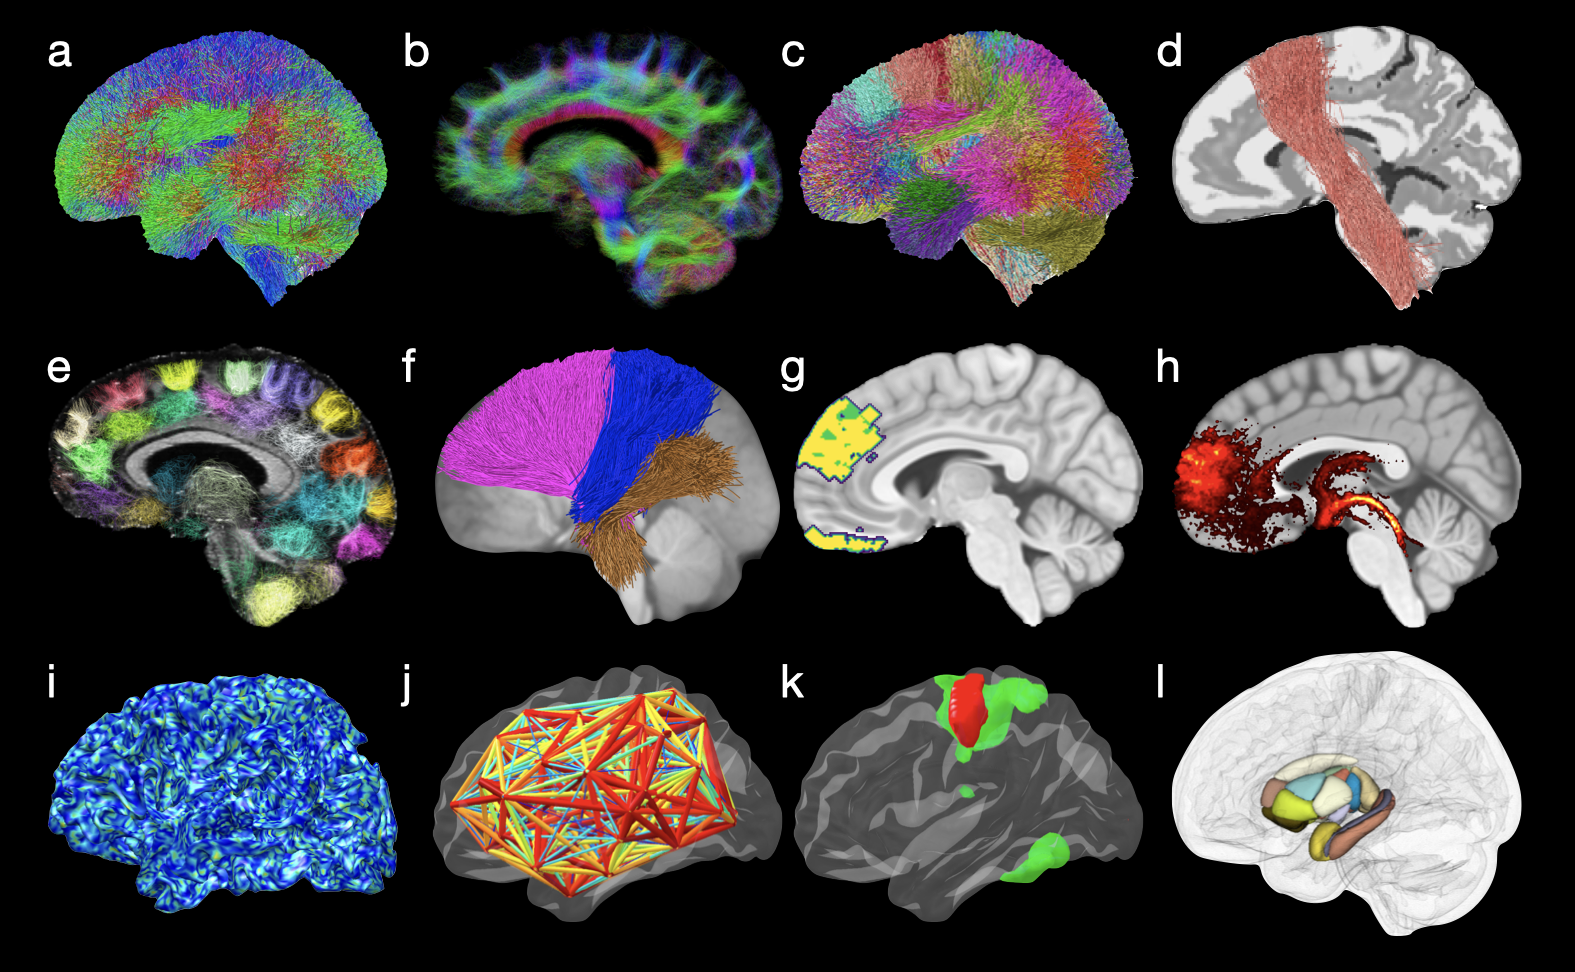
Fig. 3. Example results generated with COMEDI: (a) Whole-brain tractogram; (b) Slab tractogram visualization; (c) Fiber clustering; (d) Example fiber cluster; (e) Example short-association bundles; (f) Example fiber clusters; (g-h) Slice visualization with volumetric maps; (i) Mapping of endpoints on cortical surface; (j) Visualization of cortico-cortical networks; (k) Visualization of cortical labels; (l) Subcortical parcellation.
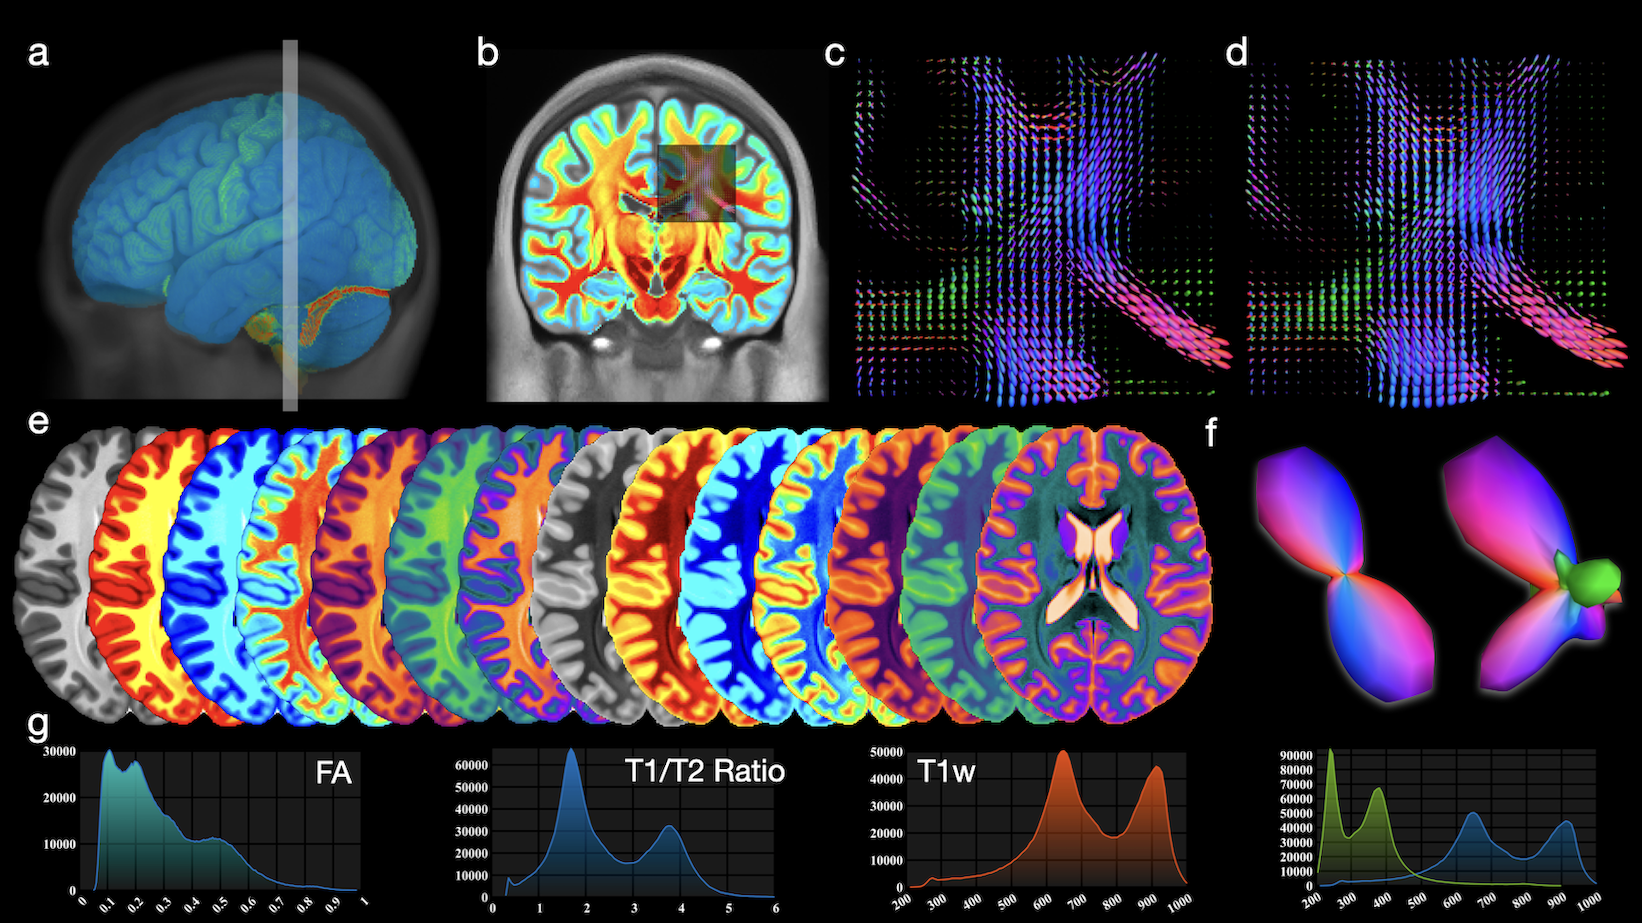
Fig. 4. Example results generated with COMEDI: (a) Volume mesh visualization; (b) Multimodal visualization with auto-alignment; (c) Symmetric FODF glyphs; (d) Asymmetric FODF glyphs; (e) Colormaps; (f) Example symmetric and asymmetric FODF glyphs; (g) Chart visualization.
DOI: https://doi.org/10.58530/2022/4975