4974
Estimating Arterial Transit Time (ATT) From ASL MRI Acquired at A Single Post-Labeling-Delay Time1UMB, Baltimore, MD, United States, 2Radiology, University of Maryland of Baltimore, Baltimore, MD, United States
Synopsis
We proposed a novel method to compute arterial transit time from ASL MRI acquired at a single post-labeling-delay time. Using the method, we found significant difference between NC and AD subjects.
Synopsis
We proposed a novel method to compute arterial transit time from ASL MRI acquired at a single post-labeling-delay time. Using the method, we found significant difference between NC and AD subjects.Introduction
Accuracy of cerebral blood flow (CBF) quantification in arterial spin labeling (ASL) perfusion MRI depends on the arterial transit time (ATT). Estimating ATT often requires ASL data acquired at different post-labeling-delay (PLD) time at the expense of an exponentially prolonged scan time, which may not be practical for many studies. For this reason, the majority of ASL MRI are still acquired with a single PLD. The purpose of this study was to provide a novel method to approximately estimate ATT from single PLD ASL. The method only applies to ASL data acquired with 2D imaging sequences as it relies on the slice acquisition time difference of the 2D slices to estimate the arterial input function. The method was evaluated in ASL MRI from normal elderly control subjects (NC) and patients with Alzheimer’s Disease (AD) because it is known that AD had longer ATT than NC. We hypothesized that our method can identify the ATT difference between NC and AD.Methods
As an approximation, grey matter (GM) (or white matter (WM)) voxels within a 2D imaging slice are considered as different observations of a latent universal voxel. Meanwhile, the slice acquisition time in 2D imaging automatically forms a multiple-PLD imaging scheme. The samples of the latent voxel at different PLDs can then be used to fit the arterial input function and subsequently the ATT. ASL data from 45 subjects (age range: 51 – 83 y; 25 females and 20 males); 20 subjects with Alzheimer’s Disease subjects and 25 NC were used to validate this concept and the method. The data were acquired in a Siemens 3T Trio scanner with a pseudo continuous ASL sequence based on a 2D Gradient Echo-Plannar Imaging readout1 with the following parameters: 40 control/labeled image pairs, labeling time = 1.5 sec, post-labeling delay = 1.5 sec, FOV = 22 cm, matrix = 64x64, TR/TE = 4000/11 ms, 20 slices with a thickness of 5 mm plus 1 mm gap. The real PLD for the voxels in each slice was the sum of 1.5 sec and the slice acquisition time in relative to the first slice. GM segmentation maps were used to select GM voxels with a cutoff >0.8. After excluding negative values, the remaining voxels’ perfusion weighted data were fitted to the kinetic model2 using the Curve Fitting toolbox in MATLAB 2021b. The fitted ATT was imported to ASLtbx3 to recalculate CBF. ATT estimation was applied to grey matter only though it can be done similarly for white matter voxels.Results and Discussion
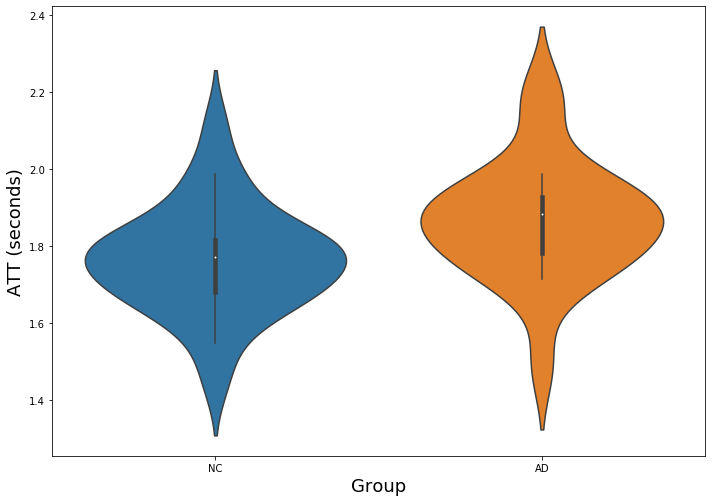
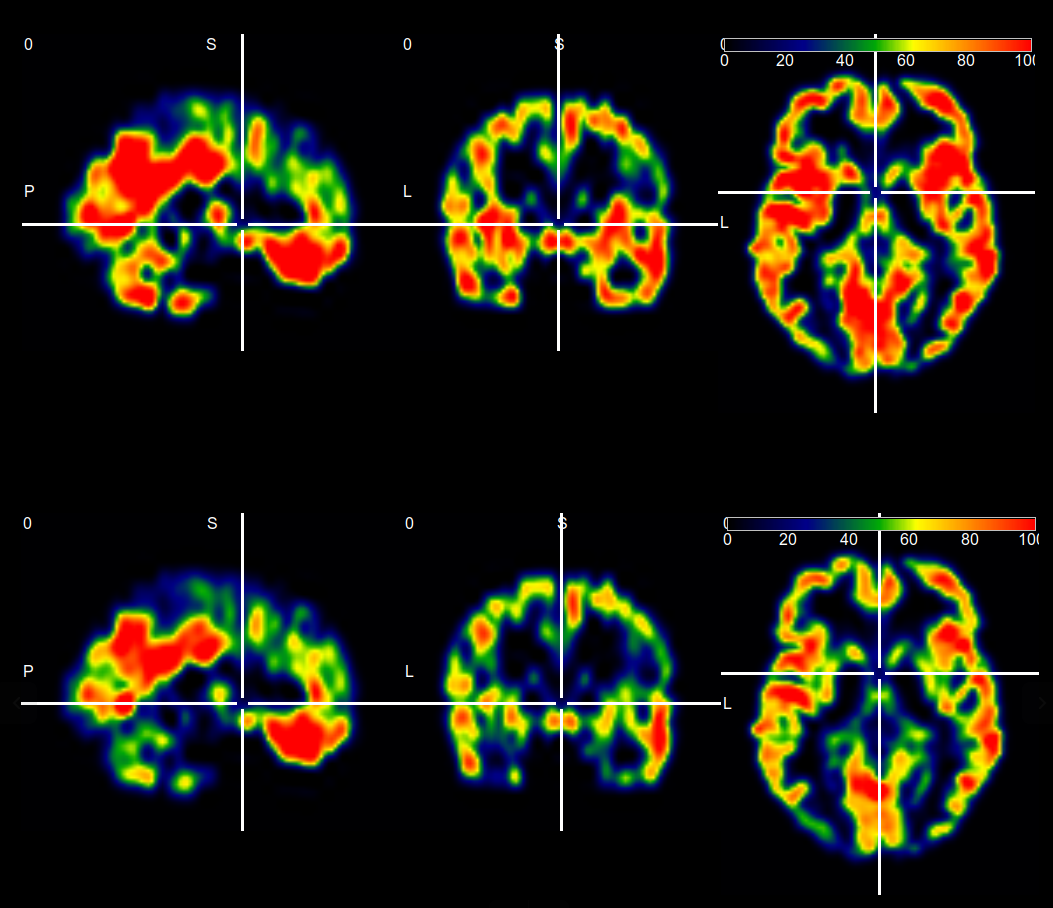
Fig. 1 shows the GM ATT estimation results. Both NC and AD groups showed a mean GM ATT longer than 1.5 sec (the single PLD used in image acquisition). AD had significantly longer GM ATT than NC (p = 0.0253, two-sample t-test). For both groups, the estimated ATT still presented large variations. This may be contributed by the variations of the GM voxel perfusion signal either due to noise or due to genuine signal variations. It may also be caused by the imperfection of the kinetic model. Fig 2 shows CBF maps from a representative subject with (top row) and without (bottom row) ATT correction. Without ATT correction means that the ATT was assumed to be no longer than the PLD. ATT correction improved CBF value in many parts of GM.These data clearly proved the validity of using a single PLD 2D ASL MRI to estimate the average ATT. As an initial step, this pilot work needs further validations or optimizations in the future. For example, ATT estimation may need to be verified with synthetic data. For in vivo data, the estimation value should be compared to those estimated from multiple-PLD data. In addition, a test-retest stability is necessary to establish the reproducibility of the method. Since this method only provides an estimation of the average ATT for all GM voxels, it should not never be treated as an alternative to the multiple-PLD based approach.
Conclusion
It is possible to estimate the average ATT from 2D ASL MRI data acquired at a single PLD.Acknowledgements
This work was supported by the following grants: R01AG060054, R01AG070227, 1R01EB031080, 1P41EB029460-01A1.References
1. WU, Wen-Chau, Maria FERNÁNDEZ-SEARA, John A DETRE, Felix W WEHRLI a Jiongjiong WANG. A theoretical and experimental investigation of the tagging efficiency of pseudocontinuous arterial spin labeling. Magnetic Resonance in Medicine: An Official Journal of the International Society for Magnetic Resonance in Medicine. 2007, 58(5), 1020–1027.
2. Chappel M, MacIntosh, B, Okell, T, et al. Introduction to perfusion quantification using arterial spin labelling. Oxford University Press. 2018
3. Wang Z, Aquirre G, Geoffrey K, et al. Empirical optimization of ASL data analysis using an ASL data processing toolbox: ASLtbx. Magnetic resonance imaging. 2008;26(2):261-269.
Figures