4973
Hippocampus Shape Characterization with 3D Zernike Transformation in Clinical Alzheimer’s Disease Progression1Michigan State University, East Lansing, MI, United States, 2Chien Hsin University of Science and Technology, Taoyuan, Taiwan, 3University of Texas Southwestern Medical Center, Dallas, TX, United States
Synopsis
Alzheimer’s disease (AD) is a neurodegenerative disease and the most common cause of dementia among older adults. We implemented 3D Zernike transformation to characterize the shape changes of hippocampus in 428 older subjects with high-quality T1-weighted volumetric brain scans. The hippocampus shape features characterized with 3D Zernike transformation, in complement to volume measures, may serve as a novel imaging marker to monitor clinical AD progression.
INTRODUCTION
Alzheimer’s disease (AD) is a neurodegenerative disease and the most common cause of dementia among older adults. Mild cognitive impairment (MCI) is considered a transitional phase between healthy cognitive aging and dementia. Progressive brain volume reduction/atrophy, particularly of hippocampus, is associated with the transition from normal to MCI, and then to AD (1-3). We aimed to develop methods to characterize the shape of hippocampus and explore its potential as an imaging marker to monitor clinical AD progression.METHODS
We implemented 3D Zernike transformation (4) to characterize the shape changes of hippocampus in 428 older subjects with high-quality T1-weighted volumetric brain scans from the Alzheimer’s Disease Neuroimaging Initiative (ADNI) database (adni.loni.usc.edu) (151 normal, 258 MCI, and 19 AD). Over two years, 15 cognitively normal subjects converted to MCI and 42 subjects with MCI converted to AD. Based on the cognitive conditions assessed at baseline (Month 0) and Month 24, subjects were divided into the following groups: Normal-Normal cognition (N-N), Normal cognition-MCI (N-M), MCI-Normal cognition (M-N), MCI-MCI (M-M), MCI-Dementia (M-D), Dementia-Dementia (D-D).RESULTS
Different groups changed their hippocampus shapes in different patterns (Fig. 1). The N-N and M-M groups tended to shrink in the central region. The M-D and D-D groups tended to enlarge at the tails but also shrink in the central region. The shape change distributions are shown in Fig. 2. The M-D and D-D groups show the highest changes in shape. We found a significant correlation between hippocampal volume changes and Zernike shape metrics. Before a clinical diagnosis of AD, the shapes of the left and right hippocampi changed slowly. After AD diagnosis, both volume and shape changed rapidly, but were uncorrelated to each other. During the transition from a clinical diagnosis MCI to AD, the shape of the left and right hippocampi changed in a correlated manner but became uncorrelated after AD diagnosis. Finally, the pace of hippocampus shape change was associated with its shape and the subject’s age and disease condition.CONCLUSION
The hippocampus shape features characterized with 3D Zernike transformation, in complement to volume measures, may serve as a novel imaging marker to monitor clinical AD progression.Acknowledgements
This work was partially supported by National Institutes of Health grant R01AG057571. Data collection and sharing for this project was funded by the Alzheimer's Disease Neuroimaging Initiative (ADNI) (National Institutes of Health Grant U01 AG024904) and DOD ADNI (Department of Defense award number W81XWH-12-2-0012).
References
1. Jack CR, Jr., Shiung MM, Weigand SD, O'Brien PC, Gunter JL, Boeve BF, Knopman DS, Smith GE, Ivnik RJ, Tangalos EG, Petersen RC. Brain atrophy rates predict subsequent clinical conversion in normal elderly and amnestic MCI. Neurology 2005;65(8):1227-1231.
2. Jack CR, Jr., Shiung MM, Gunter JL, O'Brien PC, Weigand SD, Knopman DS, Boeve BF, Ivnik RJ, Smith GE, Cha RH, Tangalos EG, Petersen RC. Comparison of different MRI brain atrophy rate measures with clinical disease progression in AD. Neurology 2004;62(4):591-600.
3. Jack CR, Jr., Petersen RC, Xu YC, O'Brien PC, Smith GE, Ivnik RJ, Boeve BF, Waring SC, Tangalos EG, Kokmen E. Prediction of AD with MRI-based hippocampal volume in mild cognitive impairment. Neurology 1999;52(7):1397-1403.
4. Deng AW, Gwo CY. Efficient computations for generalized Zernike moments and image recovery. Appl Math Comput 2018;339:308-322.
Figures

Fig. 1. The regions affected over 24 months can be visualized via color coding on the mean left (L) and right (R) hippocampi for different groups. The color coding shows changes from the centroids in mm. Groups are categorized by the changes of cognitive conditions over 24 months with N = normal, M = mild cognitive impairment and D = dementia.
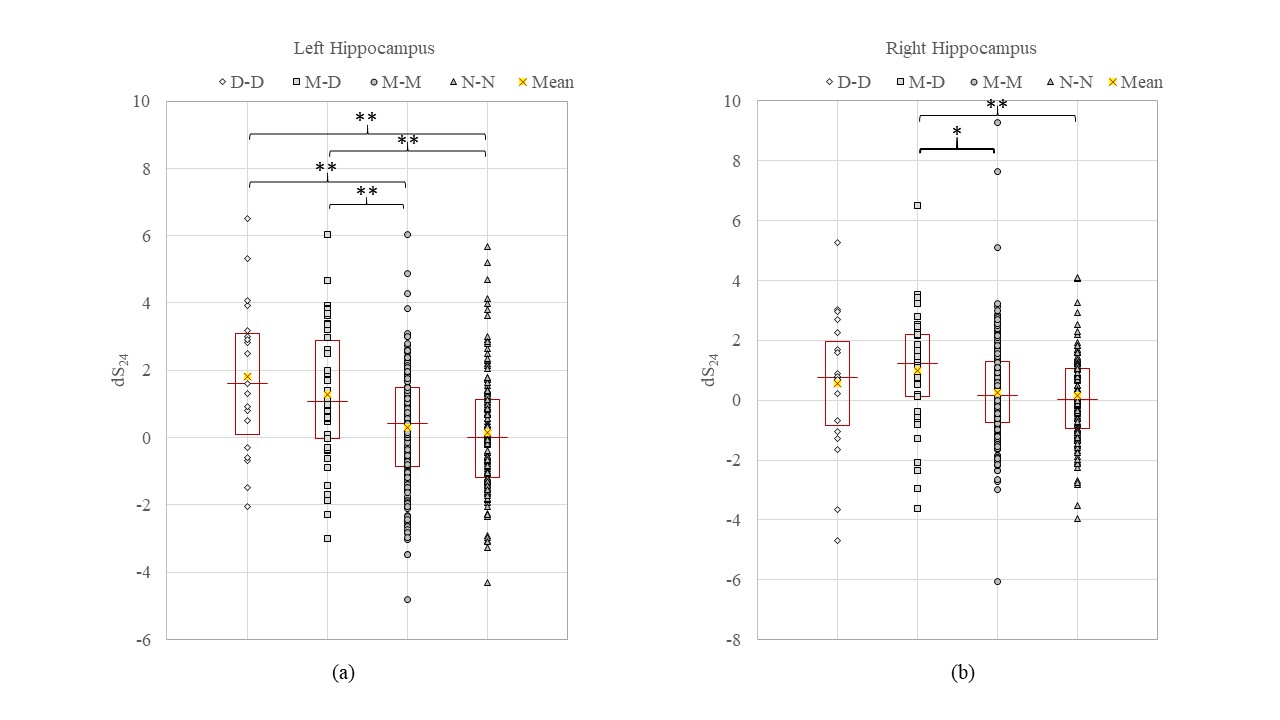
Fig. 2. The distributions of shape changes over 24 months (dS24) in the left (a) and right (b) hippocampi for each group. Groups are categorized by the changes of cognitive conditions over 24 months with N = normal, M = mild cognitive impairment and D = dementia. Significant pair-wise comparisons are indicated: * significant (p < 0.05) and ** highly significant (p < 0.01).