4970
Application of SAME-ECOS to 7T gradient-echo based myelin water imaging: a comparison of model-free and model-based approaches1McConnell Brain Imaging Centre, Montreal Neurological Institute and Hospital, Montreal, QC, Canada, 2Department of Neurology and Neurosurgery, McGill University, Montreal, QC, Canada, 3Department of Biomedical Engineering, McGill University, Montreal, QC, Canada
Synopsis
Multi-echo gradient echo (GRE) based, myelin water imaging (MWI) is subject to data quality constraints related to signal to noise ratio (SNR), B0 field inhomogeneities and gradient imperfections. These constraints pose challenges for conventional model-free, non-negative least squares (NNLS) fitting. As an alternative, a three-pool parametric model can be applied, with nonlinear least squares(NLLS) fitting to process MWI data. The three-pool model confers stability, but has the disadvantage of making prior assumptions. This study investigated the feasibility of using a novel, model-free approach called spectrum analysis for multiple exponentials via experimental condition oriented simulation (SAME-ECOS) for the GRE MWI analysis.
Introduction
Myelin water imaging (MWI)1 is a quantitative magnetic resonance (MR) technique that has been applied extensively to monitor neurodevelopment, demyelination and traumatic brain injury. MWI typically employs a multi-echo, spin-echo (SE) or gradient-echo (GRE) readout to quantify the signal decay properties of myelin and intra/extra-cellular water.2 However, decomposition of the multi-exponential decay signal into components is non-trivial.3 For SE MWI data, conventional analysis uses a non-negative least squares (NNLS) algorithm that fits the MWI data, generating a T2 spectrum.4 The NNLS fitting is considered model-free because it makes no prior assumptions about the number of distinguishable water pools and their respective T2 values. This is a desirable feature, especially when studying a complex biological systems. However, having very few initial assumptions can lead to an underdetermined problem with non-unique solutions. Thus NNLS fitting in the context of MWI is often unstable. Application of NNLS methods to GRE-based MWI T2* decay data is further complicated by the influence of field inhomogeneities.2 Instead of NNLS, a non-linear least squares (NLLS), three-pool model based approach has previously been applied to fit GRE MWI data. However, use of NLLS typically involves fixing initial parameters and can result in modeling errors.5A novel model-free approach, called spectrum analysis for multiple exponentials via experimental condition oriented simulation (SAME-ECOS), was recently proposed based on information theory and neural networks.6 SAME-ECOS has shown superior performance compared to NNLS, but only for SE MWI data. In this work, we evaluated SAME-ECOS in the context of high-resolution 7T pre-clinical, multi-echo GRE imaging. We also compared SAME-ECOS to a model-based approach that employed an artificial neural network (ANN) to improve the fitting accuracy of GRE MWI data.7 Our objectives were two-fold: (1) to demonstrate the feasibility of applying SAME-ECOS for fitting multi-component, GRE MWI data and (2) to show model-free SAME-ECOS can yield MWF maps comparable to those derived from traditional MWI calculations applied to GRE MWI data.
Methods
Ex-vivo MRI experiment: 3D GRE MWI data (24 echoes, TE/ΔTE/TR=2/2/100ms, flip angle=22°, bipolar readout, matrix size=135×106×120, 100 μm3 isotropic spatial resolution) were collected from one wild-type (WT) mouse brain at postnatal day 30. The brain was perfusion fixed and stored in fluorinert for imaging. MWI data was collected using a Bruker Pharmascan 7T MRI system with a volume, radiofrequency transceiver coli.Model-free myelin water fraction computation: The multi-component NNLS analysis previously described by Prasloski et al.8 was applied as a comparator for model-free approaches. Myelin water fraction (MWF, T2*<25ms) was calculated from the NNLS T2* spectrum from each voxel and corresponding whole mouse brain MWF maps were produced. Corresponding SAME-ECOS computation of MWF followed a three-step workflow: (1) 1,000,000 pairs of decay data and ground truth T2* labels were computed with respect to the principles derived from previous literature (Liu et al.6); (2) the SAME-ECOS neural network model was trained (hidden layers: 500×500×1000×1000×500×500, activation: ReLU9, optimizer: Adam10, loss: categorical cross-entropy11) to learn a mapping between the simulated decay data and ground truth T2* spectrum; (3) the trained model was applied to experimental data to calculate T2* spectrum and corresponding SAME-ECOS MWF. Further details of the SAME-ECOS workflow have been previously described by Liu et al.6
Model-based myelin water fraction computation: NLLS analysis with a typical three-pool magnitude model5 was applied as the comparator group for model-based approaches. Fitting parameters for the three-pool model were determined from previous literature (Nam et al.5). Like SAME-ECOS, the model-based ANN method we employed7 has a workflow of 3 steps: (1) 1,000,000 training examples were produced (decay data and ground truth MWF labels) using a three-pool magnitude signal model; (2) an ANN model was trained (hidden layers: 500×500×1000×1000×500×500, activation: ReLU9, optimizer: Adam10, loss: mean absolute error) to learn the mapping between the simulated decay data and the MWF labels; (3) the trained three-pool ANN model was applied to experimental data to obtain MWF at each voxel.
Evaluation: The mean absolute difference (MAD) in whole brain and voxel-wise Pearson correlations in MWF were compared based on the four proposed myelin water fitting methods.
Results and Discussion
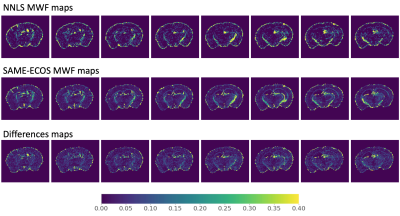
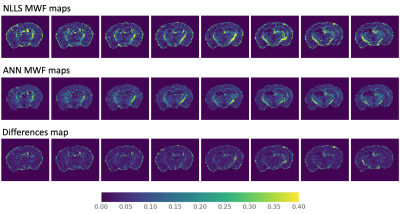
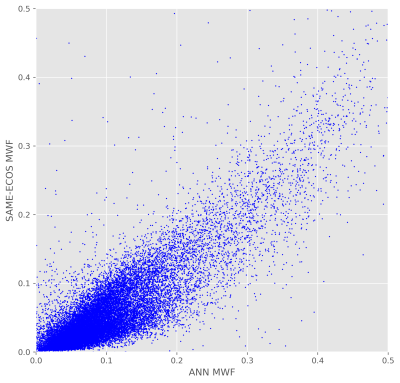
Based on visual inspection of MWF maps produced using the two model-free methods (Figure 1), SAME-ECOS achieved higher fitting accuracy and produced more realistic MWF maps with reduced noise compared to NNLS (MAD=0.033). Highly myelinated regions, such as the corpus callosum, could be reliably discriminated in SAME-ECOS MWF maps. The two model-based methods (Figure 2), NLLS and ANN, resulted in comparable MWF maps (MAD=0.007). Interestingly, the model-based methods appeared to yield higher 'background' MWF signal in gray matter regions. This may be due to inconsistencies in the initial values chosen when implementing the three-pool model. Nevertheless, there was a significant correlation (r2=0.35, p<0.05) between SAME-ECOS and ANN MWF values (Figure 3). This supports that SAME-ECOS can produce comparable MWF maps without sacrificing generality and imposing pre-defined fit parameter assumptions.Conclusion
This study demonstrated the SAME-ECOS, model-free approach outperformed conventional NNLS fitting and achieved comparable quality MWF maps to those computed using the three-pool model when employed with ex vivo, mouse, 7T multi-echo GRE data. Planned future studies will extend SAME-ECOS and the ANN approach to incorporate complex-valued MR data.Acknowledgements
We gratefully acknowledge funding support provided by the Multiple Sclerosis Society of Canada (Grant Number: 3613) and the Natural Sciences and Engineering Research Council of Canada (Grant Number: RGPIN/05047-2018).
References
1. MacKay A, Whittall K, Adler J, Li D, Paty D, Graeb D. In vivo visualization of myelin water in brain by magnetic resonance. Magn Reson Med. 1994;31(6):673-677.
2. Alonso‐Ortiz, E., Levesque, I. R., & Pike, G. B. (2015). MRI‐based myelin water imaging: a technical review. Magnetic resonance in medicine, 73(1), 70-81.
3. Istratov AA, Vyvenko OF. Exponential analysis in physical phenomena. Rev Sci Instrum. 1999;70(2):1233-1257.
4. Whittall KP, MacKay AL. Quantitative interpretation of NMR relaxation data. Journal of Magnetic Resonance (1969). 1989;84(1):134-152.
5. Nam, Y., Lee, J., Hwang, D., & Kim, D. H. (2015). Improved estimation of myelin water fraction using complex model fitting. NeuroImage, 116, 214-221.
6. Liu H, Xiang QS, Tam R, Kozlowski P, Li DKB, Mackay AL, Kramer, JK and Laule C. (2021) A data-driven T2 relaxation analysis approach for myelin water imaging: Spectrum analysis for multiple exponentials via experimental condition oriented simulation (SAME-ECOS). Magn Reson Med. doi: 10.1002/mrm.29000.
7. Jung, S., Lee, H., Ryu, K., Song, J. E., Park, M., Moon, W. J., & Kim, D. H. (2021). Artificial neural network for multi‐echo gradient echo–based myelin water fraction estimation. Magnetic Resonance in Medicine, 85(1), 380-389.
8. Prasloski T, Mädler B, Xiang Q, MacKay A, Jones C. Applications of stimulated echo correction to multicomponent T2 analysis. Magn Reson Med. 2012;67:1803-1814.
9. Nair V, Hinton GE. Rectified linear units improve restricted boltzmann machines. . 2010:807-814.
10. Kingma DP, Ba J. Adam: A method for stochastic optimizaton. arXiv. 2014;1412.6980.
11. LeCun Y, Bengio Y, Hinton G. Deep learning. Nature. 2015;521(7553):436-444.Figures


Figure 2. Model-based myelin water fraction mapping. Myelin water fraction (MWF) maps were produced using nonlinear least squares (NLLS) and artificial neural network (ANN) approaches. Figure 2 displays corresponding MWF slices from the mid cerebrum of the mouse brain. Absolute differences in MWF (bottom row) were calculated for each voxel.

Figure 3. Correlation between SAME-ECOS and ANN MWF values in the mouse brain. MWF values from SAME-ECOS MWF and ANN MWF were strongly correlated (r2=0.35, p<0.05) in the mouse brain parenchyma. MWF data in Figure 3 is based on the images displayed in Figures 1 and 2.