4965
Dose-Escalated Radiation Treatment Plans in Glioblastoma Based on Quantitative Magnetization Transfer using a 1.5T MR-Linac1Physical Sciences Platform, Sunnybrook Research Institute, Toronto, ON, Canada, 2Department of Radiation Oncology, Sunnybrook Health Sciences Centre, Toronto, ON, Canada, 3Department of Medical Biophysics, University of Toronto, Toronto, ON, Canada, 4Department of Medical Imaging, Sunnybrook Health Sciences Centre, University of Toronto, Toronto, ON, Canada, 5Department of Neurosurgery and Pediatric Neurosurgery, Medical University of Lublin, Lublin, Poland
Synopsis
Hybrid MR/radiotherapy MR-Linac devices enable dose adaptation based on daily imaging. Saturation transfer MRI, including quantitative magnetization transfer (qMT) and chemical exchange saturation transfer (CEST), have been shown to predict treatment response in glioblastoma. Here, in a proof-of-principle study, we demonstrated the feasibility of retrospectively generating dose-escalated radiation plans based on qMT semi-solid fraction maps acquired on the MR-Linac. Treatment plans with a 115-120% boost dose were successfully generated in all four patients and adhered to clinical organs-at-risk dose constraints.
Introduction
Hybrid MR/radiotherapy (“MR-Linac”) devices [1–4] enable dose modifications based on daily imaging. Saturation transfer techniques, including quantitative magnetization transfer (qMT) [5,6] and chemical exchange saturation transfer (CEST) [7], can be used during radiotherapy to monitor treatment response in glioblastoma (GBM) [8–13]. As parameters from these techniques are sensitive to white matter integrity and tumour metabolism, they may also be used to indicate regions for dose intensification [14–17] including regions with higher tumour burden, increased metabolism or higher likelihood of recurrence. In GBM patients, dose escalation has been carried out using diffusion-weighted imaging in combination with perfusion MRI to define the sub-volume[14]. However, to date, the feasibility of using saturation transfer for dose escalation has not been investigated. In this proof-of-principle study in four patients, we evaluated the ability to retrospectively generate dose-escalated radiation plans based on qMT semi-solid fraction mapping.Methods
PatientsThe four GBM patients included were treated using an MR-Linac, with fractionation schedules of 60Gy/30fx (n=1), 54Gy/30fx (for larger tumour volumes, n=1), and 40Gy/15fx (n=2). All patients were enrolled in the MOMENTUM study (ClinicalTrials.gov identifier: NCT04075305) [18]. The study was approved by the institutional research ethics board and informed consent was obtained.
MR Acquisition
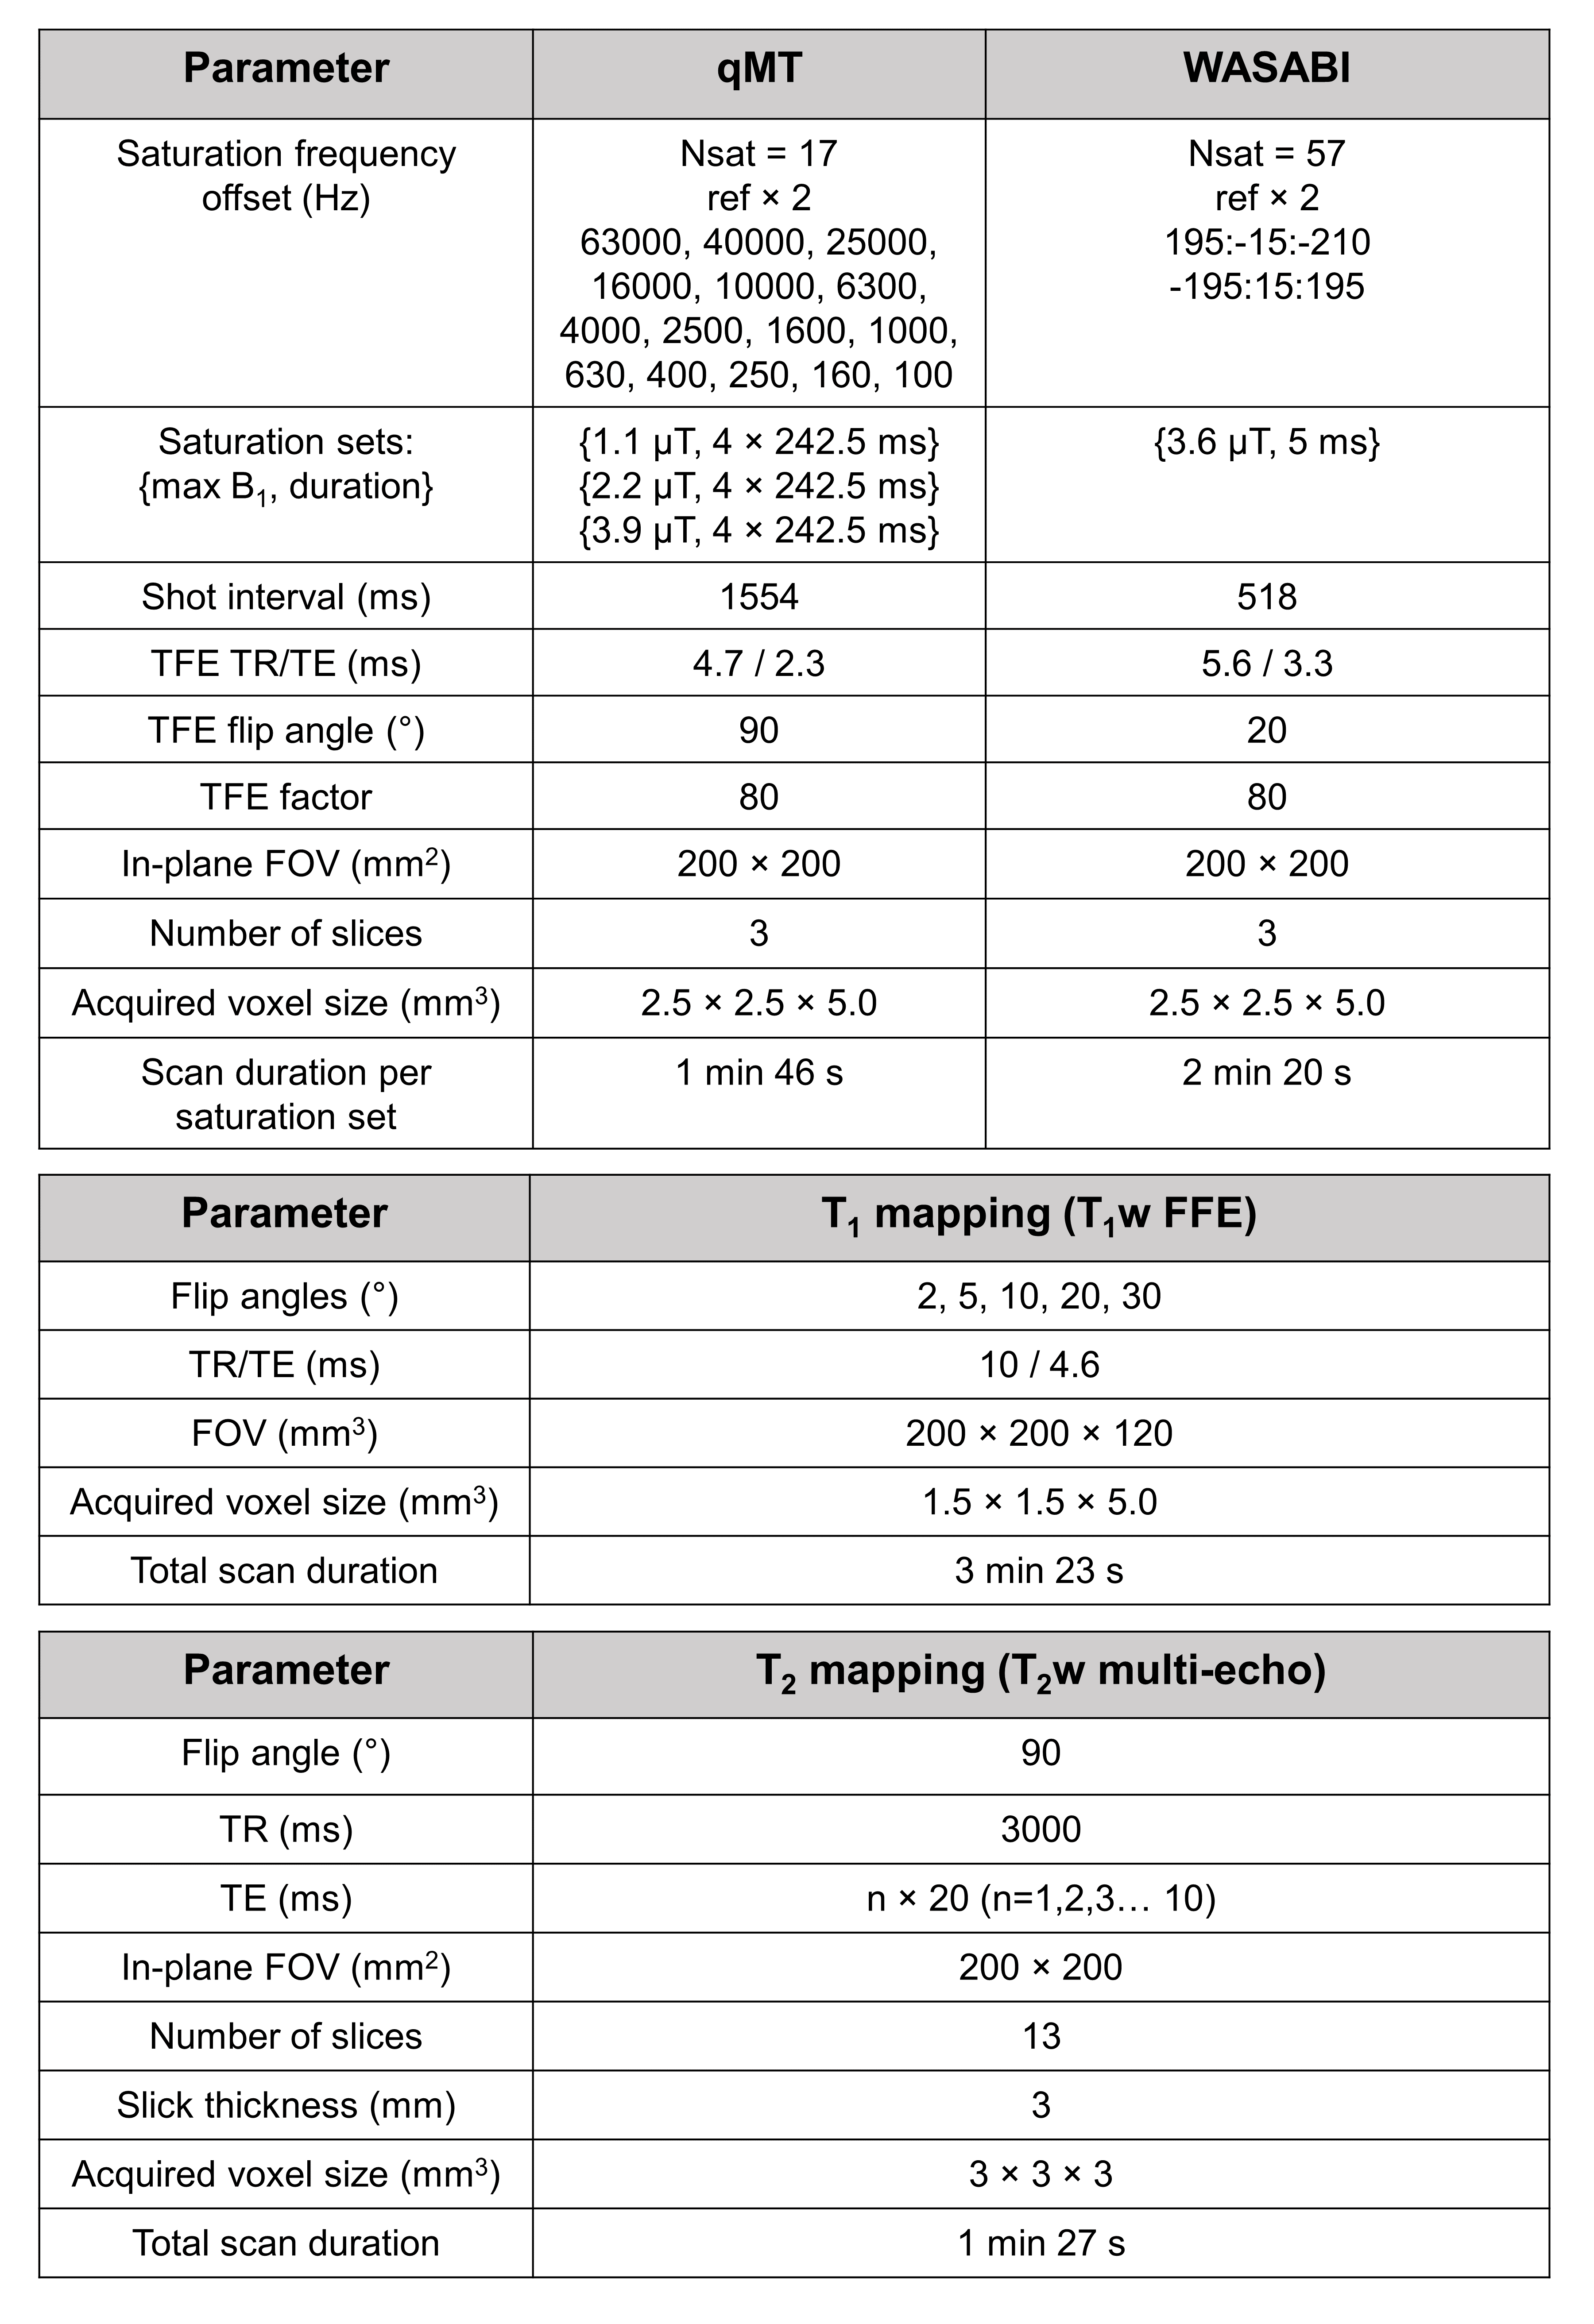
MRI was performed on a 1.5T Elekta Unity MR-Linac (Elekta AB, Stockholm, Sweden) at each treatment fraction. The qMT images were obtained post-irradiation at weekly intervals, using a pulsed MT sequence [13,19–21]. MR parameters are listed in Table 1. The qMT imaging slab consisted of three contiguous 5mm slices and was centered on the superior/inferior location of the greatest axial tumour diameter [13]. Quantitative fitting of the semi-solid fraction (M0B) incorporated T1, T2, B0, and B1 maps [19,20] MATLAB R2018b was used for the fitting.
Image Processing
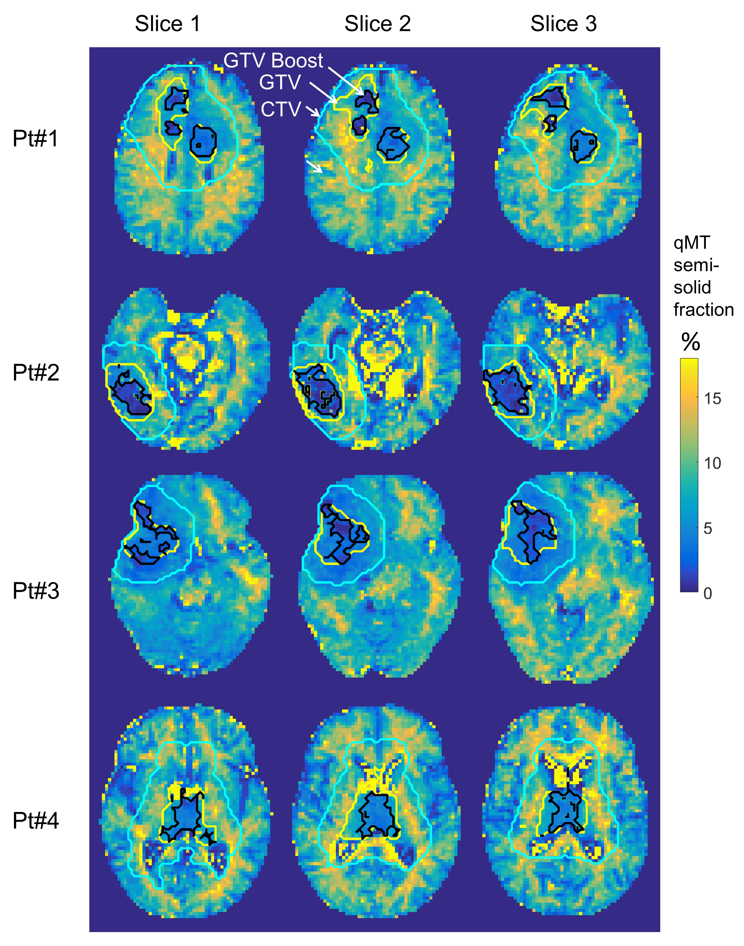
The gross tumour volume (GTV) was contoured based on post-gadolinium T1w and FLAIR images, and rigidly propagated to each daily MR-Linac T1w scan using FSL FLIRT [22]. The qMT semi-solid fraction maps were thresholded to obtain candidate volumes for dose escalation. The “GTV-Boost” region consisted of 50% of the GTV voxels with the lowest qMT semi-solid fraction (based on progressors having lower values compared to non-progressors[8]). The GTV-Boost region was compared with the enhancing regions on follow-up scans to assess any spatial correspondence with recurrent tissue.
Dose plan generation
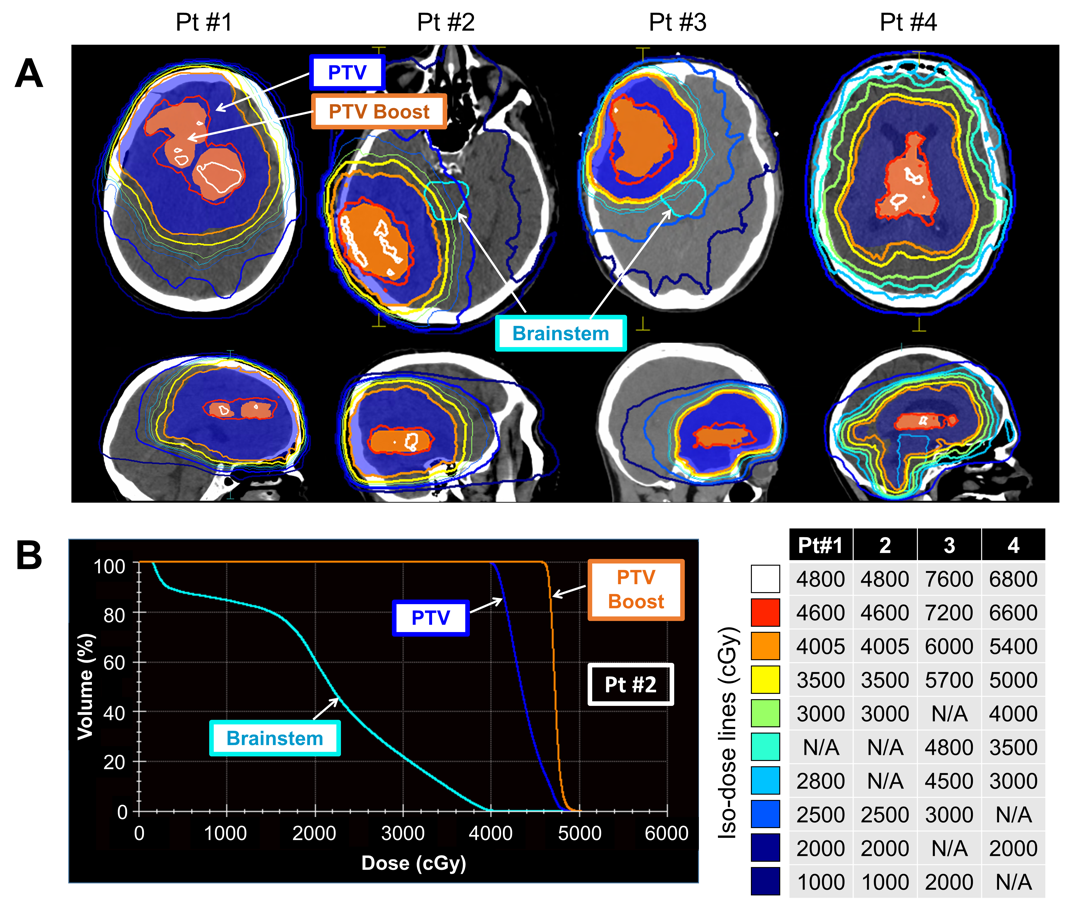
Dose planning was performed with the Monaco treatment planning system (Elekta AB, Stockholm, Sweden) using a simultaneous-integrated boost (SIB), where sub-regions of the planning target volume (PTV) received an increased dose per fraction. This boost target, denoted “PTV-Boost”, was generated from a 3-mm isotropic expansion of GTV-Boost. A treatment plan was scored as clinically acceptable if it achieved the desired PTV-Boost dose and satisfied all organ-at-risk (OAR) constraints using an integrated boost dose of 0.4Gy per fraction.
Results
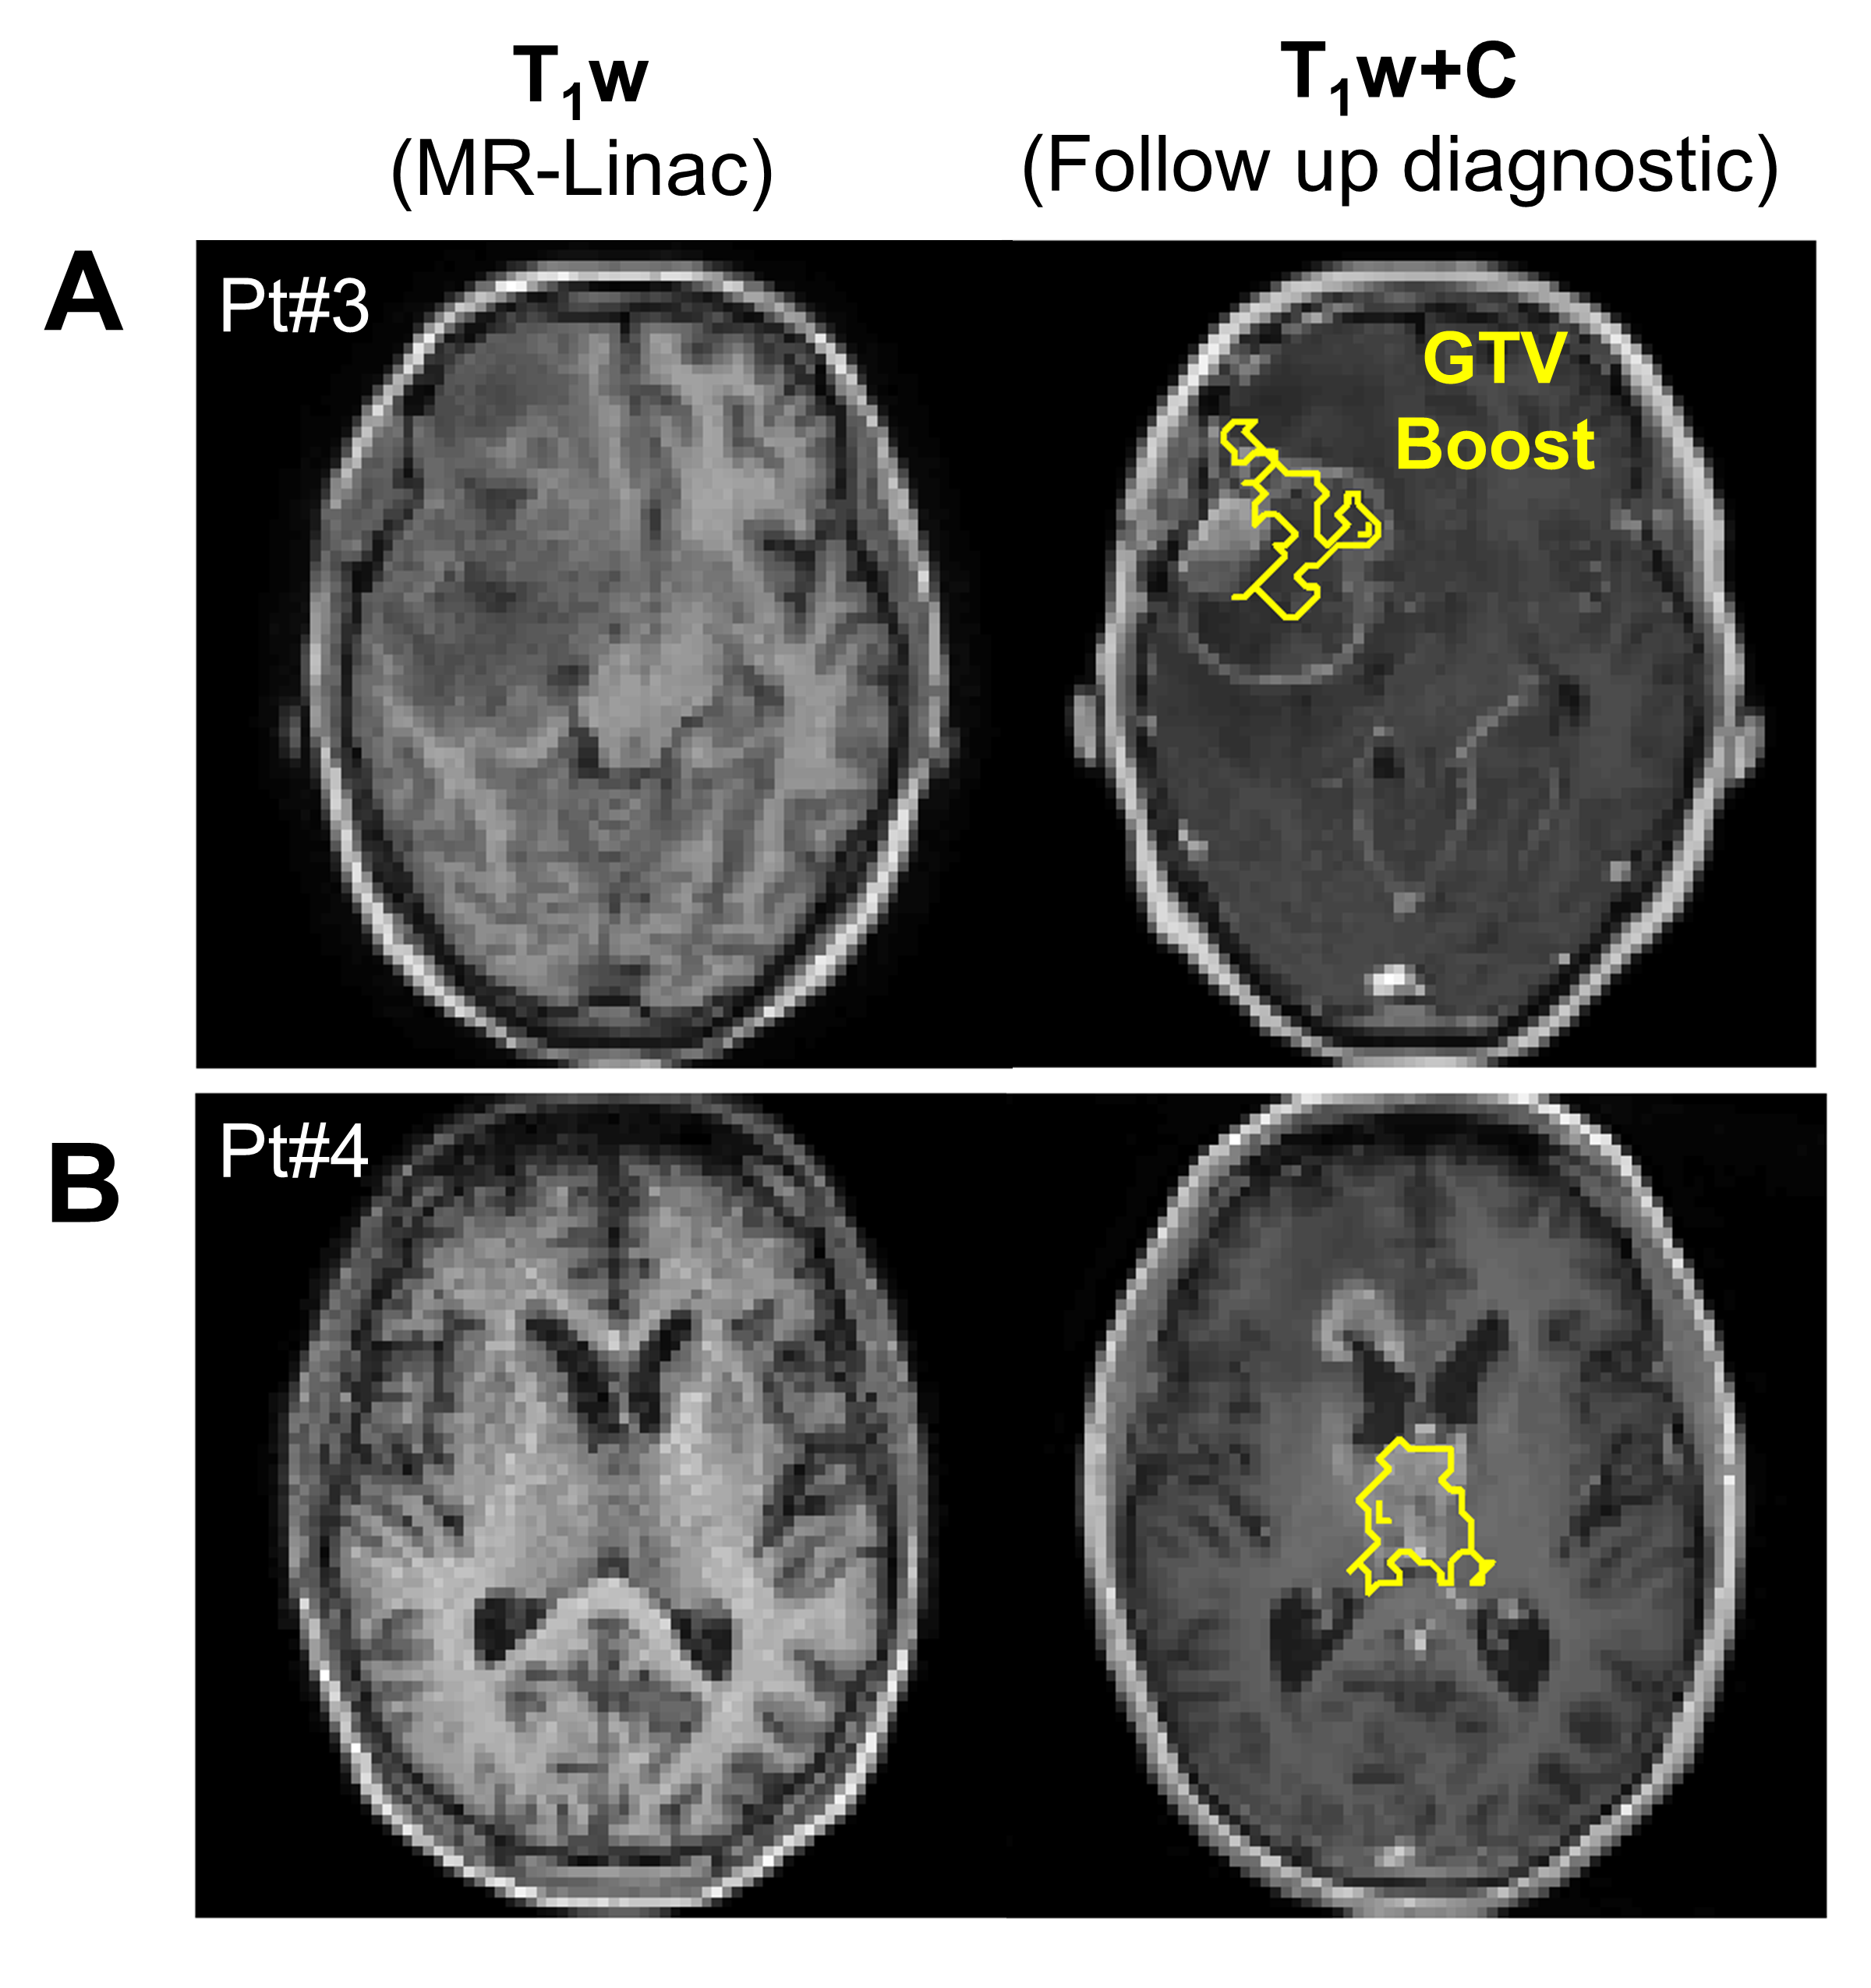
In all patients, dose-escalated treatment plans were successfully produced while respecting the OAR dose constraints. Boost doses ranged between 115-120% of the original prescription. An integrated boost dose of 0.4Gy per fraction yielded a total of i) 72Gy (=60Gy + 30×0.4Gy) and ii) 66Gy (=54Gy + 30×0.4Gy) to the boost sub-volume for corresponding standard doses of 60 and 54Gy, respectively, in 30 fractions. For the 40Gy/15fx dose scheme, a total of 46Gy was prescribed.Figure 2 shows the qMT semi-solid fraction maps for all patients, with the GTV-Boost, GTV and CTV overlaid. Figure 3A shows the corresponding PTV-Boost, along with iso-dose lines and an example dose volume histogram (Figure 3B). Figure 4 shows contrast-enhanced T1-weighted images from a diagnostic scanner at the time of follow up >6-months after treatment, indicating progressive disease in patients #3 and 4. In patient #3 (Figure 4A), the GTV-Boost region surrounded the enhancing region and, in patient #4 (Figure 4B), it overlapped partially with the enhancing region.
Discussion
Previous studies [14–17] have performed dose escalation with guidance from quantitative MRI and demonstrated safety where dose escalation up to 75Gy [14] was well-tolerated. Our results demonstrated the feasibility of incorporating into radiation planning a dose escalation target using MR-Linac qMT scans, with the eventual aim of minimizing recurrence or possibly allowing for smaller margins (as in an ongoing trial for high grade glioma: NCT04726397).Although dose-escalated plans were generated from a single time point for each patient, the boost volume could be updated throughout treatment using the same method. A technical limitation was that the qMT imaging slab was only 15-mm thick. A volumetric acquisition with larger slab thickness would allow more accurate and extended dose-escalated distributions. Although areas of low semi-solid MT fractions were used as the boost target, other sub-volumes based on combinations of quantitative MR scans can be used. Multi-parametric imaging would potentially give higher specificity to tumour recurrence (as suggested by variable overlap of the boost volumes with enhancing regions based on the qMT semi-solid fraction alone). Studies correlating quantitative MR parameters and patient outcomes will first be needed to determine the appropriate sub-volumes.
Conclusion
This study showed the feasibility of using MR-Linac qMT scans to generate escalated dose plans for guiding adaptive radiotherapy. Treatment plans with 115-120% of the standard dose were successfully generated in all four patients and adhered to clinical OAR dose constraints.Acknowledgements
We thank the MR-Linac radiation therapists Shawn Binda, Danny Yu, Renée Christiani, Katie Wong, Helen Su, Monica Foster, Rebekah Shin, Khang Vo, Ruby Bola, Susana Sabaratram, Christina Silverson and Anne Carty for scanning and for their assistance with the protocol; Aimee Theriault and Mikki Campbell for study coordination; Brian Keller and Brige Chugh for MR-Linac operations; Dr. Hanbo Chen for statistical advice; Wilfred Lam for (very) useful advice. We gratefully acknowledge the following sources of funding: Natural Sciences and Engineering Research Council; Terry Fox Research Institute; Canadian Institutes of Health Research; and Canadian Cancer Society Research Institute.References
[1] Raaymakers BW, Jürgenliemk-Schulz IM, Bol GH, Glitzner M, Kotte ANTJ, Van Asselen B, et al. First patients treated with a 1.5 T MRI-Linac: Clinical proof of concept of a high-precision, high-field MRI guided radiotherapy treatment. Phys Med Biol 2017;62:L41–50. https://doi.org/10.1088/1361-6560/aa9517.
[2] Lagendijk JJW, Raaymakers BW, van Vulpen M. The Magnetic Resonance Imaging–Linac System. Semin Radiat Oncol 2014;24:207–9. https://doi.org/10.1016/j.semradonc.2014.02.009.
[3] Hall WA, Paulson ES, van der Heide UA, Fuller CD, Raaymakers BW, Lagendijk JJW, et al. The transformation of radiation oncology using real-time magnetic resonance guidance: A review. Eur J Cancer 2019;122:42–52. https://doi.org/10.1016/j.ejca.2019.07.021.
[4] Cao Y, Tseng CL, Balter JM, Teng F, Parmar HA, Sahgal A. MR-guided radiation therapy: transformative technology and its role in the central nervous system. Neuro Oncol 2017;19:ii16–29. https://doi.org/10.1093/neuonc/nox006.
[5] Morrison C, Henkelman RM. A Model for Magnetization Transfer in Tissues. Magn Reson Med 1995;33:475–82. https://doi.org/10.1002/mrm.1910330404.
[6] Henkelman RM, Huang X, Xiang Q ‐S, Stanisz GJ, Swanson SD, Bronskill MJ. Quantitative interpretation of magnetization transfer. Magn Reson Med 1993;29:759–66. https://doi.org/10.1002/mrm.1910290607.
[7] Ward KM, Aletras AH, Balaban RS. A New Class of Contrast Agents for MRI Based on Proton Chemical Exchange Dependent Saturation Transfer (CEST). J Magn Reson 2000;143:79–87. https://doi.org/10.1006/jmre.1999.1956.
[8] Mehrabian H, Myrehaug S, Soliman H, Sahgal A, Stanisz GJ. Quantitative Magnetization Transfer in Monitoring Glioblastoma (GBM) Response to Therapy. Sci Rep 2018;8:1–11. https://doi.org/10.1038/s41598-018-20624-6.
[9] Mehrabian H, Myrehaug S, Soliman H, Sahgal A, Stanisz GJ. Evaluation of Glioblastoma Response to Therapy With Chemical Exchange Saturation Transfer. Int J Radiat Oncol Biol Phys 2018;101:713–23. https://doi.org/10.1016/j.ijrobp.2018.03.057.
[10] Mehrabian H, Lam WW, Myrehaug S, Sahgal A, Stanisz GJ. Glioblastoma (GBM) effects on quantitative MRI of contralateral normal appearing white matter. J Neurooncol 2018;139:97–106. https://doi.org/10.1007/s11060-018-2846-0.
[11] Regnery S, Adeberg S, Dreher C, Oberhollenzer J, Meissner JE, Goerke S, et al. Chemical exchange saturation transfer MRI serves as predictor of early progression in glioblastoma patients. Oncotarget 2018;9:28772–83. https://doi.org/10.18632/oncotarget.25594.
[12] Meissner JE, Korzowski A, Regnery S, Goerke S, Breitling J, Floca RO, et al. Early response assessment of glioma patients to definitive chemoradiotherapy using chemical exchange saturation transfer imaging at 7 T. J Magn Reson Imaging 2019;50:1268–77. https://doi.org/10.1002/jmri.26702.
[13] Chan RW, Lawrence LSP, Oglesby RT, Chen H, Stewart J, Theriault A, et al. Chemical exchange saturation transfer MRI in central nervous system tumours on a 1.5 T MR-Linac. Radiother Oncol 2021;162:140–9. https://doi.org/10.1016/j.radonc.2021.07.010.
[14] Kim MM, Sun Y, Aryal MP, Parmar H, Piert M, Rosen BS, et al. A Phase II Study of Dose-Intensified Chemoradiation Using Biologically-Based Target Volume Definition in Patients with Newly Diagnosed Glioblastoma. Int J Radiat Oncol 2020;108:S20. https://doi.org/10.1016/j.ijrobp.2020.07.2105.
[15] Tsien CI, Brown D, Normolle D, Schipper M, Piert M, Junck L, et al. Concurrent temozolomide and dose-escalated intensity-modulated radiation therapy in newly diagnosed glioblastoma. Clin Cancer Res 2012;18:273–9. https://doi.org/10.1158/1078-0432.CCR-11-2073.
[16] Nguyen D, Rwigema J-CM, Yu VY, Kaprealian T, Kupelian P, Selch M, et al. Feasibility of extreme dose escalation for glioblastoma multiforme using 4π radiotherapy. Radiat Oncol 2014;9:239. https://doi.org/10.1186/s13014-014-0239-x.
[17] Laack NN, Pafundi D, Anderson SK, Kaufmann T, Lowe V, Hunt C, et al. Initial Results of a Phase 2 Trial of 18F-DOPA PET-Guided Dose-Escalated Radiation Therapy for Glioblastoma. Int J Radiat Oncol Biol Phys 2021;110:1383–95. https://doi.org/10.1016/j.ijrobp.2021.03.032.
[18] de Mol van Otterloo, S. R. Christodouleas JP, Blezer ELA, Akhiat H, Brown K, Choudhury A, Eggert D, et al. The MOMENTUM Study: An International Registry for the Evidence-Based Introduction of MR-Guided Adaptive Therapy. Front Oncol 2020;10:1328.
[19] Chan RW, Lawrence LSP, Oglesby RT, Chen H, Keller B, Stewart J, et al. A Daily Quantitative Brain MRI Protocol for the 1.5 T MR-Linac: Feasibility of CEST with Preliminary Results on a Prospective Imaging Study. In: Proceedings of the ISMRM & SMRT Virtual Annual Meeting & Exhibition. 2021.
[20] Chan RW, Myrehaug S, Stanisz GJ, Sahgal A, Lau AZ. Quantification of pulsed saturation transfer at 1.5T and 3T. Magn Reson Med 2019;82:1684–99. https://doi.org/10.1002/mrm.27856.
[21] Chan RW, Chen H, Myrehaug S, Atenafu EG, Stanisz GJ, Stewart J, et al. Quantitative CEST and MT at 1.5T for monitoring treatment response in glioblastoma: early and late tumor progression during chemoradiation. J Neurooncol 2021;151:267–78. https://doi.org/10.1007/s11060-020-03661-y.
[22] Jenkinson M, Beckmann CF, Behrens TEJ, Woolrich MW, Smith SM. FSL. Neuroimage 2012;62:782–90. https://doi.org/10.1016/j.neuroimage.2011.09.015.
Figures