4962
Coronavirus Disease 2019 (COVID-19): Impact of First and Second Waves on CT and MRI Patient Volumes at a Large Tertiary Center1Radiology, Northwestern University, Chicago, IL, United States, 2Northwestern University, Chicago, IL, United States, 3Siemens Medical Solutions, Chicago, IL, United States
Synopsis
The impact of the first wave of COVID-19 (Feb-Apr. 2020) on imaging volumes has been widely explored, but responses to a subsequent wave (Oct-Dec. 2020) remain to be investigated. In this study, a cloud-based analytics tool (CBAT) collected monthly CT/MRI scan volumes at a large tertiary center from Oct 2019 to Aug 2021. The first wave of COVID-19 significantly lowered all forms of CT/MRI imaging. The second COVID-19 wave did not significantly impact CT/MRI scan volumes, which remained at pre-pandemic levels during/afterwards. CBAT has the ability to assess impact/response towards two waves of COVID-19 at a large tertiary center.
Introduction
Imaging services have continuously adjusted to the challenges brought on by COVID-19. The goal of this study was to utilize a novel radiology analytics platform to quantify the effect of two waves of COVID-19 on computed tomography (CT) and magnetic resonance imaging (MRI) scan volumes at a large urban health care center.Methods
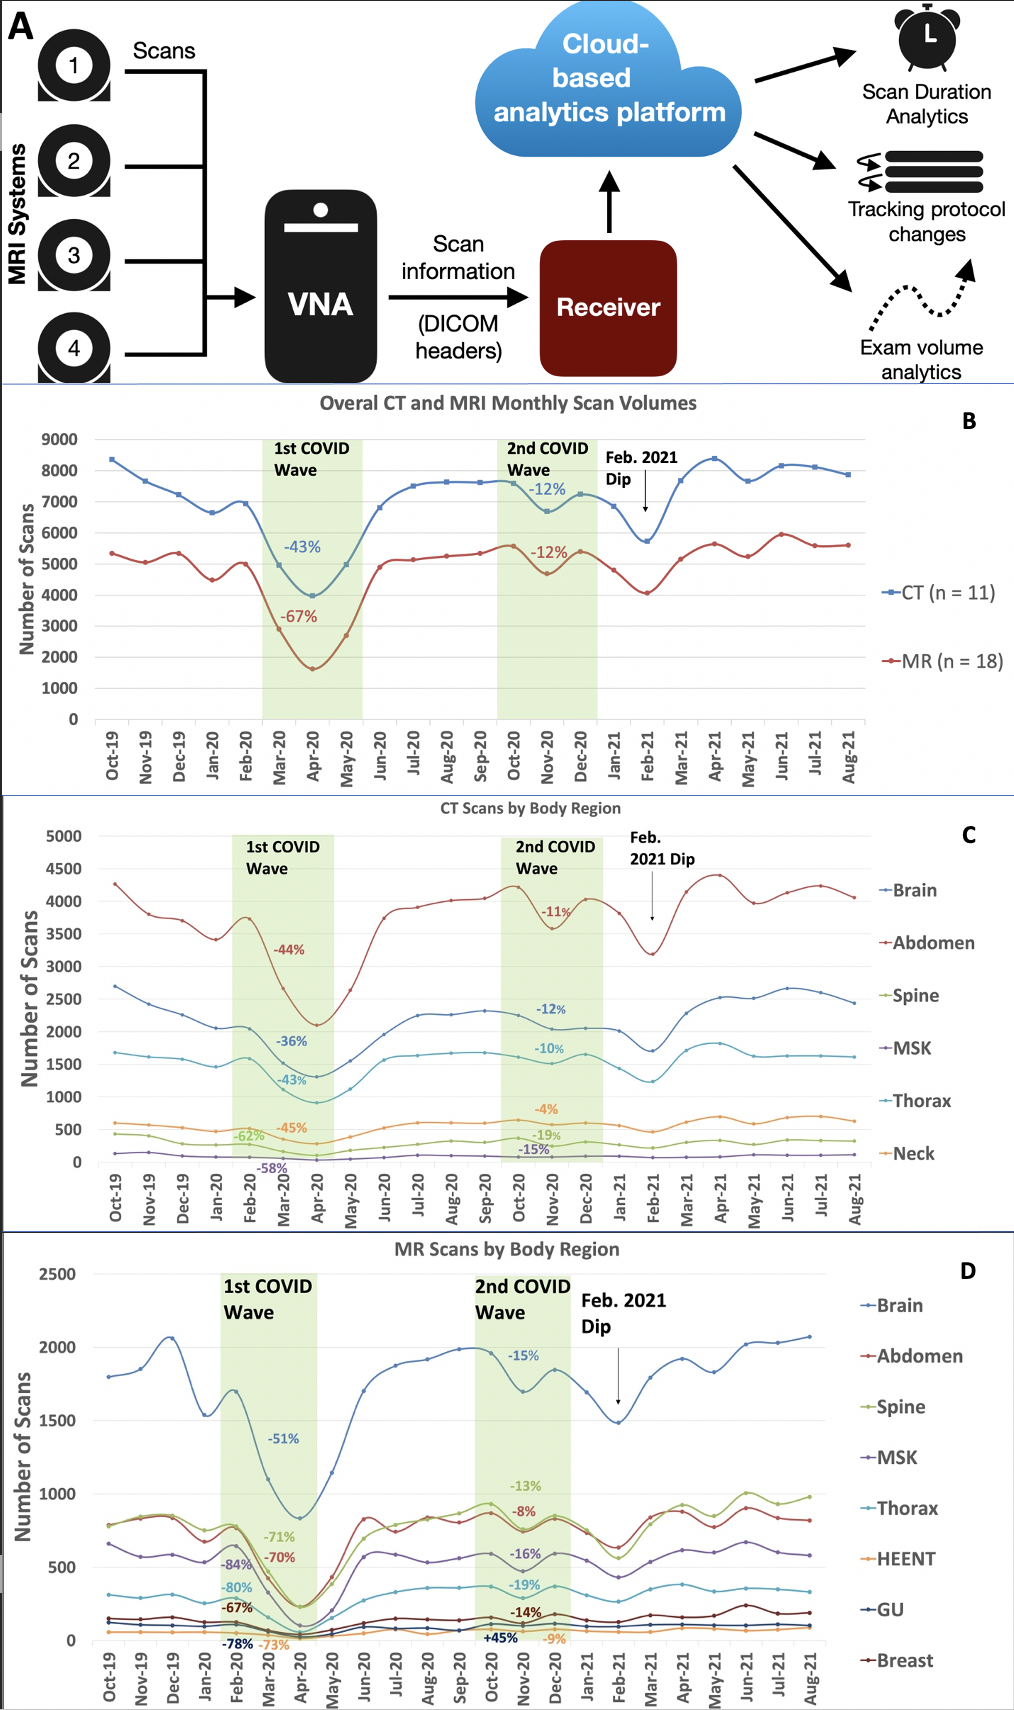
Analysis of the COVID-19 impact on CT and MRI scan volumes was conducted for 29 imaging systems at Northwestern Memorial Hospital (NMH:11 CT scanners, 18 MRI scanners). A vendor neutral, cloud-based analytics tool (CBAT, teamplay—Siemens, Germany) was used to retrospectively collect information (imaging protocol/series, exam duration, and body part imaged) via DICOM headers on each exam performed between October 2019 (when NMH scanners were fully linked to CBAT) to August 2021 (figure 1). Patient exams were initially stratified by modality (CT or MRI), then further sub-grouped into body region categories. For CT, these groups consisted of brain, spine, neck, thorax, abdomen, and musculoskeletal (MSK). For MRI, body region categories included brain, head/eyes/ears/nose/throat (HEENT), thorax, breast, abdomen, and genitourinary (GU). Patients who received imaging exams covering multiple body regions were counted towards each respective body area imaged (e.g., CT abdomen/chest exams were recorded in both the “abdomen” and “thorax” groups). To assess the effect of COVID-19 on NMH scan volumes, we compared scan volume before, during, and after each “wave” of COVID-19 cases in Illinois (Mar. 2020 – May 2020 & Oct. 2020 – Dec. 2020). First, scan volumes for each respective wave were compared against pre-pandemic volumes (Oct. 2019—Feb. 2020). Percent drops in monthly scan volume during COVID-19 peaks (Apr. 2020—Nov. 2020) were also calculated by comparing scan volumes in the month immediately preceding the first wave versus the peak month itself (e.g. for the first COVID-19 wave, the month immediately prior to the wave (Feb. 2020) was compared with the peak of the wave (Apr. 2020). To evaluate the extent of post-pandemic recovery of CT/MRI imaging, we compared pre-pandemic scan volumes with 1) volume between the first and second waves (Jun. 2021–Oct. 2021) and 2) scan volume following the second wave (Jan 2020–Aug. 2021) with a t test or Mann Whitney U test.Results
A total of 162,350 CT and 110,798 MR scans were analyzed. The first COVID-19 wave resulted in a substantial drop in CT and MRI scan volumes by -43% and -67%, respectively. For CT, spine and MSK scans had the greatest reduction (62%, p=0.01 and 58%, p=0.01), followed by neck (-45%, p=0.01), abdomen (-44%, p=<0.01), thorax (-43%, p=0.01), and brain (-36%, p<0.01) (Figure B & C, Table 1). MRI showed a more severe decline than CT: MSK scans were reduced the most (-84%, p=0.02), followed by thorax (-80%, p=0.03), GU (-78%, p=0.02), HEENT (-73%, p=0.05), spine (71%, p=0.02) abdominal (-70%, p=0.01), breast (-67%, p<0.01) and brain (-51%, p<0.01) (Figure D, Table 1). In the time between the first and second waves (May 2020 – Oct 2020), all monthly mean scan volumes returned to pre-COVID levels (p > 0.05) except for GU MRI, which remained reduced (107 vs. 81, p=0.01). Analysis of the second wave did not show significant reductions in scan volumes in the 3 months before/after Nov 2021 COVID wave (p>0.05). In the period after the second wave (Dec. 2020–Aug 2021), all CT and MR scans returned to pre-covid volumes (p>0.05) except MR HEENT scans, which showed a significant increase (mean: 55 vs. 71, p=0.01). The drop in scan volumes in Feb 2021 was likely caused by 3 severe weather days (temperatures below -15° to -20° Celsius) along with February being the shortest month.Discussion
COVID-19 has caused massive delays in imaging and screening, leading to increased mortality and poorer clinical outcomes—accurate data regarding the impact of COVID-19 on scan volumes and the efficacy of subsequent institutional policy changes is needed to guide further improvements.1,2 Our findings revealed that the COVID-19 pandemic had a substantial impact on all forms of CT and MRI scan volumes, especially for MSK applications. For both CT and MRI, scan volumes returned to within 2% of their pre-lockdown numbers by June of 2020. The second COVID did not have a significant impact on CT & MR scan volumes at NMH. In fact, overall mean MR scan volumes were actually trending higher compared to pre-pandemic levels during the second wave. After the second COVID wave, MR HEENT even went on to significantly exceed pre-pandemic volumes. Limitations include data from a single institution, collected via DICOM headers as opposed to actual images. Moreover, our study does not account for the effect of reduced COVID restrictions (mid-late 2021) on scan volumes. However, our results still suggest that imaging services were better adapted to combat the second COVID wave—institutions have continued to implement rapid adjustments to the constraints brought on by COVID-19 in regards to patient care.3Conclusion
CT and MRI patient volumes in a highly populated, urban environment were significantly impacted by the COVID-19 pandemic. This study shows that CBAT can derive valuable information on the impact of extrinsic factors on imaging performance across a large fleet of 29 CT and MRI systems.Acknowledgements
No acknowledgement found.References
1. Chen RC, Haynes K, Du S, Barron J, Katz AJ. Association of Cancer Screening Deficit in the United States With the COVID-19 Pandemic. JAMA Oncol. 2021;7(6):878– 884. doi:10.1001/jamaoncol.2021.08842.
2. Vatele, J., Gentile, S., Thomson, V. et al. Teleradiology as a relevant indicator of the impact of COVID-19 pandemic management on emergency room activities: a nationwide worrisome survey. Insights Imaging 12, 30 (2021). https://doi.org/10.1186/s13244-021-00964-03.
3. Allen, B.D., Wong, T.C., Bucciarelli-Ducci, C. et al. Society for Cardiovascular Magnetic Resonance (SCMR) guidance for re-activation of cardiovascular magnetic resonance practice after peak phase of the COVID-19 pandemic.J Cardiovasc Magn Reson 22, 58 (2020). https://doi.org/10.1186/s12968-020-00654-8
Figures

p≤0.05 was considered statistically significant.
Table 1: CT and MR scan mean monthly volume comparisons between pre-pandemic (overall & by body part) versus during/after the 1st-COVID wave. During the first COVID wave (3/20-5/20), all forms of CT and MR scan volumes dropped significantly when compared with the pre-pandemic months (p<0.05). In the months between the first and second waves, scan volumes recovered besides MR GU scans (p = 0.01).

p≤0.05 was considered statistically significant.
Table 2: CT and MR scan volume comparisons between pre-pandemic (overall & by body part) versus during/after the 2nd-COVID wave (10/20-12/20). The second wave did not significantly impact scan volumes, which did not differ from pre-pandemic numbers (p>0.05). Similarly, scan volumes after the 2nd wave recovered to pre-pandemic levels (p>0.05), while MR HEENT volume was significantly elevated from pre-pandemic scans (p=0.01).