4957
Assessing redox changes induced by treatment with pharmacological ascorbate in glioblastoma using T2* and QSM1Department of Radiology, The University of Iowa, Iowa City, IA, United States, 2Department of Radiation Oncology, Free Radical and Radiation Biology Program, The University of Iowa, Iowa City, IA, United States, 3Skope Magnetic Resonance Technologies AG, Zurich, Switzerland, 4Department of Internal Medicine, The University of Iowa, Iowa City, IA, United States, 5Department of Surgery, The University of Iowa, Iowa City, IA, United States
Synopsis
Pharmacological ascorbate (P-AscH-), as an adjuvant to standard treatment for glioblastoma, may selectively enhance cancer cell killing. The mechanisms of P-AscH- have been associated with redox changes in the labile iron pool. This study applies T2* and QSM to assess the redox changes in 40 glioblastoma patients receiving standard treatment and adjuvant P-AscH-. The results demonstrate an increase in T2* values and a decrease in QSM values within contrast-enhancing lesions 1 hour after P-AscH- infusion. These changes in T2* and QSM may result from the redox changes by P-AscH-, supporting the potential for imaging assessment of response to P-AscH-.
INTRODUCTION
Pharmacological ascorbate (P-AscH-) is a promising adjuvant to standard treatment of glioblastoma due to its selective toxicity to cancer cells without damaging normal tissue1-3. The selective toxicity of P-AscH- has been attributed to the oxidation of P-AscH- to form hydrogen peroxide (H2O2) catalyzed by the redox cycling of the labile iron pool (LIP)4-6. Therefore, detecting the redox changes in the LIP may aid in prediction and assessment of response to P-AscH-. Recent imaging studies have shown that T2* and QSM allow the detection of changes in iron oxidation state in phantoms, animal models, and post-mortem human brain tissue7-10, suggesting the use of T2* and QSM to assess the in vivo redox changes induced by P-AscH-. In a previous preliminary study of 15 newly diagnosed glioblastoma patients receiving standard treatment and adjuvant P-AscH-9, we reported changes of in vivo T2* and QSM that are consistent with redox changes in the LIP induced by P-AscH-. In the present study, we extend these observations to include an additional 25 patients’ data and investigate the changes of T2* and QSM following P-AscH- infusion.METHODS
PatientsAs part of a phase II clinical trial (NCT02344355), this study enrolled 55 subjects with newly diagnosed, biopsy-proven glioblastoma. Forty of these subjects had completed the MRI scans and showed enhancing lesions. Their data were included in the analysis. All subjects underwent standard treatment, including surgical resection/biopsy followed by radiotherapy with concomitant and at least 6 cycles of adjuvant temozolomide. Additionally, P-AscH- infusion was administered during radiation therapy and following radiation therapy during the 6 cycles of adjuvant temozolomide or disease progression11.To evaluate the effect of P-AscH- treatment, three sets of MRI images were acquired from each subject on the same day approximately 4 weeks after the start of radiation therapy: one image set before P-AscH- infusion (pre-P-AscH-) and two image sets after P-AscH- infusion (1 hour and 4 hours post-P-AscH-).
MRI
MRI images from 40 subjects collected on a 3 Tesla MRI scanner (Siemens TIM TRIO, Erlangen, Germany) were analyzed. The imaging protocol included a 3D multi-echo GRE sequence for T2* and QSM measurements, post-contrast T1-weighted MPRAGE (T1+C), and FLAIR sequences. The parameters for the 3D multi-echo GRE sequence were: voxel size of 0.9 × 0.9 × 1.5 mm3, pixel bandwidth of 260 Hz, flip angle of 17°, TR of 80 ms, and 8 TEs of 7-56 ms in increments of 7 ms.
Image processing
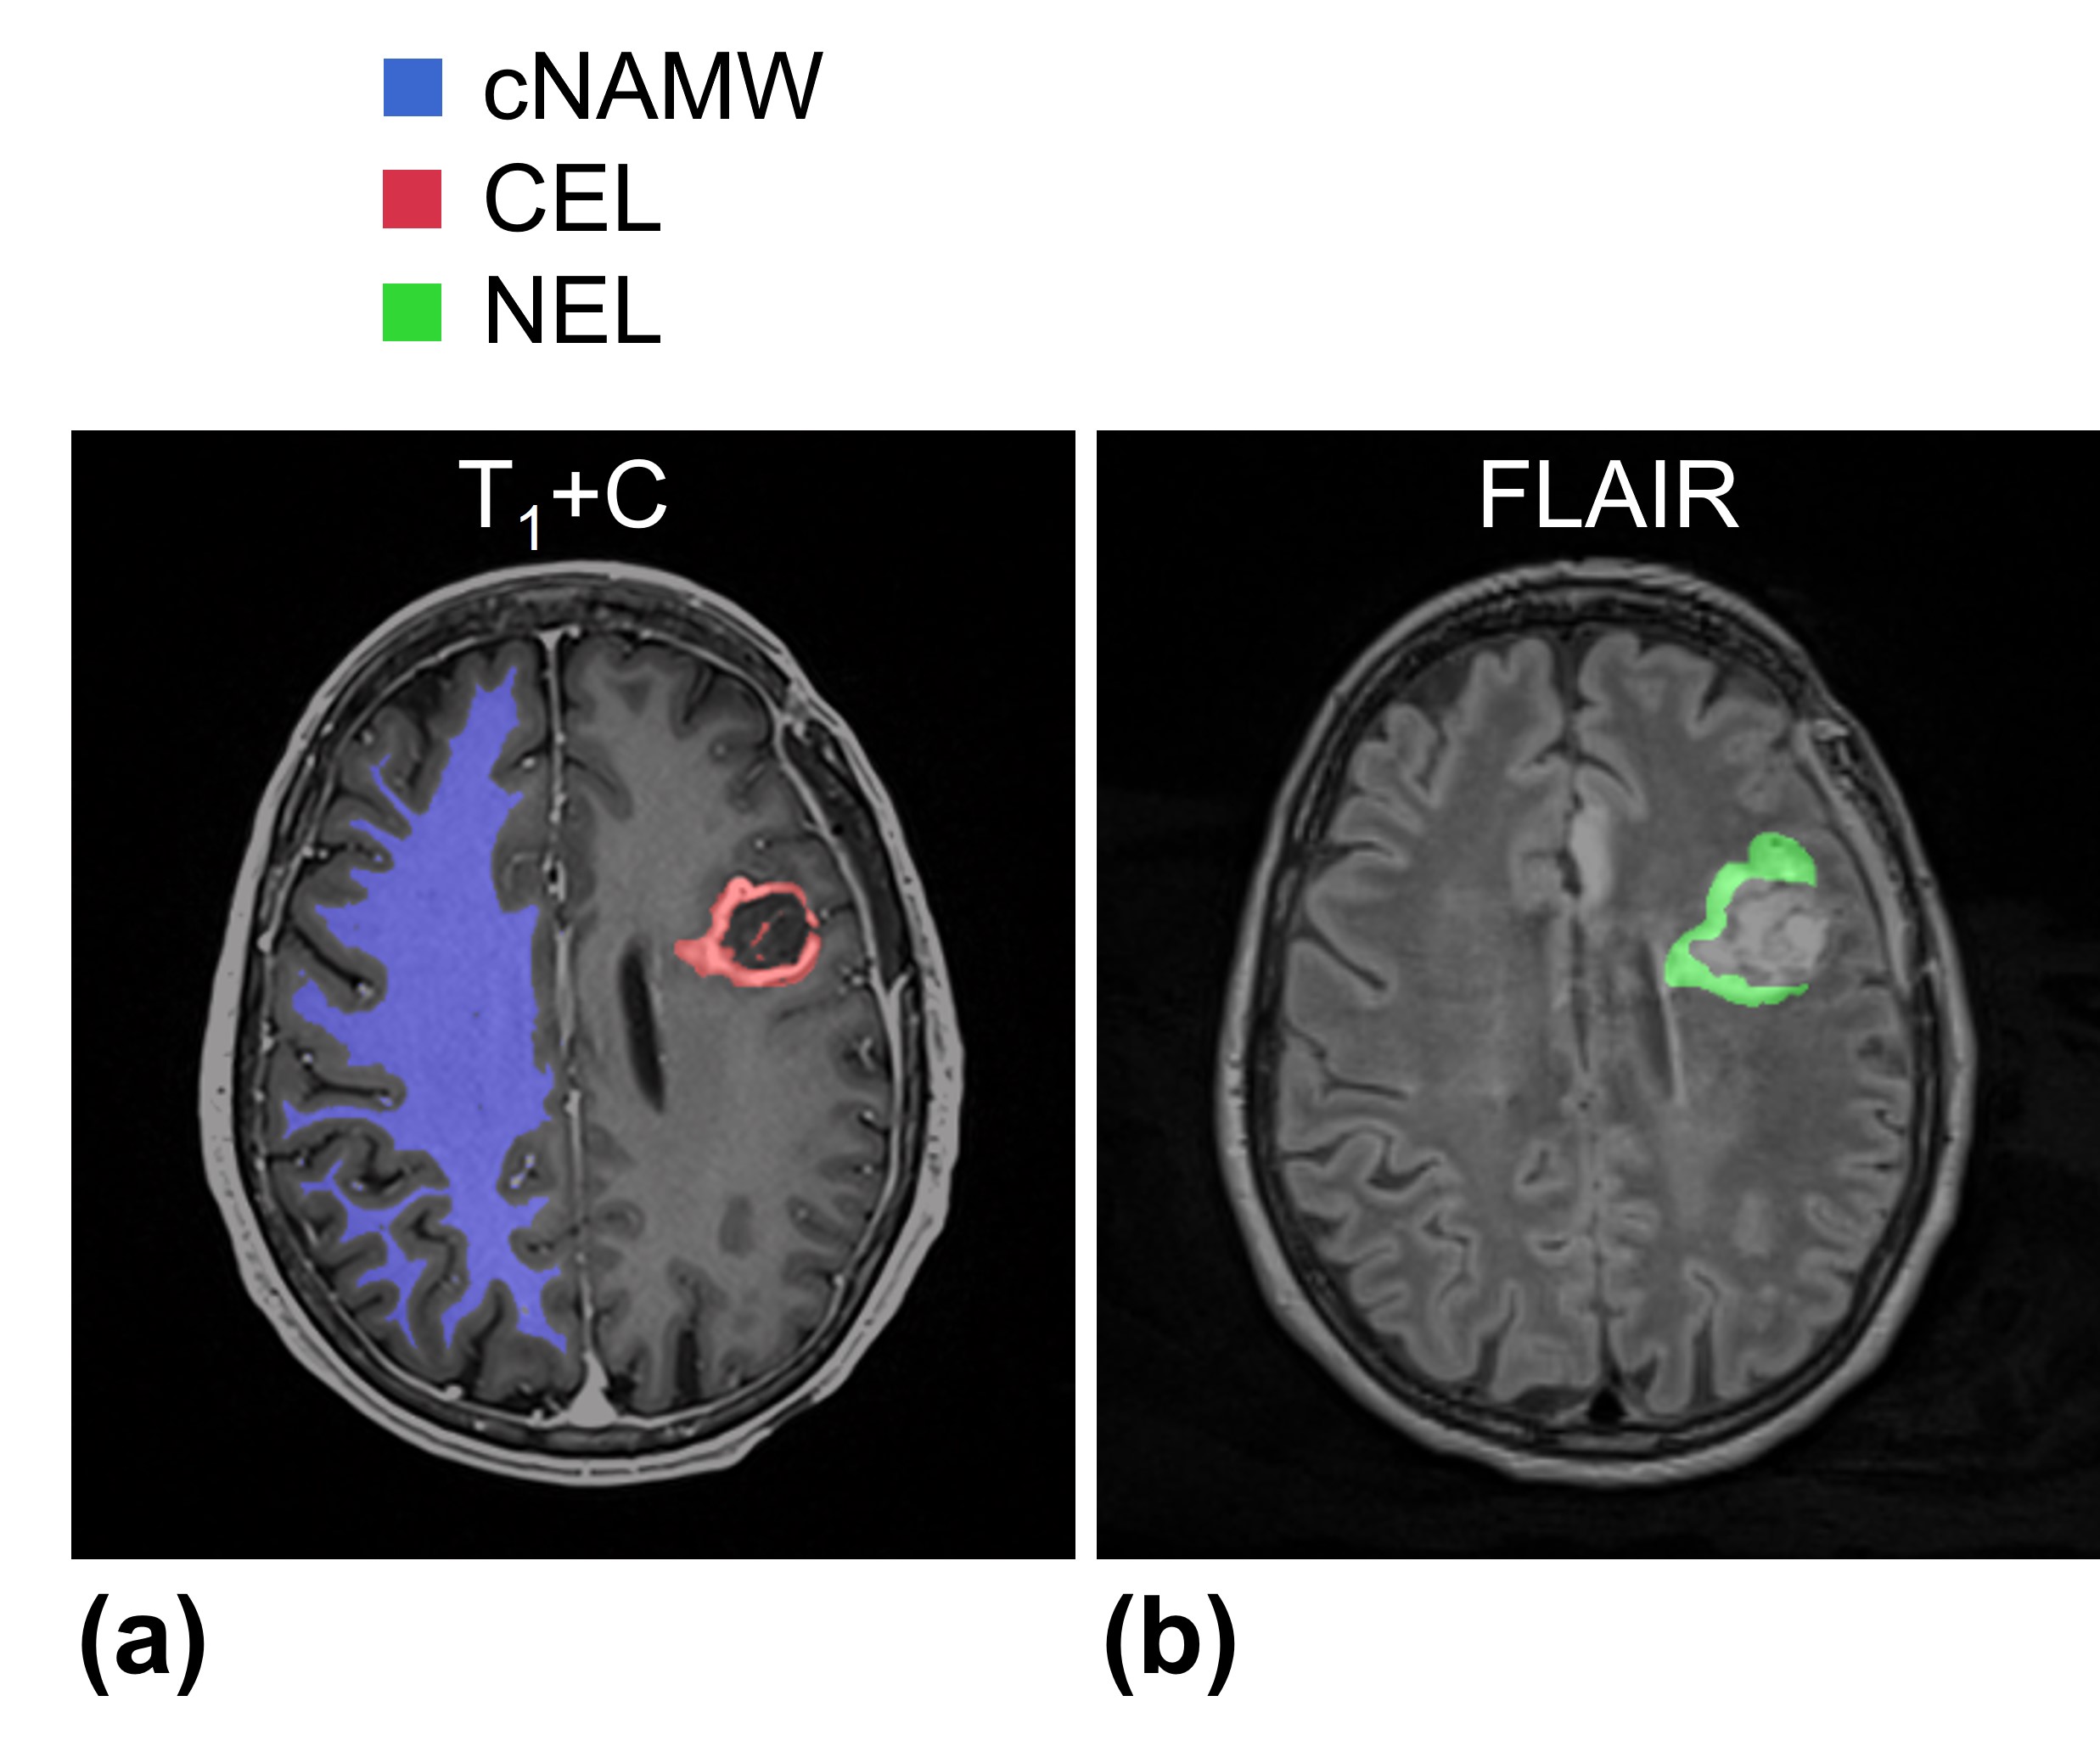
T2* maps were generated by fitting the signal intensity of the GRE images with a single monoexponential. QSM maps were generated based on the total-generalized-variation (TGV-QSM) method using the GRE images with TE of 21 ms12. In each subject, the T2* and QSM maps of the three time points and FLAIR images were co-registered to the 4-hour post-P-AscH- T1+C images using an affine transformation (Fig. 1)13. For volume-of-interest (VOI) analysis, the contrast-enhancing lesions (CEL) and non-enhancing lesions (NEL) were manually segmented on the T1+C and FLAIR images (Fig. 2). Contralateral normal-appearing white matter (cNAWM) was segmented on the T1+C images using SPM (http://www.fil.ion.ucl.ac.uk/spm/). Regions with necrosis, hemorrhage, or post-surgical cavities were excluded from the analysis.
Statistics
The mean values of 1-hour and 4-hour post-P-AscH- T2* and QSM within VOIs were compared with those obtained prior to P-AscH- administration using a Wilcoxon Signed Rank test. The significance level was adjusted to be p < 0.0042 using the Bonferroni correction for multiple comparisons (2 comparisons per VOI × 3 VOIs × 2 metrics).
RESULTS
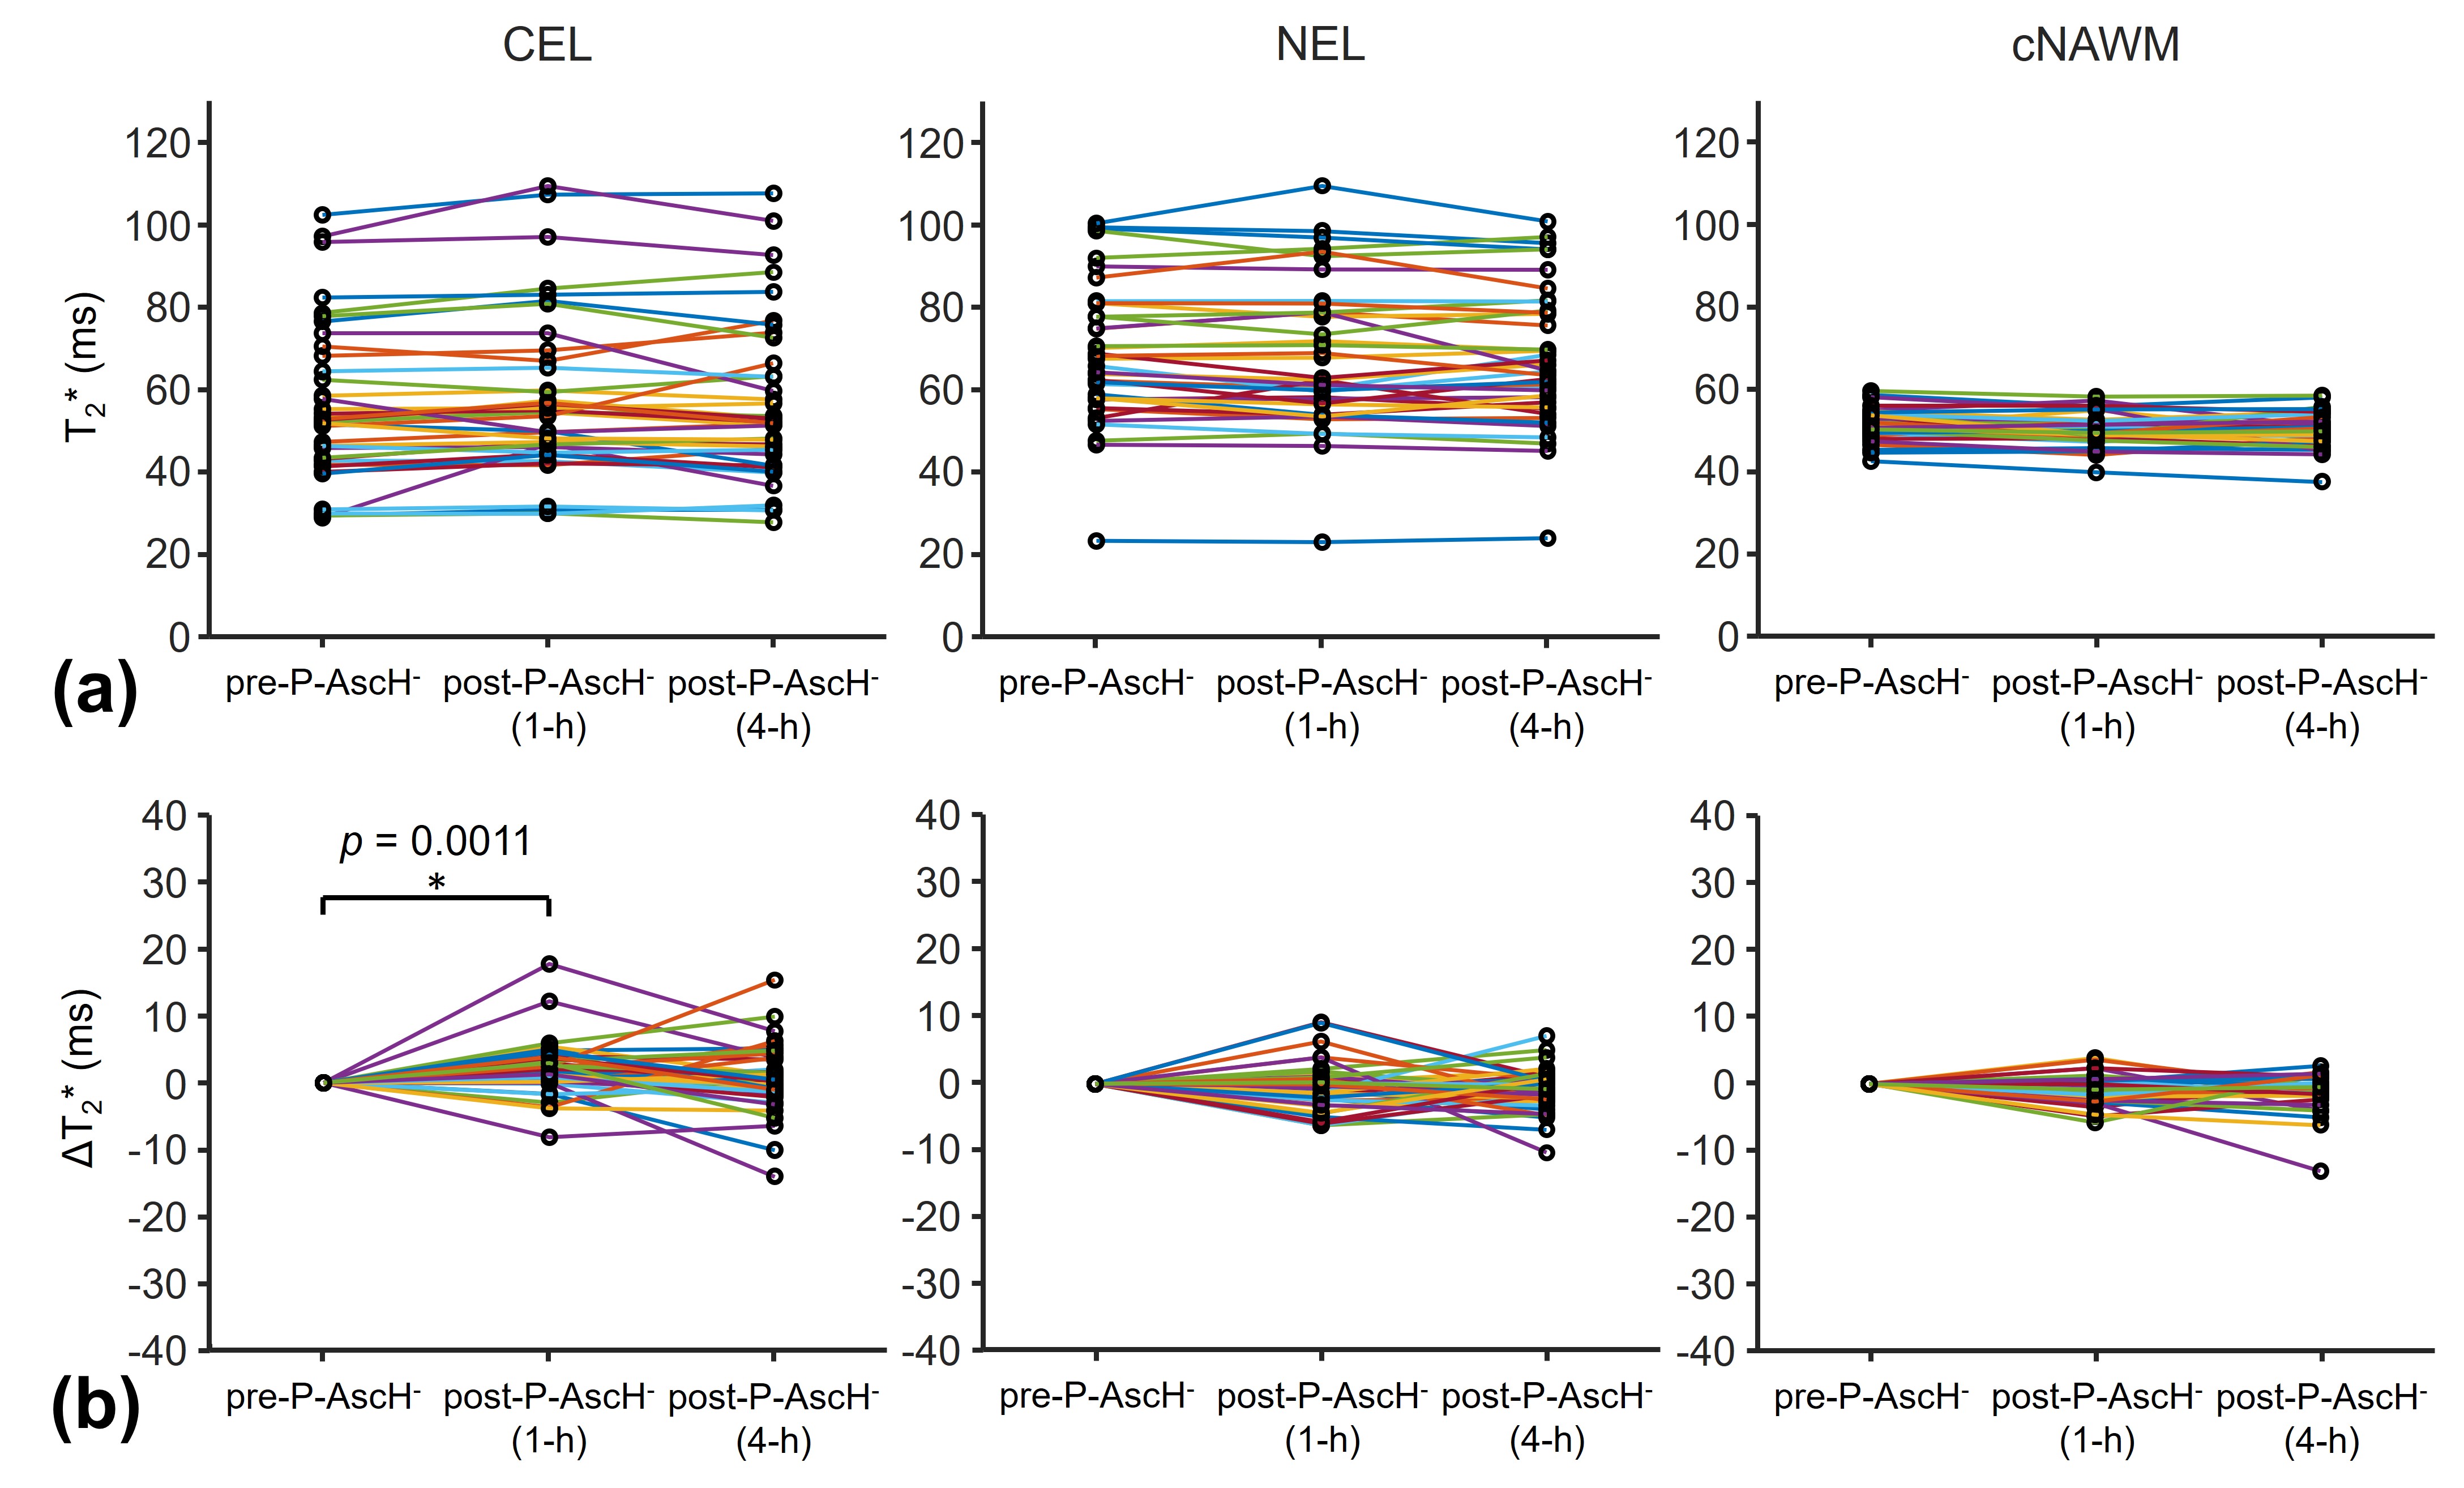
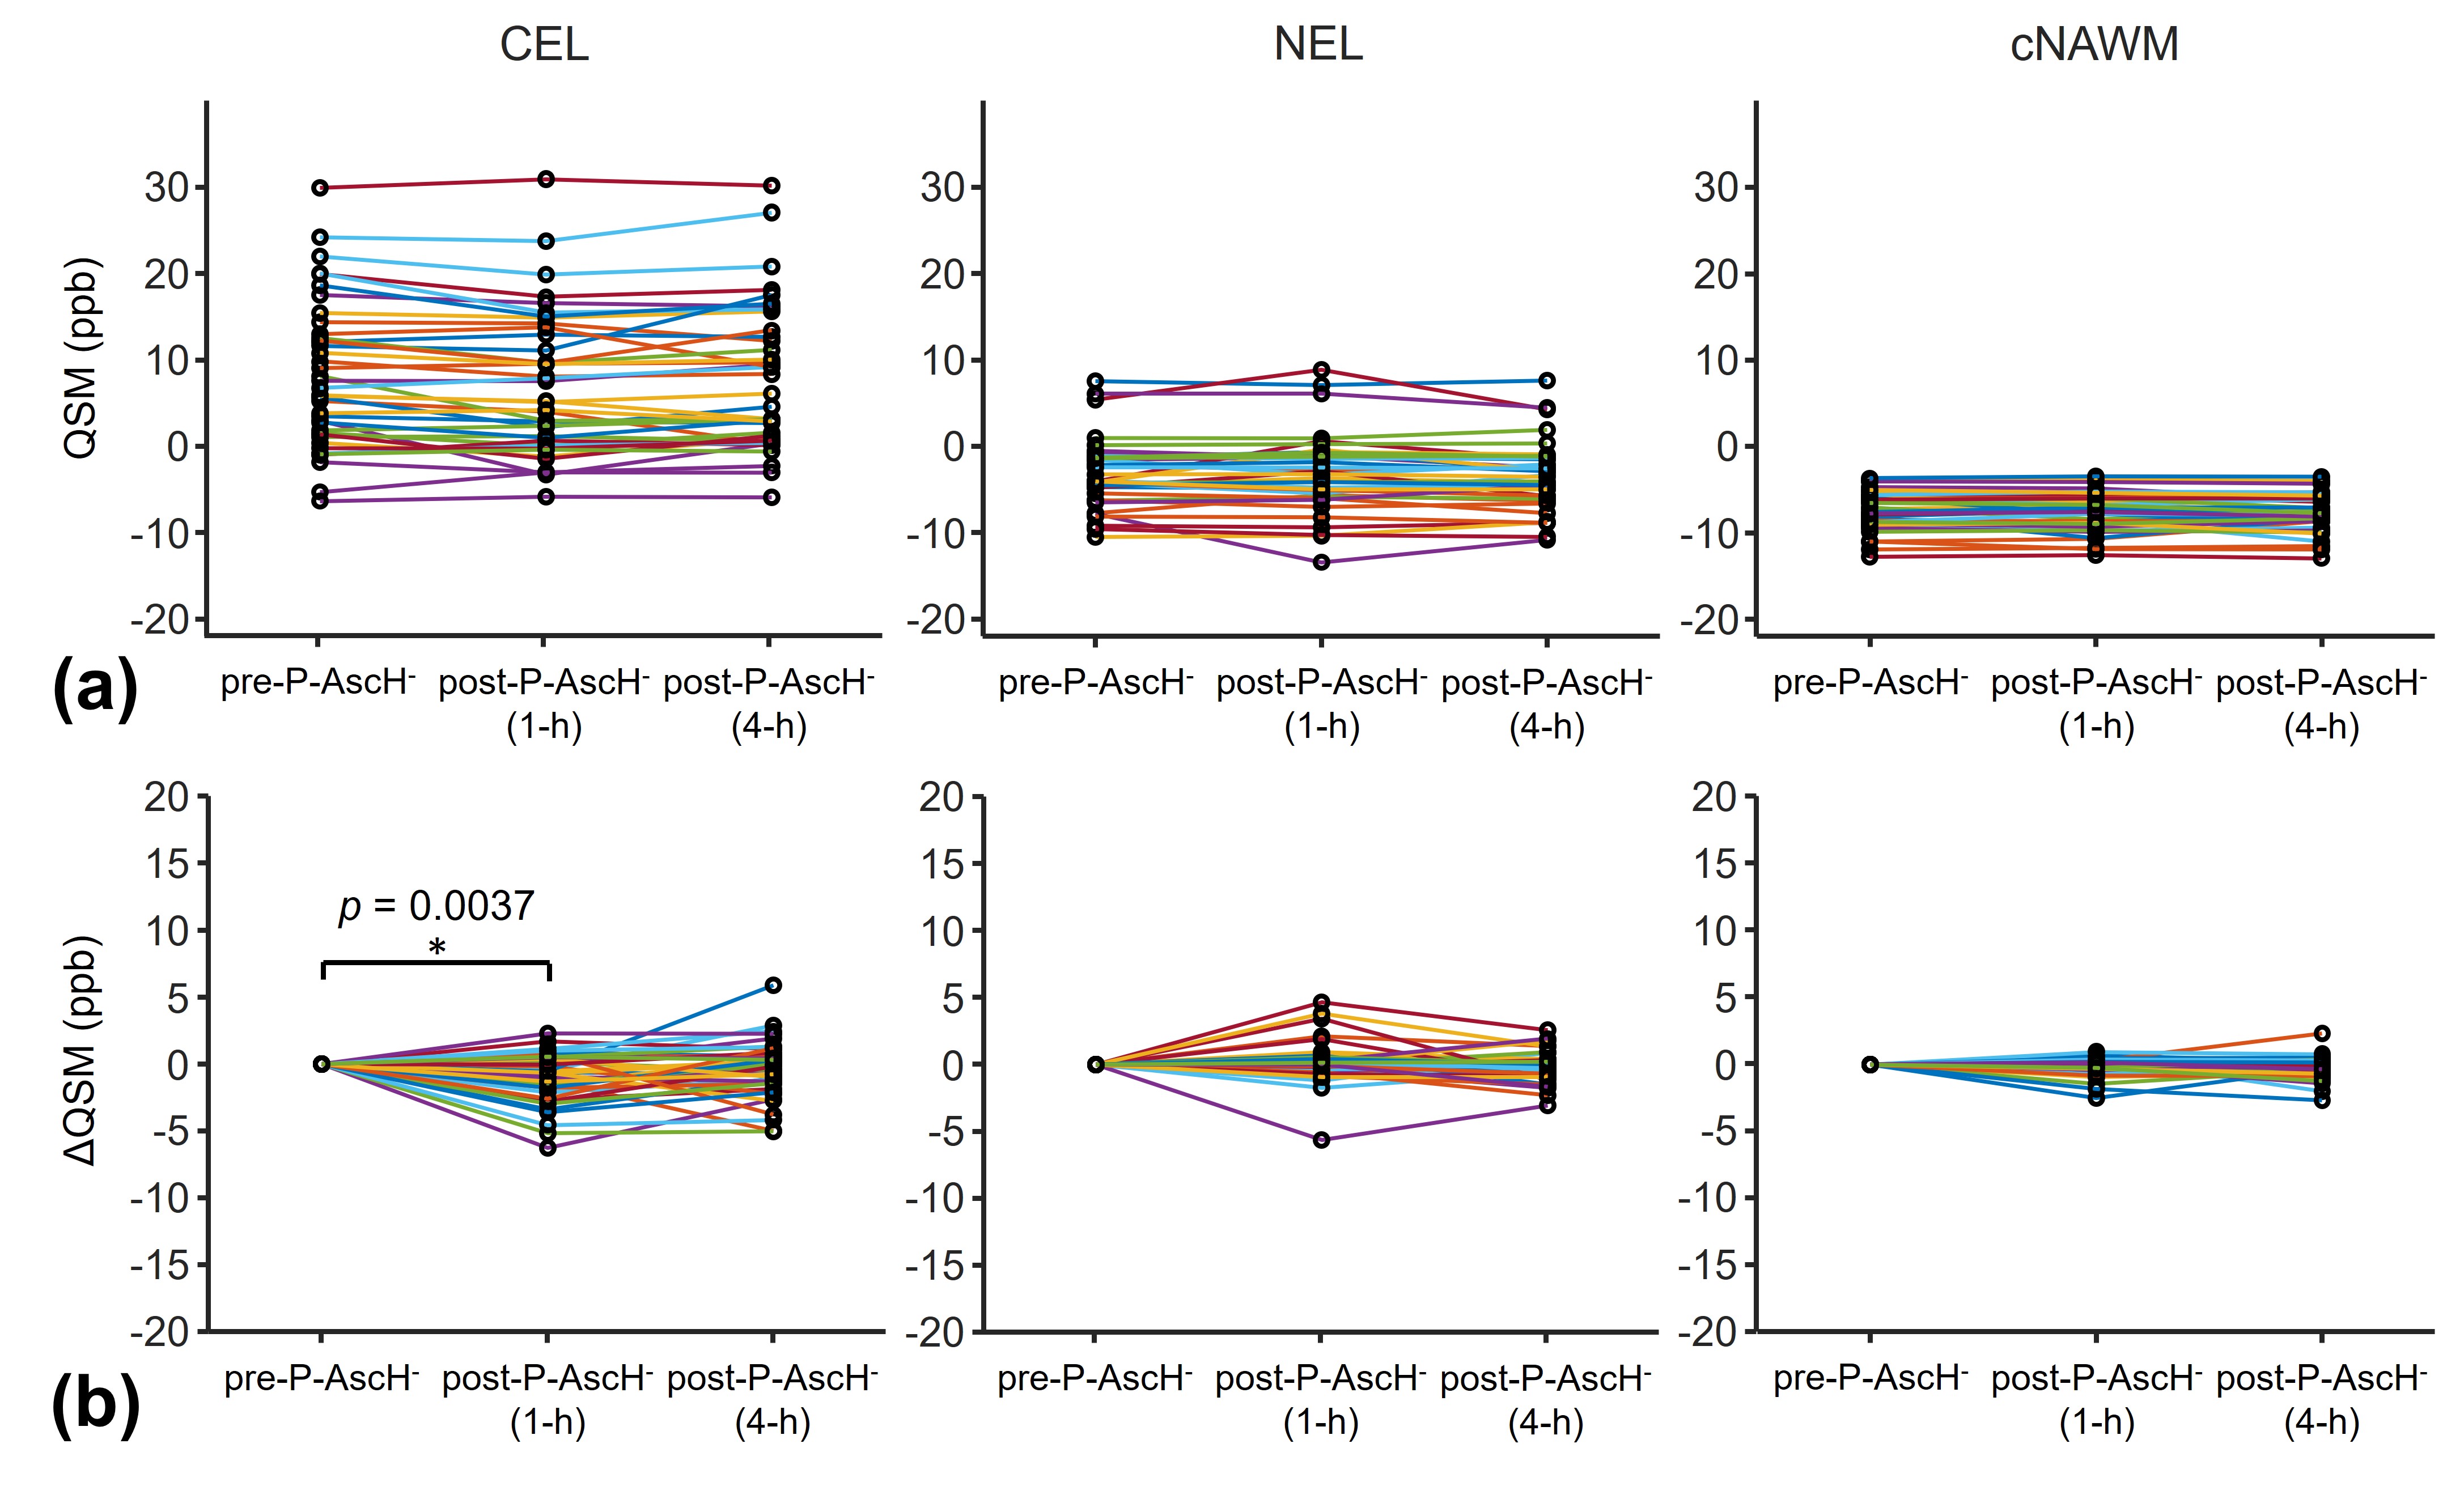
The inter-subject variations of T2* and QSM values were larger in CEL and NEL than in cNAWM (Figs. 3a and 4a), suggesting higher tissue heterogeneity in tumors. CEL showed a significant increase in T2* values and a significant decrease in QSM values 1 hour after P-AscH- infusion (Figs. 3b and 4b). NEL and cNAWM showed no significant changes in T2* and QSM values after P-AscH- infusion.DISCUSSION
The reported changes in T2* and QSM values 1 hour after P-AscH- infusion in CEL agreed with our previous preliminary findings9. These changes may result from the reduction of ferric iron (Fe3+) to ferrous iron (Fe2+) by P-AscH- that leads to an increased transverse relaxation time and decreased magnetic susceptibility7-10. These redox changes are expected to be higher in tumors than in normal tissue due to higher levels of superoxide, H2O2, and more dysregulated LIP in tumors4. This may explain the observed significant changes in T2* and QSM values occurring specifically in CEL but not in cNAWM.CONCLUSION
This study demonstrates changes in T2* and QSM associated with P-AscH- in a cohort of 40 subjects with glioblastoma, supporting the potential for in vivo assessment of response to P-AscH- using T2* and QSM. Future work will investigate the correlation of T2* and QSM measurements with the clinical outcomes.Acknowledgements
This work was supported by the National Institutes of Health grants P01 CA217797, R01 CA169046, U01 CA140206, R01 CA182804, and T32 CA078586, as well as the Gateway for Cancer Research grant G-17-1500. Core facilities were supported in part by the Carver College of Medicine and the Holden Comprehensive Cancer center, National Institutes of Health (P30CA086862, S10OD025025, and S10RR028821).References
1. Chen Q, Espey MG, Sun AY, et al. Pharmacologic doses of ascorbate act as a prooxidant and decrease growth of aggressive tumor xenografts in mice. Proc Natl Acad Sci U S A. 2008;105(32):11105–11109.
2. Du J, Cullen JJ, Buettner GR. Ascorbic acid: chemistry, biology and the treatment of cancer. Biochim Biophys Acta. 2012;1826(2):443–457.
3. Espey MG, Chen P, Chalmers B, et al. Pharmacologic ascorbate synergizes with gemcitabine in preclinical models of pancreatic cancer. Free Radic Biol Med. 2011;50(11):1610–1619.
4. Schoenfeld JD, Sibenaller ZA, Mapuskar KA, et al. O2⋅− and H2O2-mediated disruption of Fe metabolism causes the differential susceptibility of NSCLC and GBM cancer cells to pharmacological ascorbate. Cancer Cell. 2017;31:487–500.
5. Du J, Wagner BA, Buettner GR, et al. Role of labile iron in the toxicity of pharmacological ascorbate. Free Radic Biol Med. 2015;84:289–295.
6. Moser JC, Rawal M, Wagner BA, et al. Pharmacological ascorbate and ionizing radiation (IR) increase labile iron in pancreatic cancer. Redox Biol. 2013;2:22–27.
7. Dietrich O, Levin J, Ahmadi SA, et al. MR imaging differentiation of Fe2+ and Fe3+ based on relaxation and magnetic susceptibility properties. Neuroradiology. 2017;59(4):403-409.
8. Petronek MS, St-Aubin JJ, Lee CY, et al. Quantum chemical insight into the effects of the local electron environment on T2*-based MRI. Sci Rep. 2021;11(1):20817.
9. Cushing CM, Petronek MS, Bodeker KL, et al. Magnetic resonance imaging (MRI) of pharmacological ascorbate-induced iron redox state as a biomarker in subjects undergoing radio-chemotherapy. Redox Biol. 2021;38:101804.
10. Birkl C, Birkl-Toeglhofer AM, Kames C, et al. The influence of iron oxidation state on quantitative MRI parameters in post mortem human brain. Neuroimage. 2020;220:117080.
11. Allen BG, Bodeker KL, Smith MC, et al. First-in-human phase I clinical trial of pharmacologic ascorbate combined with radiation and temozolomide for newly diagnosed glioblastoma. Clin Cancer Res. 2019;25(22):6590-6597.
12. Langkammer C, Bredies K, Poser BA,et al. Fast quantitative susceptibility mapping using 3D EPI and total generalized variation. Neuroimage. 2015;111:622-30.
13. Johnson HJ, Harris G, Williams K, BRAINSFit: mutual information registrations of whole-brain 3D images, using the insight toolkit, The Insight Journal. (2007) 180.
Figures