4955
Lower functional connectivity in areas of reduced cerebrovascular reactivity in elderly patients with long COVID1Radiology, Medical College of Wisconsin, Milwaukee, WI, United States, 2Medical College of Wisconsin, Milwaukee, WI, United States, 3GE Healthcare, Waukesha, WI, United States
Synopsis
Patients suffering from long COVID report cognitive symptoms months after disease onset, which may be related to neurovascular changes. Here, we evaluated functional connectivity in long COVID elderly patients and control subjects using a region of lower cerebrovascular reactivity (CVR) as the seed. We found significantly lower connectivity in long COVID patients that was widespread potentially linking alterations in CVR to functional connectivity and reduced cognitive ability in long COVID patients.
Introduction
Many patients who have contracted COVID-19 suffer from symptoms long after the onset of the virus infection (long COVID). Up to 30% of patients report symptoms after three months1 including memory loss and so-called “brain fog”2. Recent evidence suggests COVID-19 often causes neurological symptoms via disrupted neurovascular function3, however the mechanisms causing this cognitive dysfunction are largely unknown. In this study we used an advanced multiband multi-echo (MBME) EPI sequence4-7 to measure and compare cerebrovascular reactivity (CVR) and resting-state functional connectivity between a group of elderly patients suffering from long COVID and age-matched control subjects.Methods
In total, 10 long COVID patients (8 women, 2 men; age range = 56-75 years old, mean = 61.60 ± 6.17) and seven age-matched control subjects were imaged on a 3T GE scanner. On average, the time between COVID diagnosis and fMRI scan was 332.4 days (range = 220-447). Subjects underwent a breath hold (BH) task fMRI scan and a resting state fMRI scan using a MBME EPI sequence4-7 and the following parameters: TR/TE=1000/11,30,49ms, FOV=24cm, matrix size=80x80 with slice thickness = 3mm (3x3x3mm voxel size), 11 slices with multiband factor=4 (44 total slices), FA=60°, partial Fourier factor=0.85, and in-plane acceleration (R)=2. The BH task consisted of 66 s of paced breathing, followed by four cycles of 24 s of paced breathing, 16s of BH on expiration, and 16 s of self-paced recovery breathing. Scans ended with an additional 30s of paced breathing7. The paced breathing portions consisted of alternating 3s inspiration and expiration blocks. A T1-weighted MPRAGE anatomical image was also collected.Data was analyzed using a combination of AFNI8 and FSL9. First, the anatomical image was coregistered to Montreal Neurological Institute (MNI) space. The first-echo dataset was then volume registered to the first volume. Subsequent echoes were registered using the transformation matrices from the first echo. Then, the three echoes were combined using the -weighted approach10. The data was then denoised using multi-echo independent component analysis (ME-ICA) and the open-source python script tedana.py version 0.0.1011-13. This technique classifies independent components as BOLD or non-BOLD based on whether their amplitudes are linearly dependent on TE11,12,14. Non-BOLD components were regressed out of the combined ME data resulting in a denoised dataset. The denoised MBME dataset was then registered to the MPRAGE image using and registered to MNI space using the anatomical transformations computed above. Finally, the data was smoothed using a 6mm FWHM Gaussian kernel. The resting state data was bandpass filtered with 0.01<f<0.1Hz.
The BH response was evaluated using a general linear model with 3dDeconvolve in AFNI. After 3dDeconvolve, a restricted maximum likelihood model (3dREMLfit) was used to model temporal autocorrelations in the data. BH regressors were generated by convolving a square wave with the respiration response function15 and shifting the regressor from −8s to 16s in steps of 2s. For each voxel, the regressor that resulted in the highest positive t-score was chosen. CVR was calculated as the percent signal change of the BH response. Voxelwise CVR was compared between long COVID and control groups using 3dttest++ in AFNI and thresholded at p<0.01 uncorrected.
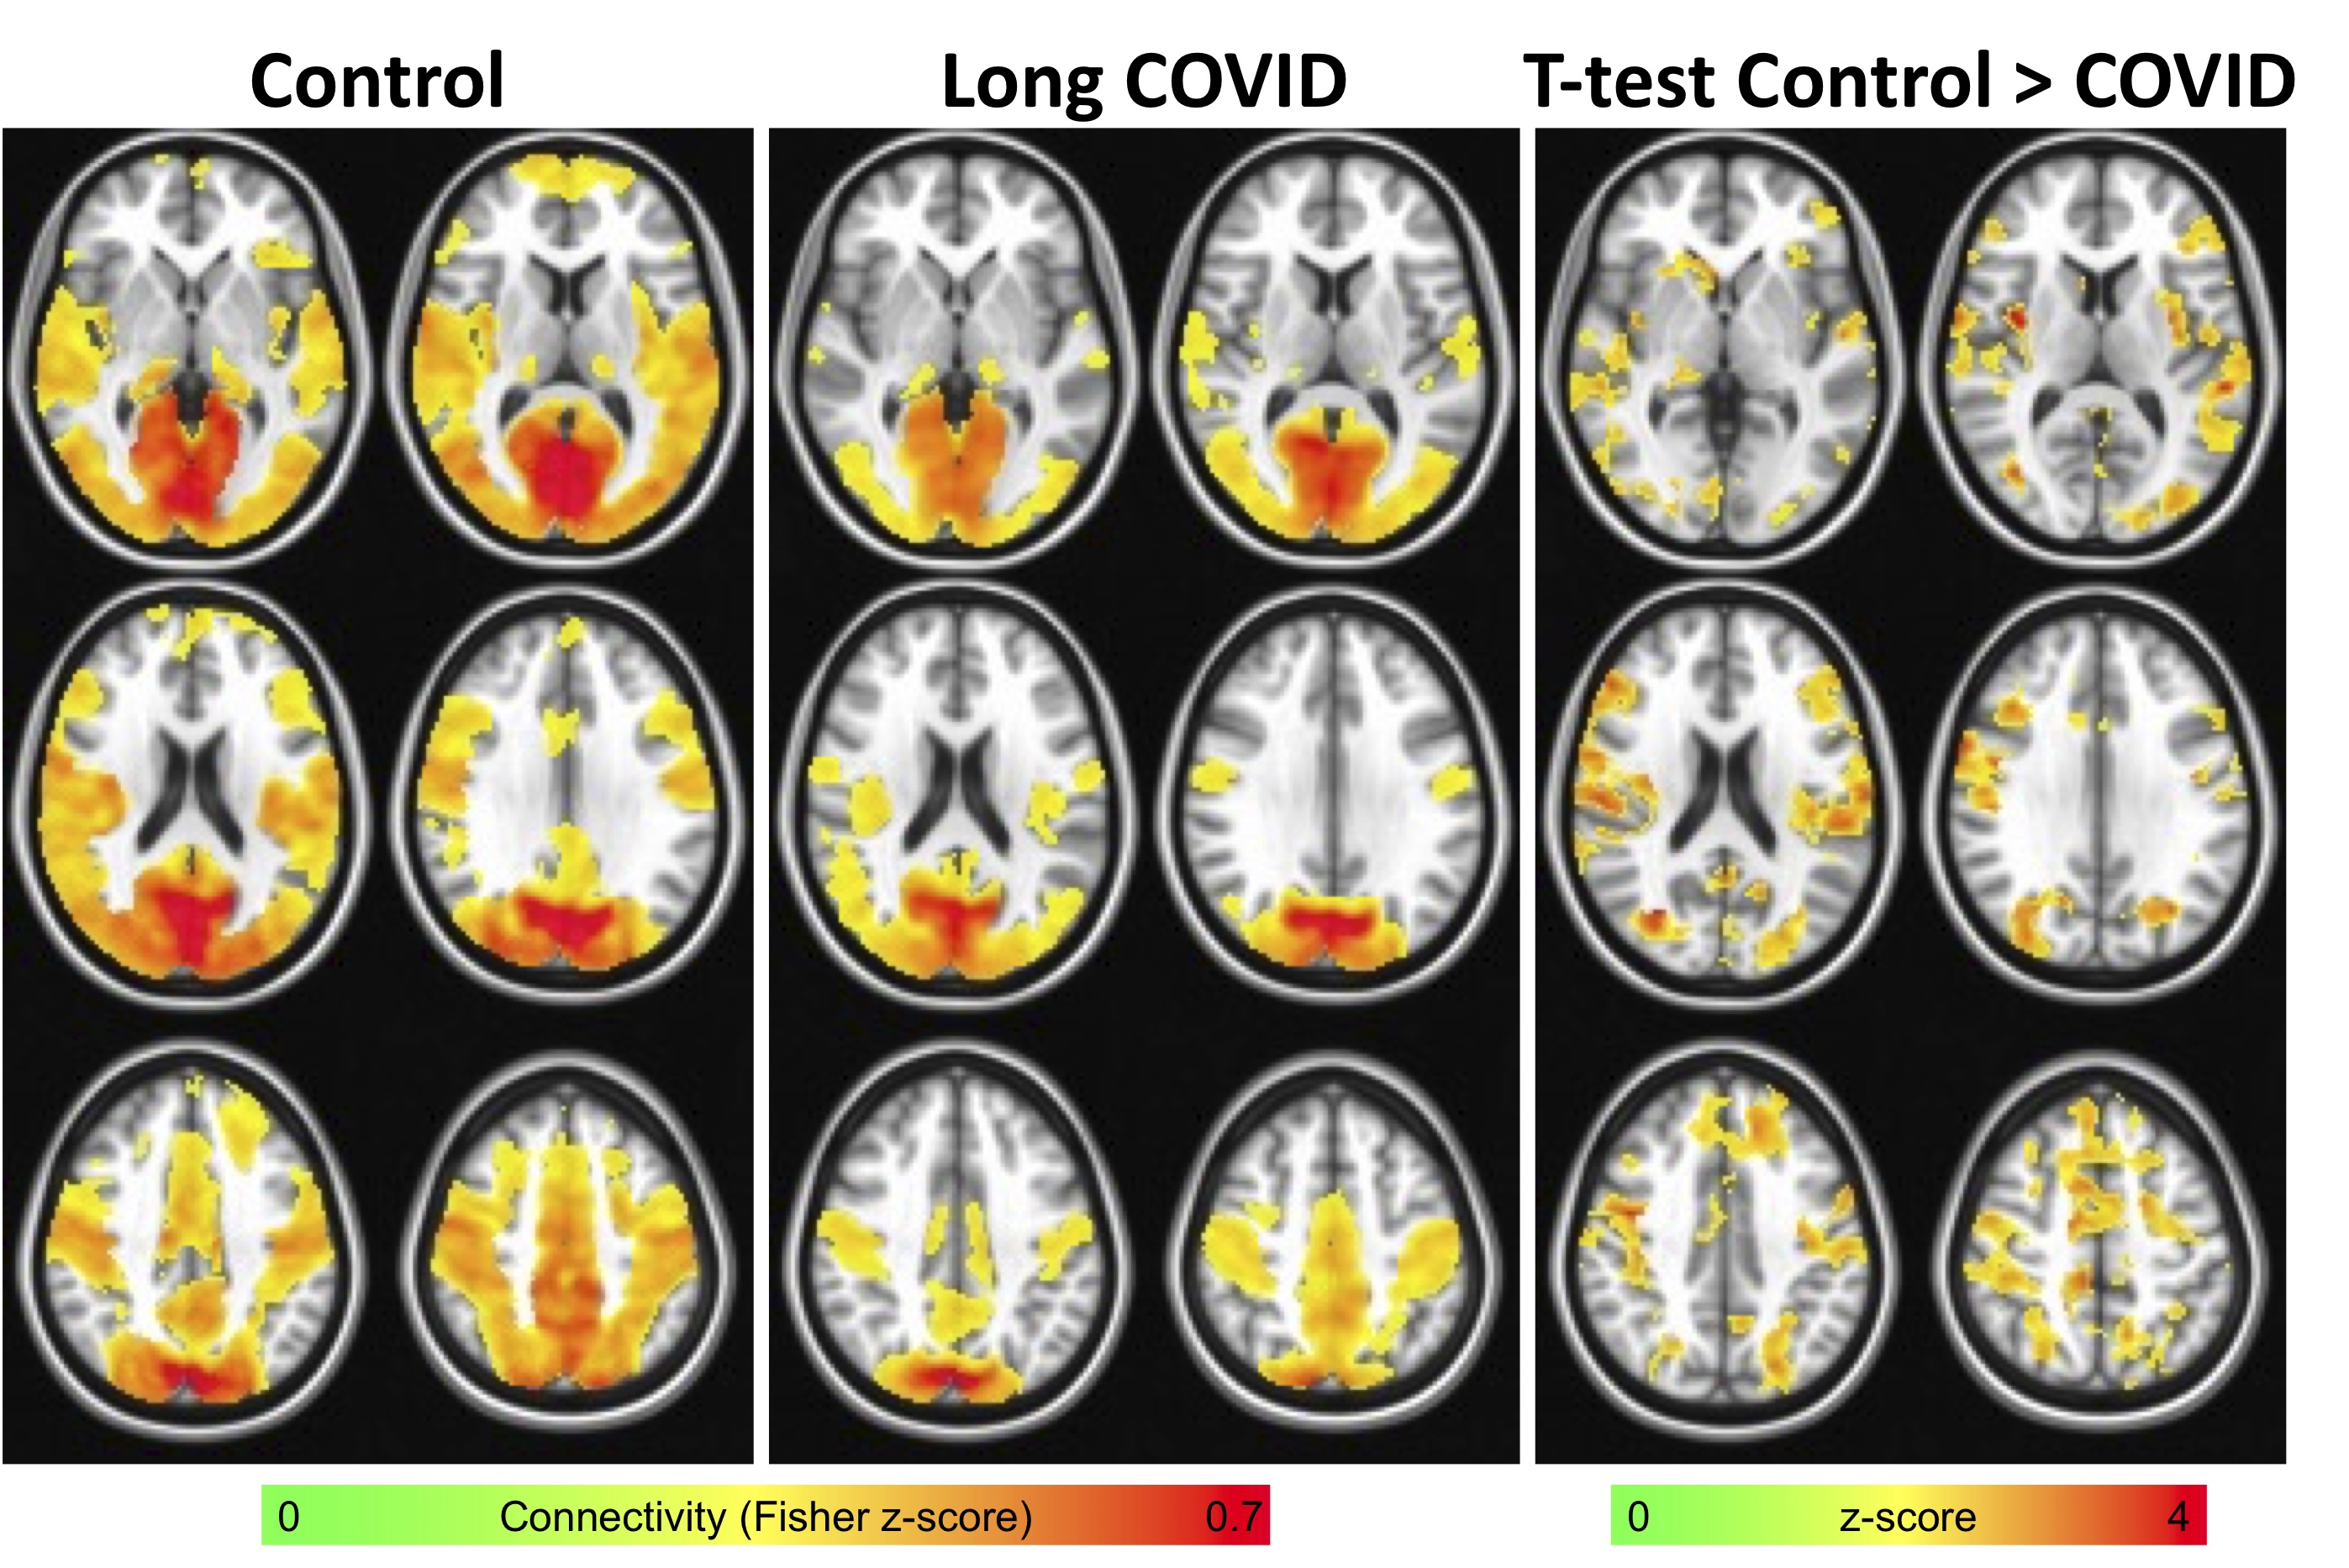
After identifying the clusters with significantly different CVR between groups, the largest cluster was extracted and used as a seed in a seed-based rs-fMRI analysis. The mean signal time series within this seed was extracted and correlated with every other voxel in the brain. Correlation maps were converted to z-score maps using Fisher z-transformation. The resulting connectivity maps were compared between groups using 3dttest++ in AFNI. 3dClustSim was used to correct for multiple comparisons resulting in a minimum cluster size of 12500 voxels for p<0.05 and α<0.05.
Results
Long COVID patients reported significant fatigue, worsened memory, and new onset attention/executive function problems that persisted since COVID diagnosis. Figure 1 shows the results of the CVR analysis. In general, lower CVR was seen in the long COVID patients. The largest cluster was found in the area of cuneus and precuneus. Figure 2 shows the results of the functional connectivity analysis using that cluster as a seed. In general, heightened connectivity was seen in the visual and motor networks for both COVID patients and controls. Qualitatively, control subjects showed higher connectivity in the dorsal attention and default mode network (DMN). A group comparison showed widespread higher connectivity for the control subjects vs. patients including in the parietal, temporal, medial prefrontal cortex and insula.Discussion
These preliminary results indicate alterations in CVR may be related to reduced functional connectivity changes in patients suffering from long COVID and associated neurological deficits. This is consistent with preliminary cognitive data supporting a reduction in cognitive efficiency, particularly for executive function tasks that simultaneously tax processing speed and verbal working memory. The neurovasculature plays a critical role in maintaining brain function by dynamically adapting the delivery of oxygenated blood to the tissue. The cumulative effects of many small vascular injuries could lead to substantial functional impairments which can be measured non-invasively via fMRI.Conclusion
Here, we provide evidence of altered functional connectivity in long COVID patients using a region of lower CVR as a seed. Future research is needed to validate these findings in a larger cohort and in longitudinal settings.Acknowledgements
No acknowledgement found.References
1. Tenforde MW, Kim SS, Lindsell CJ, et al. Symptom duration and risk factors for delayed return to usual health among outpatients with COVID-19 in a multistate health care systems network—United States, March–June 2020. Morbidity and Mortality Weekly Report. 2020;69(30):993.
2. Carfi A, Bernabei R, Landi F, Gemelli Against C-P-ACSG. Persistent Symptoms in Patients After Acute COVID-19. JAMA : the journal of the American Medical Association. Aug 11 2020;324(6):603-605. doi:10.1001/jama.2020.12603
3. Ellul MA, Benjamin L, Singh B, et al. Neurological associations of COVID-19. Lancet neurology. Sep 2020;19(9):767-783. doi:10.1016/S1474-4422(20)30221-0
4. Cohen AD, Chang C, Wang Y. Using multiband multi-echo imaging to improve the robustness and repeatability of co-activation pattern analysis for dynamic functional connectivity. NeuroImage. Nov 2021;243:118555. doi:10.1016/j.neuroimage.2021.118555
5. Cohen AD, Jagra AS, Yang B, Fernandez B, Banerjee S, Wang Y. Detecting Task Functional MRI Activation Using the Multiband Multiecho (MBME) Echo-Planar Imaging (EPI) Sequence. J Magn Reson Imaging. May 2021;53(5):1366-1374. doi:10.1002/jmri.27448
6. Cohen AD, Yang B, Fernandez B, Banerjee S, Wang Y. Improved resting state functional connectivity sensitivity and reproducibility using a multiband multi-echo acquisition. NeuroImage. Jan 15 2021;225:117461. doi:10.1016/j.neuroimage.2020.117461
7. Cohen AD, Jagra AS, Visser NJ, et al. Improving the Breath-Holding CVR Measurement Using the Multiband Multi-Echo EPI Sequence. Original Research. Front Physiol. 2021-February-26 2021;12(97):619714. doi:10.3389/fphys.2021.619714
8. Cox RW. AFNI: software for analysis and visualization of functional magnetic resonance neuroimages. Computers and biomedical research, an international journal. Jun 1996;29(3):162-73. doi:10.1006/cbmr.1996.0014
9. Jenkinson M, Beckmann CF, Behrens TE, Woolrich MW, Smith SM. Fsl. Neuroimage. Aug 15 2012;62(2):782-90. doi:10.1016/j.neuroimage.2011.09.015
10. Posse S, Wiese S, Gembris D, et al. Enhancement of BOLD-contrast sensitivity by single-shot multi-echo functional MR imaging. Magn Reson Med. Jul 1999;42(1):87-97. doi:10.1002/(sici)1522-2594(199907)42:1<87::aid-mrm13>3.0.co;2-o
11. Kundu P, Brenowitz ND, Voon V, et al. Integrated strategy for improving functional connectivity mapping using multiecho fMRI. Proceedings of the National Academy of Sciences. Oct 1 2013;110(40):16187-16192. doi:10.1073/pnas.1301725110
12. Kundu P, Inati SJ, Evans JW, Luh WM, Bandettini PA. Differentiating BOLD and non-BOLD signals in fMRI time series using multi-echo EPI. Neuroimage. Apr 15 2012;60(3):1759-70. doi:10.1016/j.neuroimage.2011.12.028
13. DuPre E, Salo T, Markello R, Kundu P, Whitaker K, Handwerker D. ME-ICA/tedana: 0.0.6: https://doi.org/10.5281/zenodo.2558498. https://doi.org/10.5281/zenodo.2558498
14. Olafsson V, Kundu P, Wong EC, Bandettini PA, Liu TT. Enhanced identification of BOLD-like components with multi-echo simultaneous multi-slice (MESMS) fMRI and multi-echo ICA. Neuroimage. May 15 2015;112:43-51. doi:10.1016/j.neuroimage.2015.02.052
15. Birn RM, Smith MA, Jones TB, Bandettini PA. The respiration response function: the temporal dynamics of fMRI signal fluctuations related to changes in respiration. NeuroImage. Apr 1 2008;40(2):644-654. doi:10.1016/j.neuroimage.2007.11.059
Figures