4953
Bone marrow fat quantification on vertebral and lower extremities using in-vivo MR spectroscopy: diabetes patients v.s healthy control
Po-hung Wu1, Kaipin Xu2, Gabby Joseph1, Yan Li1, Xiaojuan Li2, Thomas Link1, and Galateia Kazakia1
1Radiology and Biomedical Imaging, University of California - San Francisco, San Francisco, CA, United States, 2Biomedical Engineering, Program of Advanced Musculoskeletal Imaging (PAMI), Cleveland Clinic, Cleveland, OH, United States
1Radiology and Biomedical Imaging, University of California - San Francisco, San Francisco, CA, United States, 2Biomedical Engineering, Program of Advanced Musculoskeletal Imaging (PAMI), Cleveland Clinic, Cleveland, OH, United States
Synopsis
Patients with type II diabetes (T2D) have increased fracture risk. Increased bone marrow fat is associated with increased fracture risk. We hypothesized that T2D patients will have altered bone marrow fat (BMF) and marrow composition biomarkers. In this study, we performed magnetic resonance spectroscopy (MRS) to quantify BMF and composition biomarkers at the spine in 37 T2D patients and 36 controls, and at the distal tibia in 30 T2D patients 32 controls. The results suggest that T2D may change vertebral marrow composition, particularly in men, which may be a factor in the development of increased bone fragility related to T2D.
Purpose
Type 2 diabetes (T2D) is a growing worldwide disease that is known to negatively influence bone quality1. Patients with T2D have increased fracture risk despite normal or even elevated bone mineral density (BMD) 2. Recently, the association of bone marrow fat (BMF) with bone quality and strength has been a focus of research. Several studies demonstrated that increased BMF is highly associated with low BMD, poor bone structure or increased fracture risk3,4. MR spectroscopy (MRS) is a non-invasive, in-vivo technique that is widely used to quantify BMF and provides several biomarkers for better understanding the relationship between altered BMF and bone diseases5,6. The purpose of this study is to quantify and compare the BMF of T2D patients and healthy controls at the spine and lower extremities using MRS technique. We hypothesize that T2D patients will have altered BMF and bone marrow composition biomarkers at the vertebrae and distal tibia.Methods
Participants with T2D and diabetes pharmacologic treatment for a minimum of 3 years were frequency matched for age, sex, and body mass index (BMI) with non-diabetic controls and enrolled in this study. For the vertebral scans, 37 T2D patients (17 males and 20 females; mean age = 61.3±5.5 years) and 36 controls (13 males and 23 females; mean age = 62.7±5.5 years) were included. For the distal tibia scans, 30 T2D patients (15 males and 15 females; mean age = 62.5±5.4 years) and 32 controls (13 males and 19 females; mean age = 60.7±5.6 years) were included. All participants were underwent DXA imaging and completed medical history questionnaires. They were included in the study only if they had a DXA T-score between 0 and −2.4 and did not take bone-active medications. Before performing MRS, a sagittal T2‐weighted fast spin echo (FSE) sequence (TR/TE = 4500/68ms, bandwidth = ±31.25 kHz/pixel; flip angle = 142° [vertebral] or 111° [distal Tibia]; FOV = 24mm [vertebral] or 16mm [distal tibia], slice thickness = 5mm) was performed on a 3T whole-body scanner (MR750, GE Healthcare) for visual inspection of bone fractures and leisions as well as for prescription of the MRS acquisition box. Single voxel MRS data were acquired using Stimulated Echo Acquisition Mode (STEAM) method with the sequence parameters: TR/TE = 3000/20ms [vertebral] or 3000/30ms [distal tibia]; BW=5 kHz; data point=4096. For vertebral scans, the volume of interest (15 x 12 x 12 mm) was located in the center of the vertebral bodies L3 and L4. For distal tibia scans, the 15 x 10 x 10 mm single voxel was located with the center 34.5 mm proximal to the joint line. MRS data were analyzed using in-house software based on previous work7. Each individual channel data were processed with frequency and phase corrections and then combined using the peak at 1.3ppm. Smoothing (line broadening = 15) was applied on the combined signal to remove noise. Spectra data were fitted using a Voigt model 8, and each biomarker was calculated as follows: (1) fat content (FC) = total lipids/water+total lipids, (2) unsaturated content (UC) = unsaturated lipid (5.3 ppm)/water+total lipids, (3) Saturated content (SC) = saturated lipid (1.3 ppm)/water+total lipids, and (4) residual content (RC) = residual lipid (2.0 ppm)/water+total lipids. Generalized estimating equations (accounting for multiple measurements per person) were used to assess the relationship between T2D and MRS outcomes in vertebral regions L3 and L4. Linear regression was used to assess the relationship between T2D and MRS outcomes in the distal tibia.Results
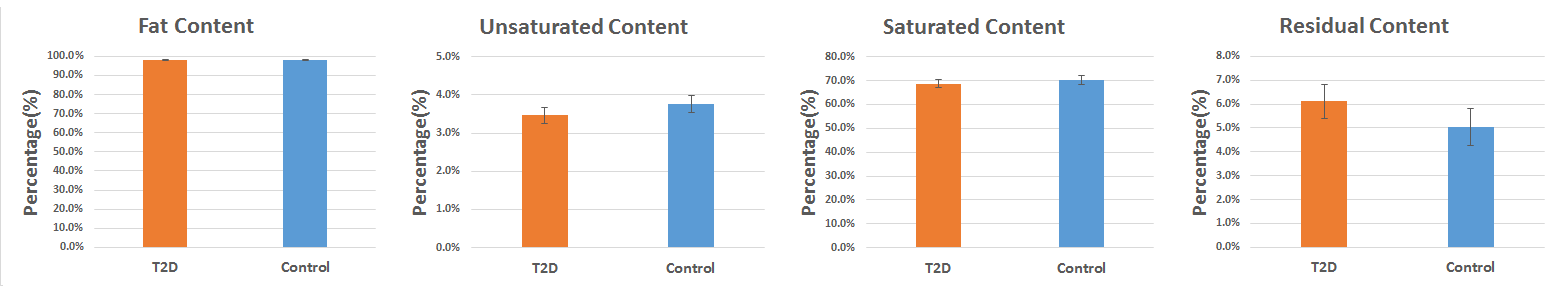
Examples of MRS data and fitting results are demonstrated in Fig. 1. In men, at the vertebra, UC was significantly lower in T2D patients compared to controls (coeff. = -0.61; 95%CI = [-1.08 -0.14]; p=0.011). FC trended lower in T2D patients compared to controls (coeff. = -3.96; 95%CI = [-8.48 0.56]; p=0.086) (Fig.2). In men, at the distal tibia, FC, UC, SC, and RC were similar between groups (Fig 3). In women, no significant differences were found between groups at either anatomic site (P>0.05).Discussion and Conclusions
We present a sex-stratified analysis of BMF and marrow composition, the results suggest a sex-specific relationship between T2D and marrow composition. In men (but not in women) we found lower unsaturated lipid levels within vertebral bone marrow in patients with T2D compared to controls. Contrary to our expectations, we did not find increased overall fat content in either T2D group. Previous reports are inconsistent, with some studies reporting decreased unsaturated lipid levels and increased overall fat content in T2D and others reporting no differences in unsaturated lipid and overall fat content between T2D and controls9-13.Taken as a whole, these data suggest that T2D may change vertebral marrow composition, which may be a factor in the development of diabetic bone pathology. However, more detailed analyses and larger cohort studies are necessary. Ongoing research will focus on longitudinal analyses to confirm the associations of BMF alterations with bone quality and strength, and particularly in the development of pathological porosity in T2D progression.Acknowledgements
This study is supported by NIH NIAMS R01AR069670, NIH NIAMS R01AR076159 and UCSF Academic Senate Committee on ResearchReferences
1. Vestergaard P. Discrepancies in bone mineral density and fracture risk in patients with type 1 and type 2 diabetes--a meta-analysis. Osteoporos Int. 2007 Apr;18(4):427-442. Schwartz AV, Vittinghoff E, Bauer DC, et al. Association of BMD and FRAX score with risk of fracture in older adults with type 2 diabetes. JAMA. 2011;305(21):2184-2192
3. Bredella MA, Torriani M, Ghomi RH, et al. Vertebral bone marrow fat is positively associated with visceral fat and inversely associated with IGF-1 in obese women. Obesity (Silver Spring). 2011;19(1):49-53
4. Griffith JF, Yeung DK, Antonio GE, et al. Vertebral marrow fat content and diffusion and perfusion indexes in women with varying bone density: MR evaluation. Radiology. 2006;241(3):831-838.
5. Yeung DK, Griffith JF, Antonio GE, Lee FK, Woo J, Leung PC. Osteoporosis is associated with increased marrow fat content and decreased marrow fat unsaturation: a proton MR spectroscopy study. J Magn Reson Imaging. 2005;22(2):279-285
6. Liney GP, Bernard CP, Manton DJ, Turnbull LW, Langton CM. Age, gender, and skeletal variation in bone marrow composition: a preliminary study at 3.0 Tesla. J Magn Reson Imaging. 2007;26(3):787-793 7. Li X, Kuo D, Schafer AL, et al. Quantification of vertebral bone marrow fat content using 3 Tesla MR spectroscopy: reproducibility, vertebral variation, and applications in osteoporosis. J Magn Reson Imaging. 2011;33(4):974-979
8. Xu K, Sigurdsson S, Gudnason V, Hue T, Schwartz A, Li X. Reliable quantification of marrow fat content and unsaturation level using in vivo MR spectroscopy. Magn Reson Med. 2018;79(3):1722-1729
9. Baum T, Yap SP, Karampinos DC, et al. Does vertebral bone marrow fat content correlate with abdominal adipose tissue, lumbar spine bone mineral density, and blood biomarkers in women with type 2 diabetes mellitus?. J Magn Reson Imaging. 2012;35(1):117-124
10. Patsch JM, Li X, Baum T, et al. Bone marrow fat composition as a novel imaging biomarker in postmenopausal women with prevalent fragility fractures. J Bone Miner Res. 2013;28(8):1721-1728
11. Yu EW, Greenblatt L, Eajazi A, Torriani M, Bredella MA. Marrow adipose tissue composition in adults with morbid obesity. Bone. 2017;97:38-42.
12. Sheu Y, Amati F, Schwartz AV, et al. Vertebral bone marrow fat, bone mineral density and diabetes: The Osteoporotic Fractures in Men (MrOS) study. Bone. 2017;97:299-305
13. Kim T, Schwartz AV, Li X, et al. Bone marrow adipose tissue composition and glycemic improvements after gastric bypass surgery. Bone "in review".
Figures
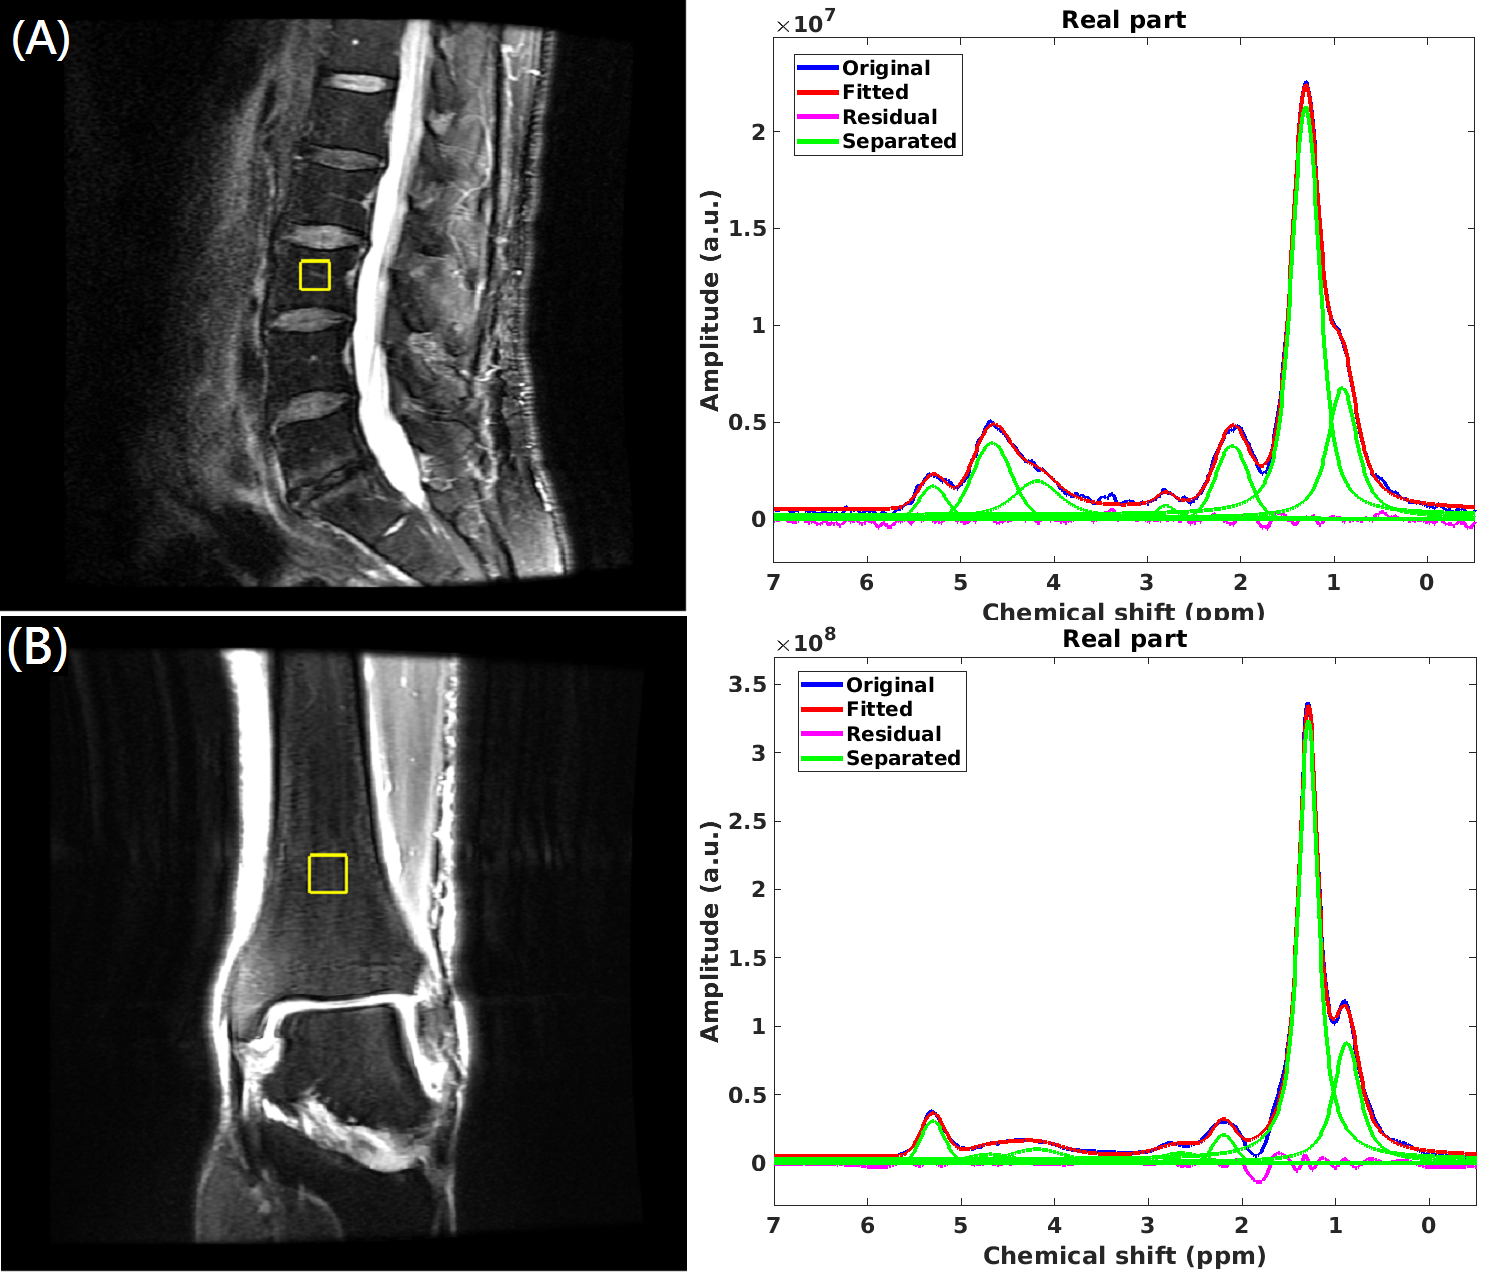
Representative MRS measurement box and spectra
fitting: (A) L3 vertebra and (B) distal tibia.

MRS biomarker
data at the vertebra in men, with adjustment for age and BMI. Data is displayed
as adjusted mean with standard error.
MRS biomarker
data at the distal tibia in men, with adjustment for age and BMI. Data is
displayed as adjusted mean with standard error.
DOI: https://doi.org/10.58530/2022/4953