4951
Fatty Acid Composition of Proximal Femur Bone Marrow in Subjects with Systemic Lupus Erythematous Using 3T Magnetic Resonance Spectroscopy
Dimitri Martel1, Amit Saxena2, H. Michael Belmont2, Stephen Honig3, Anmol Monga1, and Gregory Chang1
1Department of Radiology, NYU Langone Health, New York, NY, United States, 2Department of Rheumatology, NYU Langone Health, New York, NY, United States, 3Osteoporosis Center, Hospital for Joint Diseases, NYU Langone Health, New York, NY, United States
1Department of Radiology, NYU Langone Health, New York, NY, United States, 2Department of Rheumatology, NYU Langone Health, New York, NY, United States, 3Osteoporosis Center, Hospital for Joint Diseases, NYU Langone Health, New York, NY, United States
Synopsis
Systemic Lupus Erythematosus (SLE) is a chronic, inflammatory, multisystem disease predominantly affecting young women. Patients with SLE have a significantly worse health-related quality of life compared to healthy subjects or patients with other chronic diseases. MSK manifestations in SLE patients are common, including reductions in bone quality. Studies using magnetic magnetic resonance spectroscopy (MRS) have shown that change in bone marrow fat amount and composition is associated with decreased bone quality. The aim of our study was to use MRS to assess differences of BMAT in SLE without treatment (n=28), SLE treated (n=15) and controls (n=21).
Introduction
Systemic Lupus Erythematosus (SLE) is a chronic, inflammatory, multisystem disease predominantly affecting young women(1). Patients with SLE have a significantly worse health-related quality of life compared to healthy subjects or patients with other chronic diseases. MSK manifestations in SLE patients are common, including reductions in bone quality. Depending on the study, SLE patients demonstrate bone mineral density (BMD) T-scores consistent with osteopenia or osteoporosis(2-5). Furthermore, individuals with lupus are at increased risk for secondary osteoporosis mainly due to the glucocorticoid (GC) therapy commonly prescribed to reduce inflammation, leading to a further increase in bone fracture risk. Studies using magnetic resonance imaging (MRI) and magnetic resonance spectroscopy (MRS) have shown that an increase in bone marrow fat or bone marrow adipose tissue (BMAT) is associated with decreased BMD and that bone marrow adipose tissue composition could be a potential biomarker for bone health and quality. The aim of our study was to use MRS to assess differences of BMAT in SLE patients compared to controls.Material/Methods
This study had institutional review board approval, and written informed consent was obtained from all subjects. 64 female subjects were recruited and were divided into three groups: SLE GCs naïve (SLE, n=28), SLE GCs users (SLE GCs, n =15, >10mg daily intake of prednisone equivalent during at least 24 months) and controls (n=21). Subject characteristics are given in Table 1.A 3D FLASH sequence was acquired in the proximal femoral region for voxel placement. A voxel of 10x10x10mm3 was placed in the femoral neck and trochanter region. A stimulated echo acquisition mode (STEAM) sequence was used for acquisition with the following parameters: TR: 2500ms, TE=20ms, TM= 10ms, Bandwidth = 4000Hz, nPts= 2048, NA = 28, no water suppression, single averages were saved separately. Multiple acquisitions with TE= 30,50,80,100,123ms were acquired for T2 correction(6,7). Quantification was performed using jMRUI 5.2 software (8) with the AMARES method (9) and index reflecting fatty acids composition were computed according as in (10). Intergroup comparisons were carried out using ANOVA test with no difference among group means as null hypothesis with a statistical threshold of p<0.05 on p-values.Results
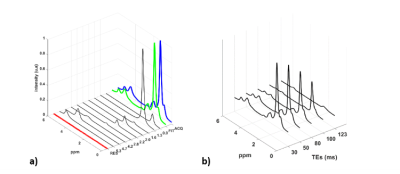
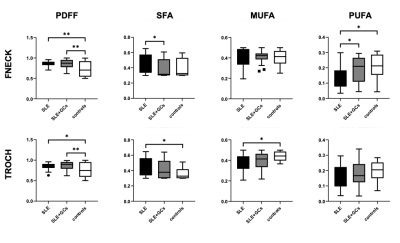
Figure 1 shows typical spectra obtained in the femoral neck after processing and multiple TE acquisition. Differences between fatty acids index are presented in figure 2.Discussion
This study is the first to assess the lipid profile for SLE in the proximal femur and show several significant differences in fatty acids composition profile linked to SLE. Bone marrow fat quantity is higher in SLE patients and did not differ compared to subjects undergoing GC therapy. SLE patients had higher SFA compared to controls in both the femoral neck (+0.12, p<0.05) and trochanter (+0.11, p<0.05), lower MUFA in the trochanter compared to controls (-0.05, p<0.05), and lower PUFA in the femoral neck compared to both controls (-0.07, p<0.05) and SLE patients on GC therapy (-0.05, p<0.05). Levels of PUFA were also lower in SLE subjects compared to both controls and SLE subjects on GC therapy.Conclusion
MRS allows assessment of proximal femur bone marrow adipose tissue composition in vivo. Prior studies have shown that bone marrow fat quantity and composition can influence bone health. Our findings provide further evidence SLE patients have altered proximal femur marrow fat metabolism and that this may reflect a manifestation of or play a role in these patients’ altered inflammatory response.Acknowledgements
No acknowledgement found.References
1. Yu C, Gershwin ME, Chang C. Diagnostic criteria for systemic lupus erythematosus: A critical review. Journal of Autoimmunity 2014;48-49:10-13.
2. Kalla AA, Fataar AB, Jessop SJ, Bewerunge L. Loss of trabecular bone mineral density in systemic lupus erythematosus. Arthritis & Rheumatism 1993;36(12):1726-1734.
3. Boyanov M, Robeva R, Popivanov P. Bone mineral density changes in women with systemic lupus erythematosus. Clinical rheumatology 2003;22(4):318-323.
4. Uaratanawong S, Deesomchoke U, Lertmaharit S, Uaratanawong S. Bone mineral density in premenopausal women with systemic lupus erythematosus. J Rheumatol 2003;30(11):2365-2368.
5. Mok CC, Mak A, Ma KM. Bone mineral density in postmenopausal Chinese patients with systemic lupus erythematosus. Lupus 2005;14(2):106-112.
6. Dieckmeyer M, Ruschke S, Cordes C, et al. The need for T₂ correction on MRS-based vertebral bone marrow fat quantification: implications for bone marrow fat fraction age dependence. NMR Biomed 2015;28(4):432-439.
7. Nemeth A, Segrestin B, Leporq B, et al. Comparison of MRI-derived vs. traditional estimations of fatty acid composition from MR spectroscopy signals. NMR Biomed 2018;31(9):e3991.
8. Naressi A, Couturier C, Castang I, de Beer R, Graveron-Demilly D. Java-based graphical user interface for MRUI, a software package for quantitation of in vivo/medical magnetic resonance spectroscopy signals. Comput Biol Med 2001;31(4):269-286.
9. Vanhamme L, van den Boogaart A, Van Huffel S. Improved method for accurate and efficient quantification of MRS data with use of prior knowledge. J Magn Reson 1997;129(1):35-43.
10. Hamilton G, Schlein AN, Middleton MS, et al. In vivo triglyceride composition of abdominal adipose tissue measured by (1) H MRS at 3T. J Magn Reson Imaging 2017;45(5):1455-1463.
Figures

Table 1: Subject demographic

Figure 1: a) Typical acquired MRS spectrum in proximal femur (ACQ) with its quantification (FIT) b) Multiple TE acquisition (TEs= 30, 50, 80, 100, 123ms) used to estimate T2 relaxation.

Figure 2: Difference in index reflecting fatty acids composition for controls, SLE+GCs and SLE in the femoral neck and trochanter region in term of PDFF (proton density fat fraction), SFA (saturated fatty-acids fat fraction), MUFA (mono-unsaturated fatty-acids fat fraction), and PUFA (polyunsaturated fatty-acids fat fraction). Statistical significance is highlighted by *p< 0.05, **p< 0.01.
DOI: https://doi.org/10.58530/2022/4951