4948
3T MRI Graph Analysis of the Proximal Femur trabecular network in Osteoporosis Subjects with Compared to Those without Prior Fragility Fractures
Anmol Monga1, Dimitri Martel1, Stephen Honig2, and Gregory Chang1
1Radiology, NYU Langone Health, New York, NY, United States, 2Osteoporosis Center, Hospital for Joint Diseases, NYU Langone Health, New York, NY, United States
1Radiology, NYU Langone Health, New York, NY, United States, 2Osteoporosis Center, Hospital for Joint Diseases, NYU Langone Health, New York, NY, United States
Synopsis
Detecting microstructural information in bones leads to improved diagnosis, monitoring, and understanding of osteoporosis in patients. Recent advances allow for comprehensive and automated mining of quantitative image features to capture disease characteristics. Among these, graph and network analysis permit to characterize and assess network as the trabecular one and been previously applied in the wrist. In this study, we aim to apply the graph and network analysis method to the femoral trabecular bone network of osteoporosis subjects with and without previous fragility fracture history and assess features associated with fracture.
Introduction
Detecting microstructural information in bones leads to improved diagnosis, monitoring, and understanding of osteoporosis in patients(1,2). Several direct and indirect tools such as bone mineral density (BMD), trabecular bone score, and finite element analysis of bone have been previously used to better understand bone health(3-6). These methods rely on the characterization of the apparent trabecular bone network derived from high-resolution images and permit standard stereological measures such as trabecular bone volume, mean trabecular width, mean trabecular spacing (7)(8). Recent advances allow for comprehensive and automated mining of quantitative image features to capture disease characteristics. Among these, graph and network analysis permit to characterize and assess network as the trabecular one and been previously applied in the wrist(9). In this study, we aim to apply the graph and network analysis method to the femoral trabecular bone network of osteoporosis subjects with and without previous fragility fracture history and assess features associated with fracture.Material/Method
This study had institutional review board approval, and we obtained written informed consent from all subjects.Subjects: We recruited n =40 female patients with osteoporosis diagnosis based on T-score threshold (spine or total hip T-score < - 2.5 SD) divided into two groups based on prior fragility fracture history (with fracture n=20, age =64±7years, BMI =20.93±2.13 kg/m² and without fracture n=20, age = 62±6 , BMI=20.45±2.59 kg/m² ).
Acquisition: Images of bone microarchitecture were acquired using a 3T MRI scanner; in the non-dominant proximal femur in a slightly oblique coronal plane parallel to the femoral neck; by using a three-dimensional FLASH sequence with the following parameters: TR/TE, 37/4.92 ms; Flip angle: 25°; matrix acquisition size: 512 x 512; field of view:120 mm; in-plane voxel resolution of 0.24x0.24 mm with 60 coronal slices of 1.5 mm thickness. Acquisition time was approximately 15 minutes.
Results
Processing pipeline of the graph analysis of trabecular bone network is presented in Fig. 1. Correlations between clinical parameters and graph features are depicted in Fig. 2. We found low positive graph features correlated with Femoral neck T-score and FRAX and low negative correlation with BMI.Table 1 gives graph features AUC: Wiener index show the maximum separability (p-value<0.03; AUC=0.709, p-value= 0.027) and Laplacian Matrix also show high predictive ability (AUC=0.708, p-value=0.027).
Discussion/Conclusion
Graph analysis demonstrated significant differences and can discriminate between OP with history of fracture. Correlation between feature and clinical parameters, notably FRAX scores, suggests microarchitecture deterioration is captured in the graph network. Further investigation and relationship with microarchitecture are needed in the future. Graph analysis demonstrated significant differences and can discriminate between OP with history of fracture. Correlation between feature and clinical parameters, notably FRAX scores, suggests microarchitecture deterioration is captured in the graph network. Further investigation and relationship with microarchitecture are needed in the future.Acknowledgements
No acknowledgement found.References
1. Bala Y, Zebaze R, Seeman E. Role of cortical bone in bone fragility. Curr Opin Rheumatol 2015;27(4):406-413.2. Adams JE. Advances in bone imaging for osteoporosis. Nat Rev Endocrinol 2013;9(1):28-42.
3. Rajapakse CS, Chang G. Micro-Finite Element Analysis of the Proximal Femur on the Basis of High-Resolution Magnetic Resonance Images. Curr Osteoporos Rep 2018;16(6):657-664.
4. Chang G, Honig S, Brown R, et al. Finite Element Analysis Applied to 3-T MR Imaging of Proximal Femur Microarchitecture: Lower Bone Strength in Patients with Fragility Fractures Compared with Control Subjects. Radiology 2014;272(2):464-474.
5. Griffith JF. Osteoporosis and Bone Densitometry Measurements. Medical Radiology 2013:69-85.
6. Leslie WD, Aubry-Rozier B, Lix LM, Morin SN, Majumdar SR, Hans D. Spine bone texture assessed by trabecular bone score (TBS) predicts osteoporotic fractures in men: The Manitoba Bone Density Program. Bone 2014;67:10-14.
7. Kumasaka S, Kiyohara S, Takahashi T, Asai H, Kashima I. Morphologically extracted trabecular skeleton superimposed upon digital radiograph structure. Journal of Bone and Mineral Metabolism 2000;18(4):208-211.
8. Majumdar S, Genant HK. Assessment of trabecular structure using high resolution magnetic resonance imaging. Stud Health Technol Inform 1997;40:81-96.
9. Pothuaud L, Newitt DC, Lu Y, MacDonald B, Majumdar S. In vivo application of 3D-line skeleton graph analysis (LSGA) technique with high-resolution magnetic resonance imaging of trabecular bone structure. Osteoporos Int 2004;15(5):411-419.
10. Juan Nunez-Iglesias, Adam J. Blanch, Oliver Looker, Matthew W. Dixon, and Leann Tilley. A new Python library to analyse skeleton images confirms malaria parasite remodelling of the red blood cell membrane skeleton. PeerJ, 6:e4312, 2018. doi:10.7717/peerj.4312.
11. A Hagberg, D Schult, P Swart, Exploring Network Structure, Dynamics, and Function using NetworkX in Proceedings of the 7th Python in Science conference (SciPy 2008), G Varoquaux, T Vaught, J Millman (Eds.), pp. 11-15
Figures

Table 1: Area Under the receiver operator curve (AU-ROC) for a) clinical parameters and b) graph feature in proximal trabecular bone region .
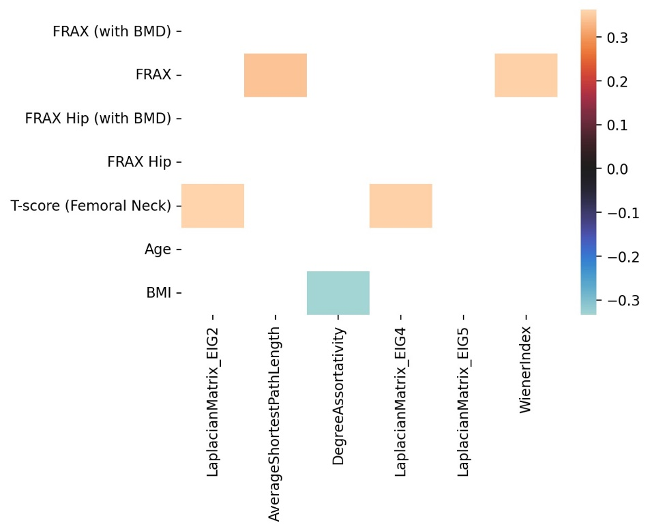
Figure 2: Correlation map between clinical parameters and graph features, only significant correlations are represented.
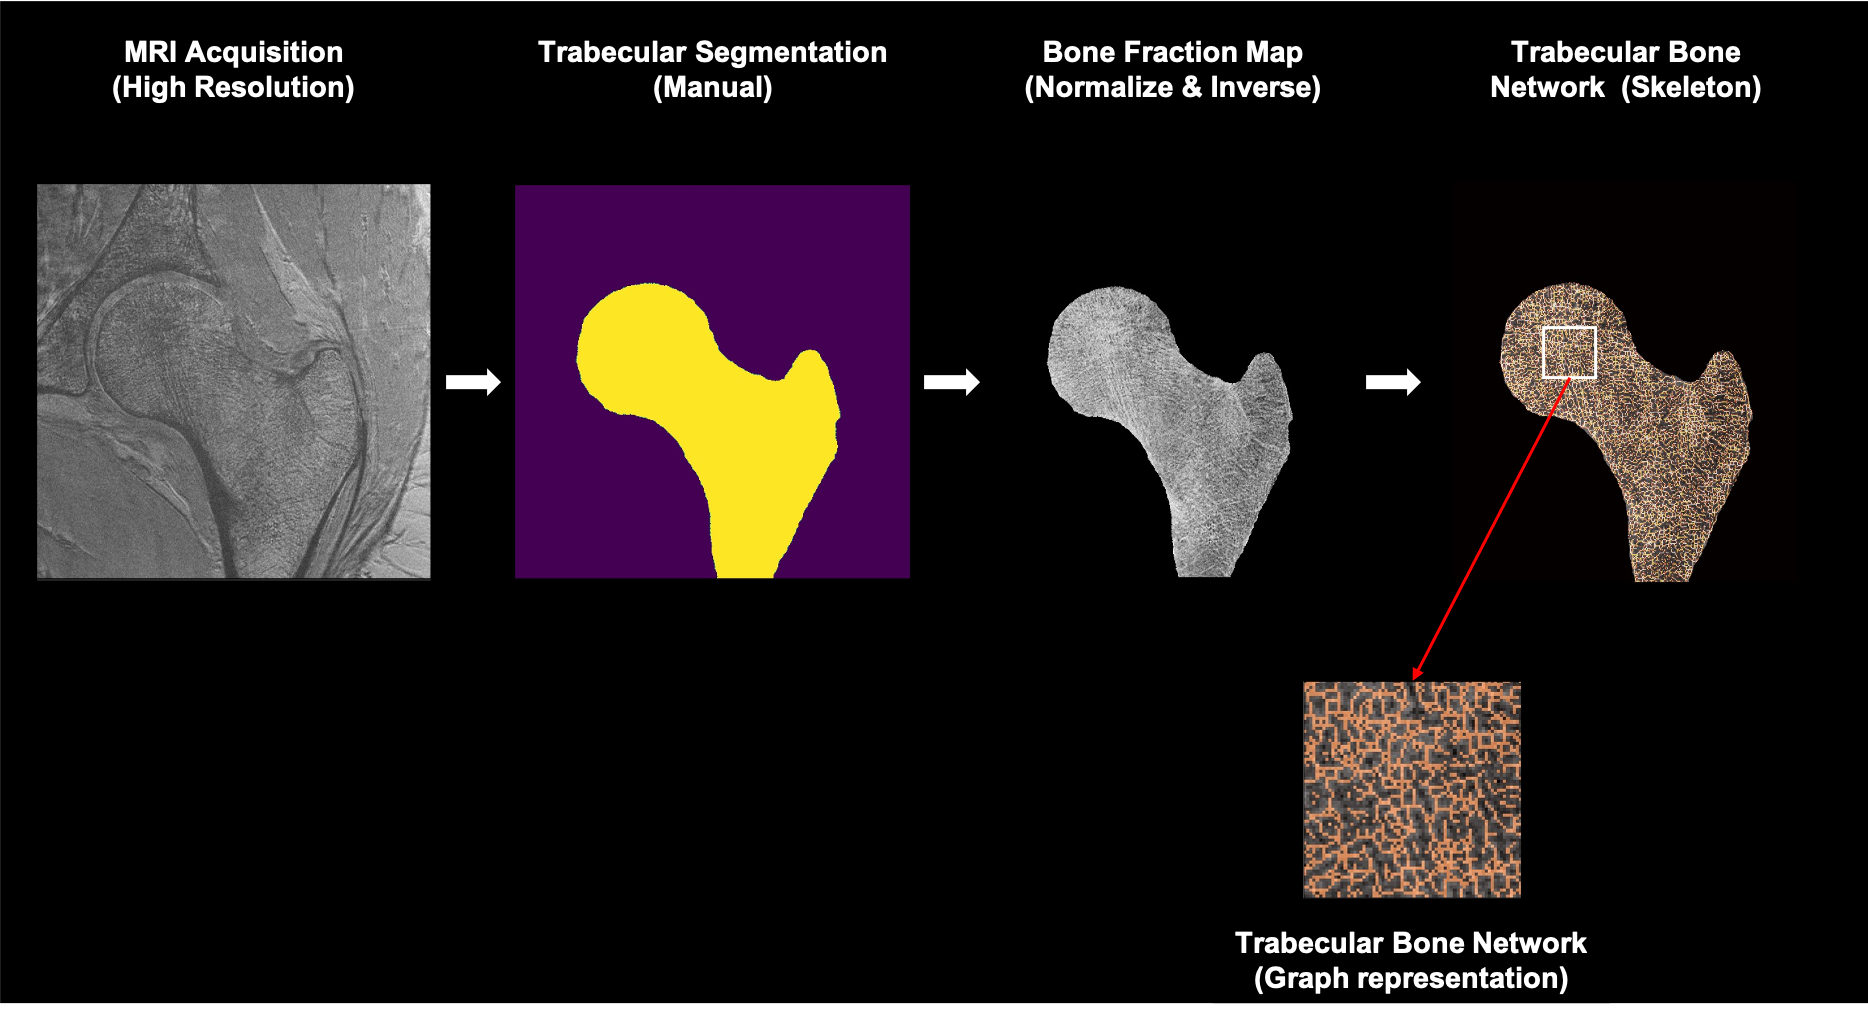
Figure 1: Processing pipeline for trabecular bone network graph analysis. From a high-resolution MRI acquisition, proximal femur trabecular bone region is segmented and bone fraction map is computed. Then from a skeletonization process a graph network is extracted and analyzed.
DOI: https://doi.org/10.58530/2022/4948