4947
Dynamic T1ρ and T2 mapping of Articular Cartilage Biochemical Recovery Post-exercise with 3T MRI1Department of Radiology, Albert Einstein College of Medicine and Montefiore Medical Center, Bronx, NY, United States, 2Memorial Sloan Kettering Cancer Center, New York, NY, United States
Synopsis
Osteoarthritis (OA) is a leading cause of disability characterized by proteoglycan loss and collagen matrix disruption in the cartilage. Quantitative T1ρ and T2 mapping obtained in a static setting have been proposed to detect the biochemical changes associated with OA, which however lack the functional information of the cartilage. We here present a novel dynamic approach to elucidate biochemical recovery of knee cartilage after stair-climbing exercise with high-spatiotemporal-resolution simultaneous 3D T1ρ and T2 mapping. It could serve as an innovative, clinically feasible imaging biomarker to evaluate both biochemical and functional properties of cartilage for early OA diagnosis and prognosis.
Introduction
Osteoarthritis (OA) is a leading cause of disability. It is characterized by proteoglycan loss and collagen matrix disruption in the cartilage. The biomechanical function of cartilage is tightly correlated with its structural and compositional properties.1 Therefore, functional evaluation of biomechanics of cartilage, elucidated by noninvasive imaging, can serve as a unique biomarker for early cartilage degeneration detection.2, 3 Quantitative T1ρ and T2 MRI have been shown to detect the biochemical changes such as proteoglycan loss and collagen matrix disintegration. However, these methods are limited to studying cartilage in a static setting because of long scan times and low spatial resolution needed. Therefore, the biomechanical function status of the cartilage cannot be determined to improve sensitivity of early cartilage injury detection. In this study, we present an innovative dynamic 3D-MRI method for observing early cartilage defects leading to OA. With this method, we can visualize biochemical responses in knee cartilage post-exercise achieved by combining T1ρ and T2 acquisitions in a dynamic sequence to evaluate transient cartilage recovery with high spatiotemporal resolution.Methods
Six (5 male, 1female) healthy volunteers, ages 27-33, with no history of knee conditions were recruited. Subjects avoided strenuous activity for 24 hours, prior to 20 min of stair-climbing activity. Subjects were immediately scanned (<2.5 min post-exercise) on a 3T MR scanner (Philips Ingenia) with a 1Tx/16Rx knee coil. Both adiabatic T1ρ and T2 mapping were integrated into a single MAPSS sequence using an unpaired phase cycling scheme to improve imaging speed.4-6 The sequence schematic is shown in Figure 1. The adb-T1ρ preparation had adiabatic RF pulse shape HS1, B1max = 26.19µT, ωmax=1.27kHz, and R=6.7 The adb-T1ρ and T2 preparations had five 3D acquisitions with TSL = 0+, 96+, 96- ms and TE = 40+, 40- ms acquired in an interleaved fashion with alternating phase-cycling, sharing the same TSL/TE=0ms acquisition.4, 5 Other parameters included Tsr=2.5s, TI=1480ms (for synovial fluid suppression),8 and GRE readout train length=128. The 3D dynamic sequence had ~1 min temporal resolution with 0.4×0.7×4mm3 spatial resolution for ~25 minutes. Dynamic T1ρ and T2 maps were generated simultaneously using a moving window along the dynamic (temporal) direction after motion correction using Elastix.5 Regions-of-interest (ROIs) were manually drawn on superficial and deep layers of the lateral and medial central weight-bearing tibial cartilages. The post-exercise T1ρ and T2 relaxation recovery time-courses were compared between lateral and medial articular surfaces. The recovery curves of two apparent focal arthritic lesions, both identified on medial cartilage from two participants identified from the T2 maps, were also compared with those of normal control cartilage areas to demonstrate the difference in recovery dynamics. The relaxation time recovery was modeled with linear regression with recovery rate defined as the slope.Results
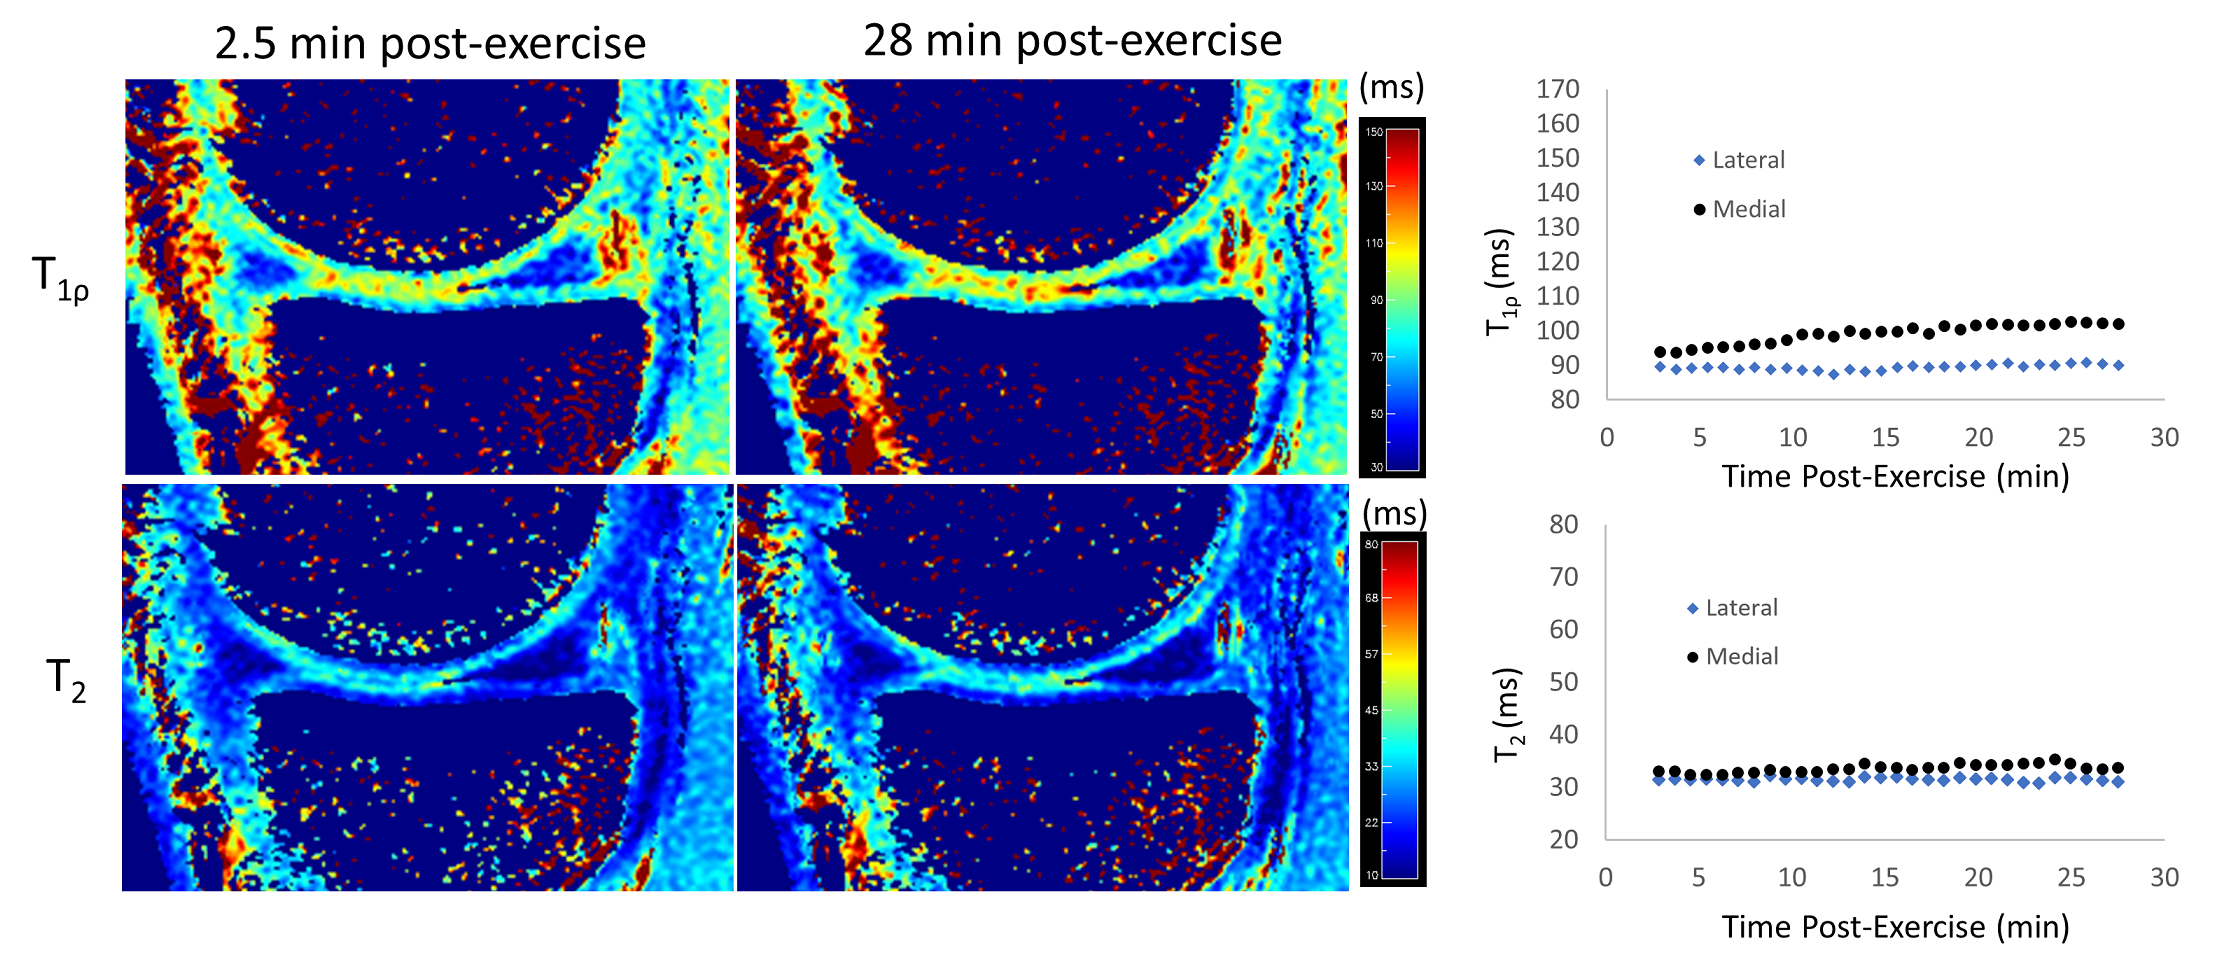
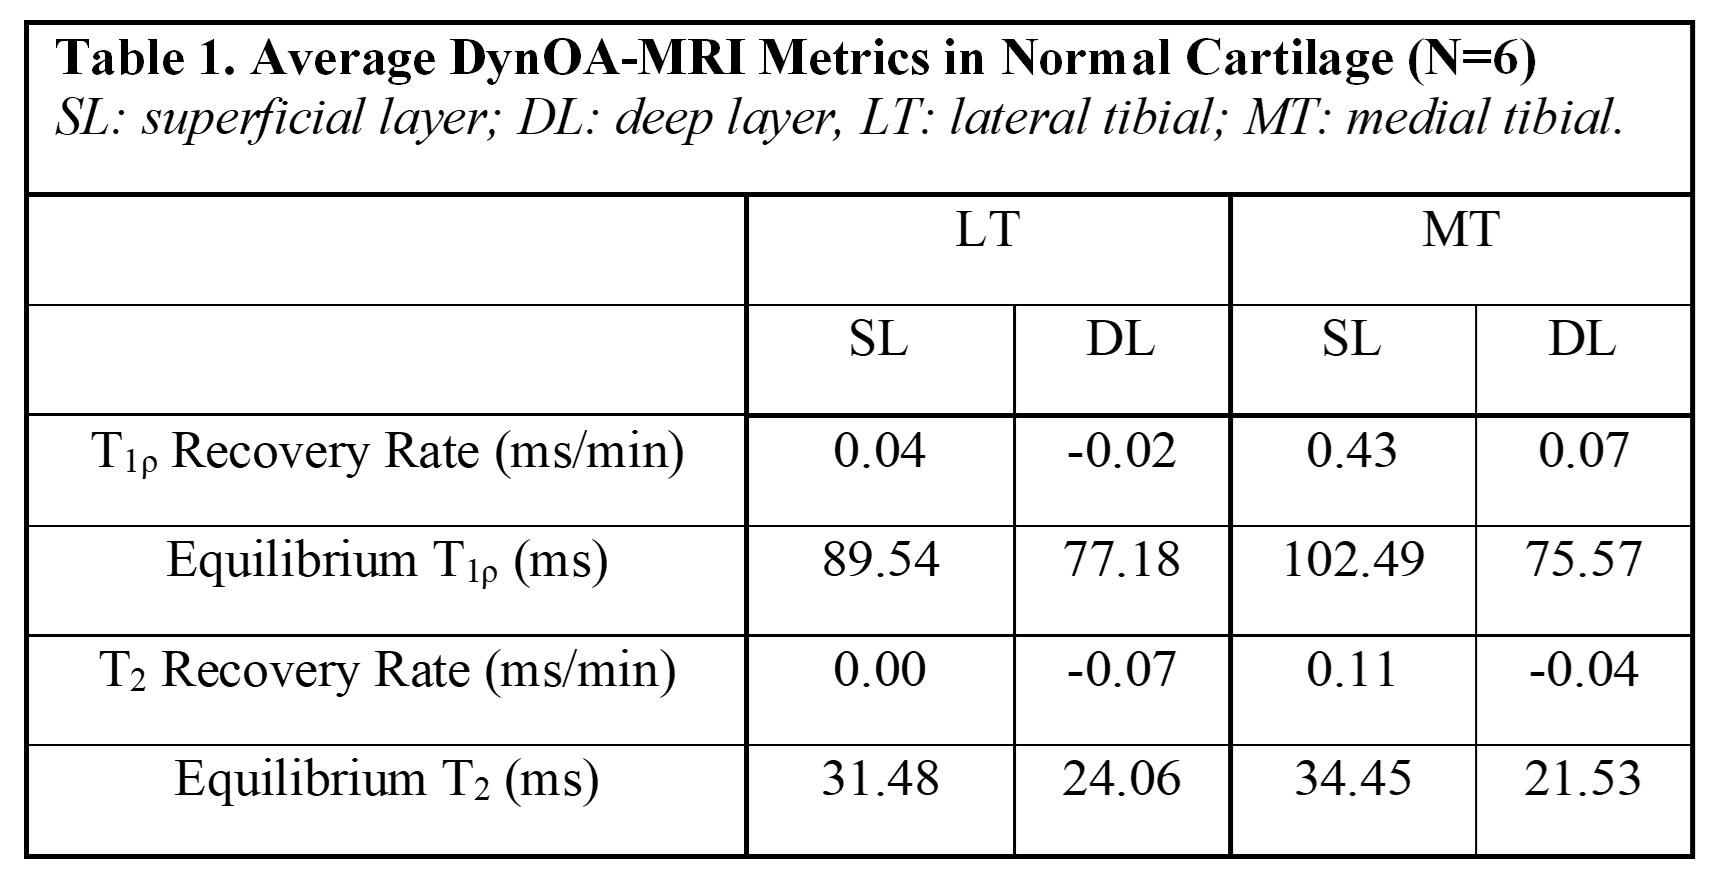
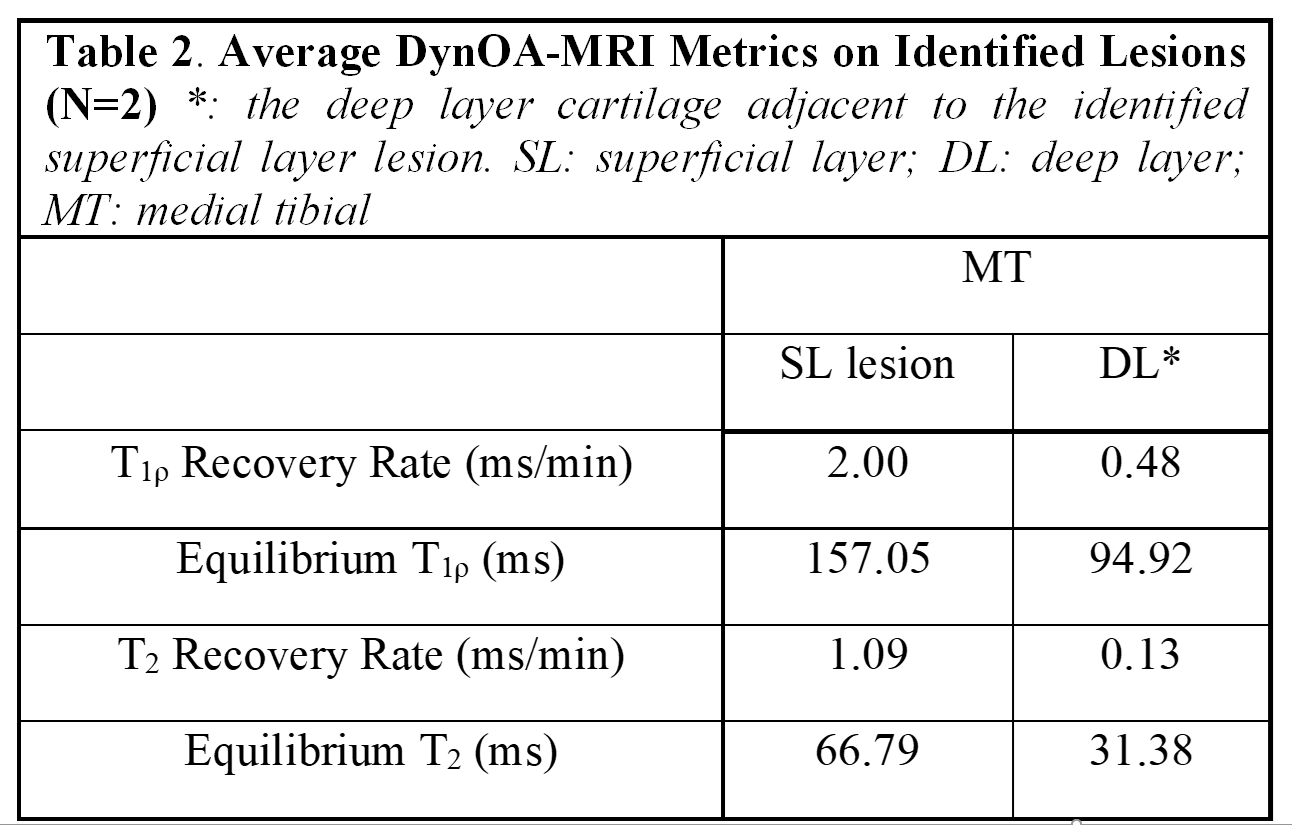
In healthy cartilage, T1ρ and T2 relaxation times generally demonstrated minimal or no appreciable recovery within 30 min post exercise (Figure 2). In addition, the cartilage superficial layer demonstrated higher T1ρ recovery rates than the deep layer, and the medial compartment higher than the lateral compartment (0.43 vs 0.04 ms/min) (Table 1). The apparent focal arthritic lesions had much higher overall T1ρ (2.00 vs 0.43 ms/min) and T2 (1.09 vs 0.11 ms/min) recovery rates when compared with adjacent healthy cartilage, respectively. T1ρ rates of lesions were markedly different from those of normal cartilages (Table 2). Figure 3 shows the results of the medial tibial compartment of one of these two volunteers. The T1ρ time course of this lesion demonstrated an initially linear rise in T1ρ, followed by a plateau after ~23 min. Adiabatic T1ρ maps had much higher dynamic range than T2 mapping, potentially leading to higher sensitivity for post-exercise change. Note that the size of the focal lesions shown on the T1ρ maps was much larger than on the T2 maps, indicating that the adb-T1ρ contrast offers different or complementary information to T2 contrast, such as on PG content and collagen structure integrity.Discussion
Our goal of this pilot study was to explore how post-exercise quantitative dynamic MRI could demonstrate both biochemical and functional properties of cartilage tissue that might provide more information about cartilage status to complement purely static T1ρ- or T2-mapping MRI. For the first time, DynOA-MRI's high temporal (0.4×0.7×4mm3) and spatial resolution (51sec/volume for 26 mins) enabled assessment of immediate post-exercise cartilage recovery of T1ρ and T2 values. Both T1ρ and T2 values in the evaluated superficial cartilages recovers approximately linearly in the first ~23 min and then plateaus afterwards. Additionally, the apparent focal arthritic lesions showed much larger magnitude of changes compared to the normal cartilages. Notably, T1ρ and T2 recovery curves of cartilage in all the subjects differed from the response of adjacent muscles, whose T1ρ and T2 values exponentially decayed to their equilibria (data not shown). Dynamic MRI to follow changes in the cartilage after exercise is likely more sensitive in visualizing early damage, prior to irreversible degeneration. This would enable earlier and more effective treatments.Conclusion
This pilot study demonstrates the feasibility of using T1ρ and T2 relaxation recovery rates obtained immediately post-exercise as novel quantitative biomarkers for early OA diagnosis.Acknowledgements
No acknowledgement found.References
1. Saarakkala S, Julkunen P, Kiviranta P, et al. Depth-wise progression of osteoarthritis in human articular cartilage: investigation of composition, structure and biomechanics. Osteoarthritis Cartilage. 2010;18(1):73-81.
2. Hatcher CC, Collins AT, Kim SY, et al. Relationship between T1rho magnetic resonance imaging, synovial fluid biomarkers, and the biochemical and biomechanical properties of cartilage. J Biomech. 2017;55:18-26.
3. Heijink A, Gomoll AH, Madry H, et al. Biomechanical considerations in the pathogenesis of osteoarthritis of the knee. Knee Surg Sports Traumatol Arthrosc. 2012;20(3):423-435.
4. Peng Q, Wu C, Kim J, et al. Efficient Phase Cycling Strategy for High Resolution 3D GRE Quantitative MRI Mapping. NMR in Biomedicine. 2021;Under Review.
5. Peng Q, Wu C. High Spatial Resolution Simultaneous Quantitative T1rho and T2 Mapping at 3T. AAPM Annual Meeting. 2021.
6. Li X, Han ET, Busse RF, et al. In vivo T(1rho) mapping in cartilage using 3D magnetization-prepared angle-modulated partitioned k-space spoiled gradient echo snapshots (3D MAPSS). Magn Reson Med. 2008;59(2):298-307.
7. Wu C, Peng Q. 3D MAPSS T1ρ Mapping with Adiabatic Spin-Locking RF Pulses for Knee and Brain at 3T. Proc Intl Soc Mag Reson Med 29. 2021.
8. Peng Q, Wu C, Li X, et al. Improved 3D T1rho and T2 Mapping with Synovial Fluid Suppression for the Knee Cartilage on 3T. Proc Intl Soc Mag Reson Med 26. 2018:5056.
Figures